SlideShare a Scribd company logo
1 of 13
Download to read offline
Unit 11 June
1. CARTESIAN COORDINATES.
Using Cartesian Coordinates we mark a point on a graph by how far along and
how far up it is:
The point (12,5) is 12 units along, and 5 units up.
The left-right (horizontal) direction is commonly called X. Is also called The X-
Coordinate Axis or Abscissa Axis.
The up-down (vertical) direction is commonly called Y. Is also called the Y-
Coordinate Axis or Ordinate Axis.
Put them together on a graph:
Axel Cotón Gutiérrez Mathematics 1º ESO 11.1
Unit 11 June
Where they cross over is the "(𝟎𝟎, 𝟎𝟎)" point, called Origin of Coordinates; you
measure everything from there.
It is like we put two Number Lines together, one going left-right, and the other
going down-up.
Axel Cotón Gutiérrez Mathematics 1º ESO 11.2
Unit 11 June
As 𝒙𝒙 increases, the point moves further right. When 𝒙𝒙 decreases, the point
moves further to the left. As 𝒚𝒚 increases, the point moves further up. When 𝒚𝒚
decreases, the point moves further down. The coordinates are always written in a
certain order:
• the Horizontal distance first,
• then the Vertical distance.
This is called an "Ordered Pair" (a pair of numbers in a special order)
And usually the numbers are separated by a comma, and parentheses are put
around the whole thing like this:
( 𝟒𝟒, 𝟓𝟓)
Just like with the Number Line, you can also have Negative Values. Negative:
start at zero and head in the opposite direction:
• Negative 𝒙𝒙 goes to the left.
• Negative 𝒚𝒚 goes down.
MATH VOCABULARY: Cartesian Coordinates, Graph, Axis, Origin of Coordinates,
Abscissa, Ordinate, Ordered Pair.
Axel Cotón Gutiérrez Mathematics 1º ESO 11.3
Unit 11 June
2. GRAPHS.
In everyday life, many quantities depend on one or more changing Variables.
For example:
• Plant growth depends on sunlight and rainfall.
• Distance travelled depends on speed and time taken.
• Test marks depend on attitude, listening in lectures and doing tutorials (among
many other variables!!).
Graphs can be used to quickly get an idea of how one quantity varies as
another quantity changes.
This graph shows Dan’s journey on his bike. We can see we use points to see where
the graphs changes.
Axel Cotón Gutiérrez Mathematics 1º ESO 11.4
Unit 11 June
A Function is a relation between two variables such that for every value of the
first, there is only one corresponding value of the second. We say that the second
variable is a function of the first variable.
The first variable is the Independent Variable (usually 𝒙𝒙), and the second
variable is the Dependent Variable (usually 𝒚𝒚). A good way of presenting a Function is
by Graphical Representation. Graphs give us a visual picture of the function.
Normally, the values of the Independent Variable (generally the 𝒙𝒙 − 𝒗𝒗𝒗𝒗𝒗𝒗 𝒗𝒗𝒗𝒗𝒗𝒗)
are placed on the Horizontal Axis, while the values of the Dependent Variable
(generally the 𝒚𝒚 − 𝒗𝒗𝒗𝒗𝒗𝒗 𝒗𝒗𝒗𝒗𝒗𝒗) are placed on the Vertical Axis.
The following graph shows the present people (in thousands) in a shopping centre
during a day.
The function increases in the intervals (9, 12) and (14, 18).
Axel Cotón Gutiérrez Mathematics 1º ESO 11.5
Unit 11 June
The function decreases in the intervals (12, 14) and (18, 24).
The point (12, 3) is a local maximum and the point (14, 2) is a local minimum.
At 09:00 the function has the global minimum and at 18:00 the function has the global
maximum (5000 people).
MATH VOCABULARY: Function, Independent Variable, Dependent Variable, Graphical
Representation, Interval, Maximum, Minimum.
3. STATISTICS.
Statistics is the science of making effective use of data relating to groups of
individuals or experiments. It deals with all aspects of this, including not only the
collection, organization, presentation, analysis and interpretation of data, but also the
planning of the collection of them, in terms of the design of surveys and experiments.
Imagine you have to make a study of the leisure activities in a city. The
Population of this study will be the group of inhabitants of that city. A part of this
group is called Sample. Therefore, the Population is the whole group of units that you
are going to study and a Sample is a subset of the population. Each unit of the
population is called Individual.
The owner of a screw factory wants to make a quality control. He picks up 1 out of
every 100 produced screws and then he analyses them.
The population is the total number of the screws of the factory.
The sample is 1% of the population.
The individuals are each one of the screws.
Statistical Variables are things that we measure, control or manipulate in
research. They can be numbers, words, measurements, observations ... Statistical
Variables can be Qualitative or Quantitative.
Axel Cotón Gutiérrez Mathematics 1º ESO 11.6
Unit 11 June
• Qualitative Variable is descriptive information (describes something).
Examples: eyes color, car brands, leisure activities …
• Quantitative Variable is numerical information (numbers). Examples: height,
age, number of televisions in each house …
You can collect data using a Data-Collection Sheet. This one is a tally chart.
Data can also be shown in a Frequency Table:
The number of televisions in each house of my street is shown in the frequency table.
The number of houses in my street are:
Axel Cotón Gutiérrez Mathematics 1º ESO 11.7
Unit 11 June
1 + 5 + 12 + 9 + 1 = 28 houses
The number of TVs are:
0 + 5 + 24 + 27 + 4 = 60 TVs
The Relative Frequency is a percentage of the Frequency:
𝑹𝑹𝑹𝑹 =
𝑭𝑭𝑭𝑭𝑭𝑭𝑭𝑭𝒖𝒖𝒆𝒆𝒆𝒆𝒆𝒆𝒆𝒆
𝑻𝑻𝑻𝑻𝑻𝑻𝑻𝑻𝑻𝑻 𝑵𝑵𝑵𝑵𝑵𝑵𝑵𝑵𝑵𝑵𝑵𝑵 𝒐𝒐𝒐𝒐 𝑰𝑰𝑰𝑰𝑰𝑰𝑰𝑰𝑰𝑰𝑰𝑰 𝑰𝑰𝑰𝑰𝑰𝑰𝑰𝑰𝑰𝑰
MATH VOCABULARY: Statistics, Population, Sample, Individual, Statistical Variables,
Qualitative, Quantitative, Data-Collection Sheet, Frequency Table, Relative Frequency.
4. STATISTICS GRAPHS.
You can use a variety of Diagrams and Charts to display data.
A Bar Graph (also called Bar Chart) is a graphical display of data using bars of
different heights.
Axel Cotón Gutiérrez Mathematics 1º ESO 11.8
Unit 11 June
It is a really good way to show Relative Sizes: we can see which types of movie
are most liked, and which are least liked, at a glance. We can use bar graphs to show
the relative sizes of many things, such as what type of car people have, how many
customers a shop has on different days and so on.
A Histogram is a graphical display of data using bars of different heights.
It is similar to a Bar Chart, but a histogram groups numbers into Ranges.
Pie Chart: a special chart that uses "pie slices" to show relative sizes of data.
Axel Cotón Gutiérrez Mathematics 1º ESO 11.9
Unit 11 June
It is a really good way to show Relative Sizes: it is easy to see which movie
types are most liked, and which are least liked, at a glance. To calculate each sector we
use the Relative Frequency to find the angle of the sector.
We can use a Frequency Polygon to display grouped continuous data:
MATH VOCABULARY: Chart, Bar Graph, Histogram, Ranges, Pie Chart, Frequency
Polygon.
Axel Cotón Gutiérrez Mathematics 1º ESO 11.10
Unit 11 June
5. MEASURES OF CENTRAL TENDENCY.
Measures of Central Tendency –Mean, Mode, and Median- can help you
capture, with a single number, what is typical or representative of the data.
• The Mean of a set of data is the total of all the values divided by the number of
values, that is, the average value of all the data in the set. The mean is denoted
by 𝒙𝒙�.
• The Mode is the value that occurs most often. (The mode is sometimes called
the modal value).
• The Median is the middle value when the data is arranged in order, that is, the
value that has exactly half the data above it and half bellow it.
Calculate the mean, mode and median of 8, 3, 8, 7, 5
𝑀𝑀𝑒𝑒𝑒𝑒𝑒𝑒 = 𝒙𝒙� =
8 + 3 + 8 + 7 + 5
5
=
31
5
= 6.2
𝑀𝑀𝑜𝑜𝑜𝑜𝑜𝑜 = 8, 𝑎𝑎𝑎𝑎 8 𝑜𝑜𝑜𝑜𝑜𝑜𝑜𝑜𝑜𝑜𝑜𝑜 𝑚𝑚𝑚𝑚𝑚𝑚𝑚𝑚 𝑜𝑜𝑜𝑜𝑜𝑜𝑜𝑜𝑜𝑜
For the median, first arrange the numbers in numerical order
3 5 7 8 8
The one in the Middle is 7 → 𝑀𝑀𝑀𝑀𝑀𝑀𝑀𝑀𝑀𝑀𝑀𝑀 = 7
MATH VOCABULARY: Measures of Central Tendency, Mean, Mode, Median.
Axel Cotón Gutiérrez Mathematics 1º ESO 11.11
Unit 11 June
6. PROBABILITY.
Random experiments are those that can’t be predicted with total certainty.
Tossing a coin, rolling a dice, choosing a card from a deck, choosing a marble from a
bag, …
The set of all possible Outcomes (results) of a random experiment is called the
Sample Space (𝑺𝑺). The basic outcomes of an experiment are also known as Elementary
Events. An Event is a set of outcomes, that is, a subset of the Sample Space.
Sample Space: 𝑆𝑆 = {1, 2, 3, 4, 5, 6}
{1}, {2}, {3}, {4}, {5} and {6} are elementary events
𝐴𝐴 = {5, 6} is an event that has two elementary events.
• Sure Event: event that always occurs, whatever the result of the experiment is.
The sample space 𝑺𝑺 is a sure event.
• Impossible Event: event that never occurs, whatever the result of the
experiment is. The empty set ∅ is an impossible event.
We can calculate the Theoretical Probability when an event is fair or unbiased.
Theoretical probability is based on Equally Likely Outcomes
Axel Cotón Gutiérrez Mathematics 1º ESO 11.12
Unit 11 June
𝑃𝑃[𝑅𝑅𝑅𝑅𝑑𝑑 𝑏𝑏𝑎𝑎𝑙𝑙𝑙𝑙 𝑖𝑖𝑛𝑛 𝐴𝐴 𝑏𝑏𝑜𝑜𝑜𝑜] =
4
7
= 0.57
𝑃𝑃[𝐺𝐺𝑟𝑟𝑟𝑟𝑟𝑟𝑟𝑟 𝑏𝑏𝑎𝑎𝑙𝑙𝑙𝑙 𝑖𝑖𝑛𝑛 𝐵𝐵 𝑏𝑏𝑜𝑜𝑜𝑜] =
4
7
= 0.57
MATH VOCABULARY: Random Experiments, Sample Space, Elementary Events, Sure
Event, Impossible Event, Theoretical Probability.
Axel Cotón Gutiérrez Mathematics 1º ESO 11.13

More Related Content

Similar to 1 ESO - UNIT 11 - GRAPHS AND TABLES. PROBABILITY.

maths project.docx
maths project.docxmaths project.docx
maths project.docxyurDhitl
 
Statistics in research
Statistics in researchStatistics in research
Statistics in researchBalaji P
 
MATHEMATICS.pptx
MATHEMATICS.pptxMATHEMATICS.pptx
MATHEMATICS.pptxojaswi12
 
Biostatistical methods
Biostatistical methodsBiostatistical methods
Biostatistical methodsPrakkan Hillol
 
Quantitative techniques in geography
Quantitative techniques in geographyQuantitative techniques in geography
Quantitative techniques in geographyDalbirAntil
 
Wynberg girls high-Jade Gibson-maths-data analysis statistics
Wynberg girls high-Jade Gibson-maths-data analysis statisticsWynberg girls high-Jade Gibson-maths-data analysis statistics
Wynberg girls high-Jade Gibson-maths-data analysis statisticsWynberg Girls High
 
Statistics and probability pp
Statistics and  probability ppStatistics and  probability pp
Statistics and probability ppRuby Vidal
 
descriptive and inferential statistics
descriptive and inferential statisticsdescriptive and inferential statistics
descriptive and inferential statisticsMona Sajid
 
Introduction to Statistics and Statistical Inference
Introduction to Statistics and Statistical InferenceIntroduction to Statistics and Statistical Inference
Introduction to Statistics and Statistical InferenceJezhabeth Villegas
 
Introduction to Statistics - Part 1
Introduction to Statistics - Part 1Introduction to Statistics - Part 1
Introduction to Statistics - Part 1Damian T. Gordon
 
Introduction to Statistics and Probability
Introduction to Statistics and ProbabilityIntroduction to Statistics and Probability
Introduction to Statistics and ProbabilityBhavana Singh
 
statistics - Populations and Samples.pdf
statistics - Populations and Samples.pdfstatistics - Populations and Samples.pdf
statistics - Populations and Samples.pdfkobra22
 
1_INTRODUCTION TO STATISTICS AND STATISTICAL INFERENCE.ppt
1_INTRODUCTION TO STATISTICS AND STATISTICAL INFERENCE.ppt1_INTRODUCTION TO STATISTICS AND STATISTICAL INFERENCE.ppt
1_INTRODUCTION TO STATISTICS AND STATISTICAL INFERENCE.pptJhuveLhynn
 
Unit 1 - Mean Median Mode - 18MAB303T - PPT - Part 1.pdf
Unit 1 - Mean Median Mode - 18MAB303T - PPT - Part 1.pdfUnit 1 - Mean Median Mode - 18MAB303T - PPT - Part 1.pdf
Unit 1 - Mean Median Mode - 18MAB303T - PPT - Part 1.pdfAravindS199
 
Basic biostatistics dr.eezn
Basic biostatistics dr.eeznBasic biostatistics dr.eezn
Basic biostatistics dr.eeznEhealthMoHS
 

Similar to 1 ESO - UNIT 11 - GRAPHS AND TABLES. PROBABILITY. (20)

maths project.docx
maths project.docxmaths project.docx
maths project.docx
 
Statistics in research
Statistics in researchStatistics in research
Statistics in research
 
Day 3 descriptive statistics
Day 3  descriptive statisticsDay 3  descriptive statistics
Day 3 descriptive statistics
 
MATHEMATICS.pptx
MATHEMATICS.pptxMATHEMATICS.pptx
MATHEMATICS.pptx
 
Exponential functions
Exponential functionsExponential functions
Exponential functions
 
Biostatistical methods
Biostatistical methodsBiostatistical methods
Biostatistical methods
 
Quantitative techniques in geography
Quantitative techniques in geographyQuantitative techniques in geography
Quantitative techniques in geography
 
Wynberg girls high-Jade Gibson-maths-data analysis statistics
Wynberg girls high-Jade Gibson-maths-data analysis statisticsWynberg girls high-Jade Gibson-maths-data analysis statistics
Wynberg girls high-Jade Gibson-maths-data analysis statistics
 
Statistics and probability pp
Statistics and  probability ppStatistics and  probability pp
Statistics and probability pp
 
9주차
9주차9주차
9주차
 
descriptive and inferential statistics
descriptive and inferential statisticsdescriptive and inferential statistics
descriptive and inferential statistics
 
Introduction to Statistics and Statistical Inference
Introduction to Statistics and Statistical InferenceIntroduction to Statistics and Statistical Inference
Introduction to Statistics and Statistical Inference
 
Introduction to Statistics - Part 1
Introduction to Statistics - Part 1Introduction to Statistics - Part 1
Introduction to Statistics - Part 1
 
Introduction to Statistics and Probability
Introduction to Statistics and ProbabilityIntroduction to Statistics and Probability
Introduction to Statistics and Probability
 
Re appr unit 15
Re   appr unit 15Re   appr unit 15
Re appr unit 15
 
statistics - Populations and Samples.pdf
statistics - Populations and Samples.pdfstatistics - Populations and Samples.pdf
statistics - Populations and Samples.pdf
 
1_INTRODUCTION TO STATISTICS AND STATISTICAL INFERENCE.ppt
1_INTRODUCTION TO STATISTICS AND STATISTICAL INFERENCE.ppt1_INTRODUCTION TO STATISTICS AND STATISTICAL INFERENCE.ppt
1_INTRODUCTION TO STATISTICS AND STATISTICAL INFERENCE.ppt
 
Unit 1 - Mean Median Mode - 18MAB303T - PPT - Part 1.pdf
Unit 1 - Mean Median Mode - 18MAB303T - PPT - Part 1.pdfUnit 1 - Mean Median Mode - 18MAB303T - PPT - Part 1.pdf
Unit 1 - Mean Median Mode - 18MAB303T - PPT - Part 1.pdf
 
Basic biostatistics dr.eezn
Basic biostatistics dr.eeznBasic biostatistics dr.eezn
Basic biostatistics dr.eezn
 
Statistics and Probability.pdf
Statistics and Probability.pdfStatistics and Probability.pdf
Statistics and Probability.pdf
 

More from Gogely The Great

Acumuladores Huch Alemanes Alta Capacidad Solar Térmica
Acumuladores Huch Alemanes Alta Capacidad Solar TérmicaAcumuladores Huch Alemanes Alta Capacidad Solar Térmica
Acumuladores Huch Alemanes Alta Capacidad Solar TérmicaGogely The Great
 
Vasos de Expansión Zilmet solarplus
Vasos de Expansión Zilmet solarplusVasos de Expansión Zilmet solarplus
Vasos de Expansión Zilmet solarplusGogely The Great
 
Tyfocor LS Hoja de Seguridad
Tyfocor LS Hoja de SeguridadTyfocor LS Hoja de Seguridad
Tyfocor LS Hoja de SeguridadGogely The Great
 
Tyfocor L Hoja de Seguridad
Tyfocor L Hoja de SeguridadTyfocor L Hoja de Seguridad
Tyfocor L Hoja de SeguridadGogely The Great
 
Montaje Termosifón Ts 300
Montaje Termosifón Ts 300Montaje Termosifón Ts 300
Montaje Termosifón Ts 300Gogely The Great
 
Montaje Termosifón Ts 150
Montaje Termosifón Ts 150Montaje Termosifón Ts 150
Montaje Termosifón Ts 150Gogely The Great
 
Manual de uso y Montaje de los depósitos de inercia P 1000 SWT
Manual de uso y Montaje de los depósitos de inercia P 1000 SWTManual de uso y Montaje de los depósitos de inercia P 1000 SWT
Manual de uso y Montaje de los depósitos de inercia P 1000 SWTGogely The Great
 
Certificado AS Solar ISFH Colectores
Certificado AS Solar ISFH ColectoresCertificado AS Solar ISFH Colectores
Certificado AS Solar ISFH ColectoresGogely The Great
 
Estación Solar AS Solar Ibérica
Estación Solar AS Solar IbéricaEstación Solar AS Solar Ibérica
Estación Solar AS Solar IbéricaGogely The Great
 
Manual de Montaje y uso Depósito FSK
Manual de Montaje y uso Depósito FSKManual de Montaje y uso Depósito FSK
Manual de Montaje y uso Depósito FSKGogely The Great
 
Catálogo AS Solar Ibérica
Catálogo AS Solar IbéricaCatálogo AS Solar Ibérica
Catálogo AS Solar IbéricaGogely The Great
 
Acumuladores AS Solar Ibérica
Acumuladores AS Solar IbéricaAcumuladores AS Solar Ibérica
Acumuladores AS Solar IbéricaGogely The Great
 
Válvulas Termostáticas vta323 hoja
Válvulas Termostáticas vta323 hojaVálvulas Termostáticas vta323 hoja
Válvulas Termostáticas vta323 hojaGogely The Great
 

More from Gogely The Great (20)

Acumuladores Huch Alemanes Alta Capacidad Solar Térmica
Acumuladores Huch Alemanes Alta Capacidad Solar TérmicaAcumuladores Huch Alemanes Alta Capacidad Solar Térmica
Acumuladores Huch Alemanes Alta Capacidad Solar Térmica
 
Vasos de Expansión Zilmet solarplus
Vasos de Expansión Zilmet solarplusVasos de Expansión Zilmet solarplus
Vasos de Expansión Zilmet solarplus
 
Tyfocor LS tablas
Tyfocor LS tablasTyfocor LS tablas
Tyfocor LS tablas
 
Tyfocor LS Hoja de Seguridad
Tyfocor LS Hoja de SeguridadTyfocor LS Hoja de Seguridad
Tyfocor LS Hoja de Seguridad
 
Tyfocor L tablas
Tyfocor L tablasTyfocor L tablas
Tyfocor L tablas
 
Tyfocor L Hoja de Seguridad
Tyfocor L Hoja de SeguridadTyfocor L Hoja de Seguridad
Tyfocor L Hoja de Seguridad
 
Montaje depósitos TTK
Montaje depósitos TTKMontaje depósitos TTK
Montaje depósitos TTK
 
Montaje Termosifón Ts 300
Montaje Termosifón Ts 300Montaje Termosifón Ts 300
Montaje Termosifón Ts 300
 
Montaje Termosifón Ts 150
Montaje Termosifón Ts 150Montaje Termosifón Ts 150
Montaje Termosifón Ts 150
 
Certificado AS CPC
Certificado AS CPC Certificado AS CPC
Certificado AS CPC
 
Centralita Paw Solex
Centralita Paw SolexCentralita Paw Solex
Centralita Paw Solex
 
Centralita Paw friwa
Centralita Paw friwaCentralita Paw friwa
Centralita Paw friwa
 
Manual de uso y Montaje de los depósitos de inercia P 1000 SWT
Manual de uso y Montaje de los depósitos de inercia P 1000 SWTManual de uso y Montaje de los depósitos de inercia P 1000 SWT
Manual de uso y Montaje de los depósitos de inercia P 1000 SWT
 
Certificado AS Solar ISFH Colectores
Certificado AS Solar ISFH ColectoresCertificado AS Solar ISFH Colectores
Certificado AS Solar ISFH Colectores
 
Hoja presupuesto AS Solar
Hoja presupuesto AS SolarHoja presupuesto AS Solar
Hoja presupuesto AS Solar
 
Estación Solar AS Solar Ibérica
Estación Solar AS Solar IbéricaEstación Solar AS Solar Ibérica
Estación Solar AS Solar Ibérica
 
Manual de Montaje y uso Depósito FSK
Manual de Montaje y uso Depósito FSKManual de Montaje y uso Depósito FSK
Manual de Montaje y uso Depósito FSK
 
Catálogo AS Solar Ibérica
Catálogo AS Solar IbéricaCatálogo AS Solar Ibérica
Catálogo AS Solar Ibérica
 
Acumuladores AS Solar Ibérica
Acumuladores AS Solar IbéricaAcumuladores AS Solar Ibérica
Acumuladores AS Solar Ibérica
 
Válvulas Termostáticas vta323 hoja
Válvulas Termostáticas vta323 hojaVálvulas Termostáticas vta323 hoja
Válvulas Termostáticas vta323 hoja
 

Recently uploaded

18-04-UA_REPORT_MEDIALITERAСY_INDEX-DM_23-1-final-eng.pdf
18-04-UA_REPORT_MEDIALITERAСY_INDEX-DM_23-1-final-eng.pdf18-04-UA_REPORT_MEDIALITERAСY_INDEX-DM_23-1-final-eng.pdf
18-04-UA_REPORT_MEDIALITERAСY_INDEX-DM_23-1-final-eng.pdfssuser54595a
 
Kisan Call Centre - To harness potential of ICT in Agriculture by answer farm...
Kisan Call Centre - To harness potential of ICT in Agriculture by answer farm...Kisan Call Centre - To harness potential of ICT in Agriculture by answer farm...
Kisan Call Centre - To harness potential of ICT in Agriculture by answer farm...Krashi Coaching
 
Hybridoma Technology ( Production , Purification , and Application )
Hybridoma Technology  ( Production , Purification , and Application  ) Hybridoma Technology  ( Production , Purification , and Application  )
Hybridoma Technology ( Production , Purification , and Application ) Sakshi Ghasle
 
Presentation by Andreas Schleicher Tackling the School Absenteeism Crisis 30 ...
Presentation by Andreas Schleicher Tackling the School Absenteeism Crisis 30 ...Presentation by Andreas Schleicher Tackling the School Absenteeism Crisis 30 ...
Presentation by Andreas Schleicher Tackling the School Absenteeism Crisis 30 ...EduSkills OECD
 
The Most Excellent Way | 1 Corinthians 13
The Most Excellent Way | 1 Corinthians 13The Most Excellent Way | 1 Corinthians 13
The Most Excellent Way | 1 Corinthians 13Steve Thomason
 
Z Score,T Score, Percential Rank and Box Plot Graph
Z Score,T Score, Percential Rank and Box Plot GraphZ Score,T Score, Percential Rank and Box Plot Graph
Z Score,T Score, Percential Rank and Box Plot GraphThiyagu K
 
1029-Danh muc Sach Giao Khoa khoi 6.pdf
1029-Danh muc Sach Giao Khoa khoi  6.pdf1029-Danh muc Sach Giao Khoa khoi  6.pdf
1029-Danh muc Sach Giao Khoa khoi 6.pdfQucHHunhnh
 
Organic Name Reactions for the students and aspirants of Chemistry12th.pptx
Organic Name Reactions  for the students and aspirants of Chemistry12th.pptxOrganic Name Reactions  for the students and aspirants of Chemistry12th.pptx
Organic Name Reactions for the students and aspirants of Chemistry12th.pptxVS Mahajan Coaching Centre
 
Activity 01 - Artificial Culture (1).pdf
Activity 01 - Artificial Culture (1).pdfActivity 01 - Artificial Culture (1).pdf
Activity 01 - Artificial Culture (1).pdfciinovamais
 
POINT- BIOCHEMISTRY SEM 2 ENZYMES UNIT 5.pptx
POINT- BIOCHEMISTRY SEM 2 ENZYMES UNIT 5.pptxPOINT- BIOCHEMISTRY SEM 2 ENZYMES UNIT 5.pptx
POINT- BIOCHEMISTRY SEM 2 ENZYMES UNIT 5.pptxSayali Powar
 
Mastering the Unannounced Regulatory Inspection
Mastering the Unannounced Regulatory InspectionMastering the Unannounced Regulatory Inspection
Mastering the Unannounced Regulatory InspectionSafetyChain Software
 
How to Make a Pirate ship Primary Education.pptx
How to Make a Pirate ship Primary Education.pptxHow to Make a Pirate ship Primary Education.pptx
How to Make a Pirate ship Primary Education.pptxmanuelaromero2013
 
SOCIAL AND HISTORICAL CONTEXT - LFTVD.pptx
SOCIAL AND HISTORICAL CONTEXT - LFTVD.pptxSOCIAL AND HISTORICAL CONTEXT - LFTVD.pptx
SOCIAL AND HISTORICAL CONTEXT - LFTVD.pptxiammrhaywood
 
mini mental status format.docx
mini    mental       status     format.docxmini    mental       status     format.docx
mini mental status format.docxPoojaSen20
 
A Critique of the Proposed National Education Policy Reform
A Critique of the Proposed National Education Policy ReformA Critique of the Proposed National Education Policy Reform
A Critique of the Proposed National Education Policy ReformChameera Dedduwage
 
Grant Readiness 101 TechSoup and Remy Consulting
Grant Readiness 101 TechSoup and Remy ConsultingGrant Readiness 101 TechSoup and Remy Consulting
Grant Readiness 101 TechSoup and Remy ConsultingTechSoup
 
Software Engineering Methodologies (overview)
Software Engineering Methodologies (overview)Software Engineering Methodologies (overview)
Software Engineering Methodologies (overview)eniolaolutunde
 

Recently uploaded (20)

18-04-UA_REPORT_MEDIALITERAСY_INDEX-DM_23-1-final-eng.pdf
18-04-UA_REPORT_MEDIALITERAСY_INDEX-DM_23-1-final-eng.pdf18-04-UA_REPORT_MEDIALITERAСY_INDEX-DM_23-1-final-eng.pdf
18-04-UA_REPORT_MEDIALITERAСY_INDEX-DM_23-1-final-eng.pdf
 
Kisan Call Centre - To harness potential of ICT in Agriculture by answer farm...
Kisan Call Centre - To harness potential of ICT in Agriculture by answer farm...Kisan Call Centre - To harness potential of ICT in Agriculture by answer farm...
Kisan Call Centre - To harness potential of ICT in Agriculture by answer farm...
 
Hybridoma Technology ( Production , Purification , and Application )
Hybridoma Technology  ( Production , Purification , and Application  ) Hybridoma Technology  ( Production , Purification , and Application  )
Hybridoma Technology ( Production , Purification , and Application )
 
Presentation by Andreas Schleicher Tackling the School Absenteeism Crisis 30 ...
Presentation by Andreas Schleicher Tackling the School Absenteeism Crisis 30 ...Presentation by Andreas Schleicher Tackling the School Absenteeism Crisis 30 ...
Presentation by Andreas Schleicher Tackling the School Absenteeism Crisis 30 ...
 
The Most Excellent Way | 1 Corinthians 13
The Most Excellent Way | 1 Corinthians 13The Most Excellent Way | 1 Corinthians 13
The Most Excellent Way | 1 Corinthians 13
 
Z Score,T Score, Percential Rank and Box Plot Graph
Z Score,T Score, Percential Rank and Box Plot GraphZ Score,T Score, Percential Rank and Box Plot Graph
Z Score,T Score, Percential Rank and Box Plot Graph
 
1029-Danh muc Sach Giao Khoa khoi 6.pdf
1029-Danh muc Sach Giao Khoa khoi  6.pdf1029-Danh muc Sach Giao Khoa khoi  6.pdf
1029-Danh muc Sach Giao Khoa khoi 6.pdf
 
Organic Name Reactions for the students and aspirants of Chemistry12th.pptx
Organic Name Reactions  for the students and aspirants of Chemistry12th.pptxOrganic Name Reactions  for the students and aspirants of Chemistry12th.pptx
Organic Name Reactions for the students and aspirants of Chemistry12th.pptx
 
Activity 01 - Artificial Culture (1).pdf
Activity 01 - Artificial Culture (1).pdfActivity 01 - Artificial Culture (1).pdf
Activity 01 - Artificial Culture (1).pdf
 
POINT- BIOCHEMISTRY SEM 2 ENZYMES UNIT 5.pptx
POINT- BIOCHEMISTRY SEM 2 ENZYMES UNIT 5.pptxPOINT- BIOCHEMISTRY SEM 2 ENZYMES UNIT 5.pptx
POINT- BIOCHEMISTRY SEM 2 ENZYMES UNIT 5.pptx
 
Mastering the Unannounced Regulatory Inspection
Mastering the Unannounced Regulatory InspectionMastering the Unannounced Regulatory Inspection
Mastering the Unannounced Regulatory Inspection
 
How to Make a Pirate ship Primary Education.pptx
How to Make a Pirate ship Primary Education.pptxHow to Make a Pirate ship Primary Education.pptx
How to Make a Pirate ship Primary Education.pptx
 
INDIA QUIZ 2024 RLAC DELHI UNIVERSITY.pptx
INDIA QUIZ 2024 RLAC DELHI UNIVERSITY.pptxINDIA QUIZ 2024 RLAC DELHI UNIVERSITY.pptx
INDIA QUIZ 2024 RLAC DELHI UNIVERSITY.pptx
 
SOCIAL AND HISTORICAL CONTEXT - LFTVD.pptx
SOCIAL AND HISTORICAL CONTEXT - LFTVD.pptxSOCIAL AND HISTORICAL CONTEXT - LFTVD.pptx
SOCIAL AND HISTORICAL CONTEXT - LFTVD.pptx
 
mini mental status format.docx
mini    mental       status     format.docxmini    mental       status     format.docx
mini mental status format.docx
 
Código Creativo y Arte de Software | Unidad 1
Código Creativo y Arte de Software | Unidad 1Código Creativo y Arte de Software | Unidad 1
Código Creativo y Arte de Software | Unidad 1
 
A Critique of the Proposed National Education Policy Reform
A Critique of the Proposed National Education Policy ReformA Critique of the Proposed National Education Policy Reform
A Critique of the Proposed National Education Policy Reform
 
Mattingly "AI & Prompt Design: Structured Data, Assistants, & RAG"
Mattingly "AI & Prompt Design: Structured Data, Assistants, & RAG"Mattingly "AI & Prompt Design: Structured Data, Assistants, & RAG"
Mattingly "AI & Prompt Design: Structured Data, Assistants, & RAG"
 
Grant Readiness 101 TechSoup and Remy Consulting
Grant Readiness 101 TechSoup and Remy ConsultingGrant Readiness 101 TechSoup and Remy Consulting
Grant Readiness 101 TechSoup and Remy Consulting
 
Software Engineering Methodologies (overview)
Software Engineering Methodologies (overview)Software Engineering Methodologies (overview)
Software Engineering Methodologies (overview)
 

1 ESO - UNIT 11 - GRAPHS AND TABLES. PROBABILITY.

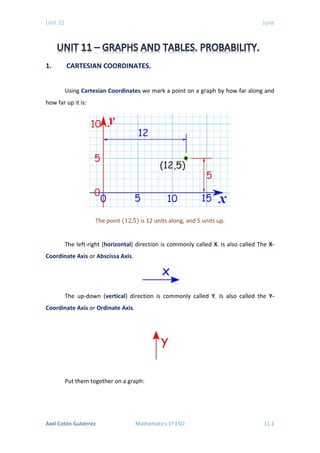
  • 1. Unit 11 June 1. CARTESIAN COORDINATES. Using Cartesian Coordinates we mark a point on a graph by how far along and how far up it is: The point (12,5) is 12 units along, and 5 units up. The left-right (horizontal) direction is commonly called X. Is also called The X- Coordinate Axis or Abscissa Axis. The up-down (vertical) direction is commonly called Y. Is also called the Y- Coordinate Axis or Ordinate Axis. Put them together on a graph: Axel Cotón Gutiérrez Mathematics 1º ESO 11.1
  • 2. Unit 11 June Where they cross over is the "(𝟎𝟎, 𝟎𝟎)" point, called Origin of Coordinates; you measure everything from there. It is like we put two Number Lines together, one going left-right, and the other going down-up. Axel Cotón Gutiérrez Mathematics 1º ESO 11.2
  • 3. Unit 11 June As 𝒙𝒙 increases, the point moves further right. When 𝒙𝒙 decreases, the point moves further to the left. As 𝒚𝒚 increases, the point moves further up. When 𝒚𝒚 decreases, the point moves further down. The coordinates are always written in a certain order: • the Horizontal distance first, • then the Vertical distance. This is called an "Ordered Pair" (a pair of numbers in a special order) And usually the numbers are separated by a comma, and parentheses are put around the whole thing like this: ( 𝟒𝟒, 𝟓𝟓) Just like with the Number Line, you can also have Negative Values. Negative: start at zero and head in the opposite direction: • Negative 𝒙𝒙 goes to the left. • Negative 𝒚𝒚 goes down. MATH VOCABULARY: Cartesian Coordinates, Graph, Axis, Origin of Coordinates, Abscissa, Ordinate, Ordered Pair. Axel Cotón Gutiérrez Mathematics 1º ESO 11.3
  • 4. Unit 11 June 2. GRAPHS. In everyday life, many quantities depend on one or more changing Variables. For example: • Plant growth depends on sunlight and rainfall. • Distance travelled depends on speed and time taken. • Test marks depend on attitude, listening in lectures and doing tutorials (among many other variables!!). Graphs can be used to quickly get an idea of how one quantity varies as another quantity changes. This graph shows Dan’s journey on his bike. We can see we use points to see where the graphs changes. Axel Cotón Gutiérrez Mathematics 1º ESO 11.4
  • 5. Unit 11 June A Function is a relation between two variables such that for every value of the first, there is only one corresponding value of the second. We say that the second variable is a function of the first variable. The first variable is the Independent Variable (usually 𝒙𝒙), and the second variable is the Dependent Variable (usually 𝒚𝒚). A good way of presenting a Function is by Graphical Representation. Graphs give us a visual picture of the function. Normally, the values of the Independent Variable (generally the 𝒙𝒙 − 𝒗𝒗𝒗𝒗𝒗𝒗 𝒗𝒗𝒗𝒗𝒗𝒗) are placed on the Horizontal Axis, while the values of the Dependent Variable (generally the 𝒚𝒚 − 𝒗𝒗𝒗𝒗𝒗𝒗 𝒗𝒗𝒗𝒗𝒗𝒗) are placed on the Vertical Axis. The following graph shows the present people (in thousands) in a shopping centre during a day. The function increases in the intervals (9, 12) and (14, 18). Axel Cotón Gutiérrez Mathematics 1º ESO 11.5
  • 6. Unit 11 June The function decreases in the intervals (12, 14) and (18, 24). The point (12, 3) is a local maximum and the point (14, 2) is a local minimum. At 09:00 the function has the global minimum and at 18:00 the function has the global maximum (5000 people). MATH VOCABULARY: Function, Independent Variable, Dependent Variable, Graphical Representation, Interval, Maximum, Minimum. 3. STATISTICS. Statistics is the science of making effective use of data relating to groups of individuals or experiments. It deals with all aspects of this, including not only the collection, organization, presentation, analysis and interpretation of data, but also the planning of the collection of them, in terms of the design of surveys and experiments. Imagine you have to make a study of the leisure activities in a city. The Population of this study will be the group of inhabitants of that city. A part of this group is called Sample. Therefore, the Population is the whole group of units that you are going to study and a Sample is a subset of the population. Each unit of the population is called Individual. The owner of a screw factory wants to make a quality control. He picks up 1 out of every 100 produced screws and then he analyses them. The population is the total number of the screws of the factory. The sample is 1% of the population. The individuals are each one of the screws. Statistical Variables are things that we measure, control or manipulate in research. They can be numbers, words, measurements, observations ... Statistical Variables can be Qualitative or Quantitative. Axel Cotón Gutiérrez Mathematics 1º ESO 11.6
  • 7. Unit 11 June • Qualitative Variable is descriptive information (describes something). Examples: eyes color, car brands, leisure activities … • Quantitative Variable is numerical information (numbers). Examples: height, age, number of televisions in each house … You can collect data using a Data-Collection Sheet. This one is a tally chart. Data can also be shown in a Frequency Table: The number of televisions in each house of my street is shown in the frequency table. The number of houses in my street are: Axel Cotón Gutiérrez Mathematics 1º ESO 11.7
  • 8. Unit 11 June 1 + 5 + 12 + 9 + 1 = 28 houses The number of TVs are: 0 + 5 + 24 + 27 + 4 = 60 TVs The Relative Frequency is a percentage of the Frequency: 𝑹𝑹𝑹𝑹 = 𝑭𝑭𝑭𝑭𝑭𝑭𝑭𝑭𝒖𝒖𝒆𝒆𝒆𝒆𝒆𝒆𝒆𝒆 𝑻𝑻𝑻𝑻𝑻𝑻𝑻𝑻𝑻𝑻 𝑵𝑵𝑵𝑵𝑵𝑵𝑵𝑵𝑵𝑵𝑵𝑵 𝒐𝒐𝒐𝒐 𝑰𝑰𝑰𝑰𝑰𝑰𝑰𝑰𝑰𝑰𝑰𝑰 𝑰𝑰𝑰𝑰𝑰𝑰𝑰𝑰𝑰𝑰 MATH VOCABULARY: Statistics, Population, Sample, Individual, Statistical Variables, Qualitative, Quantitative, Data-Collection Sheet, Frequency Table, Relative Frequency. 4. STATISTICS GRAPHS. You can use a variety of Diagrams and Charts to display data. A Bar Graph (also called Bar Chart) is a graphical display of data using bars of different heights. Axel Cotón Gutiérrez Mathematics 1º ESO 11.8
  • 9. Unit 11 June It is a really good way to show Relative Sizes: we can see which types of movie are most liked, and which are least liked, at a glance. We can use bar graphs to show the relative sizes of many things, such as what type of car people have, how many customers a shop has on different days and so on. A Histogram is a graphical display of data using bars of different heights. It is similar to a Bar Chart, but a histogram groups numbers into Ranges. Pie Chart: a special chart that uses "pie slices" to show relative sizes of data. Axel Cotón Gutiérrez Mathematics 1º ESO 11.9
  • 10. Unit 11 June It is a really good way to show Relative Sizes: it is easy to see which movie types are most liked, and which are least liked, at a glance. To calculate each sector we use the Relative Frequency to find the angle of the sector. We can use a Frequency Polygon to display grouped continuous data: MATH VOCABULARY: Chart, Bar Graph, Histogram, Ranges, Pie Chart, Frequency Polygon. Axel Cotón Gutiérrez Mathematics 1º ESO 11.10
  • 11. Unit 11 June 5. MEASURES OF CENTRAL TENDENCY. Measures of Central Tendency –Mean, Mode, and Median- can help you capture, with a single number, what is typical or representative of the data. • The Mean of a set of data is the total of all the values divided by the number of values, that is, the average value of all the data in the set. The mean is denoted by 𝒙𝒙�. • The Mode is the value that occurs most often. (The mode is sometimes called the modal value). • The Median is the middle value when the data is arranged in order, that is, the value that has exactly half the data above it and half bellow it. Calculate the mean, mode and median of 8, 3, 8, 7, 5 𝑀𝑀𝑒𝑒𝑒𝑒𝑒𝑒 = 𝒙𝒙� = 8 + 3 + 8 + 7 + 5 5 = 31 5 = 6.2 𝑀𝑀𝑜𝑜𝑜𝑜𝑜𝑜 = 8, 𝑎𝑎𝑎𝑎 8 𝑜𝑜𝑜𝑜𝑜𝑜𝑜𝑜𝑜𝑜𝑜𝑜 𝑚𝑚𝑚𝑚𝑚𝑚𝑚𝑚 𝑜𝑜𝑜𝑜𝑜𝑜𝑜𝑜𝑜𝑜 For the median, first arrange the numbers in numerical order 3 5 7 8 8 The one in the Middle is 7 → 𝑀𝑀𝑀𝑀𝑀𝑀𝑀𝑀𝑀𝑀𝑀𝑀 = 7 MATH VOCABULARY: Measures of Central Tendency, Mean, Mode, Median. Axel Cotón Gutiérrez Mathematics 1º ESO 11.11
  • 12. Unit 11 June 6. PROBABILITY. Random experiments are those that can’t be predicted with total certainty. Tossing a coin, rolling a dice, choosing a card from a deck, choosing a marble from a bag, … The set of all possible Outcomes (results) of a random experiment is called the Sample Space (𝑺𝑺). The basic outcomes of an experiment are also known as Elementary Events. An Event is a set of outcomes, that is, a subset of the Sample Space. Sample Space: 𝑆𝑆 = {1, 2, 3, 4, 5, 6} {1}, {2}, {3}, {4}, {5} and {6} are elementary events 𝐴𝐴 = {5, 6} is an event that has two elementary events. • Sure Event: event that always occurs, whatever the result of the experiment is. The sample space 𝑺𝑺 is a sure event. • Impossible Event: event that never occurs, whatever the result of the experiment is. The empty set ∅ is an impossible event. We can calculate the Theoretical Probability when an event is fair or unbiased. Theoretical probability is based on Equally Likely Outcomes Axel Cotón Gutiérrez Mathematics 1º ESO 11.12
  • 13. Unit 11 June 𝑃𝑃[𝑅𝑅𝑅𝑅𝑑𝑑 𝑏𝑏𝑎𝑎𝑙𝑙𝑙𝑙 𝑖𝑖𝑛𝑛 𝐴𝐴 𝑏𝑏𝑜𝑜𝑜𝑜] = 4 7 = 0.57 𝑃𝑃[𝐺𝐺𝑟𝑟𝑟𝑟𝑟𝑟𝑟𝑟 𝑏𝑏𝑎𝑎𝑙𝑙𝑙𝑙 𝑖𝑖𝑛𝑛 𝐵𝐵 𝑏𝑏𝑜𝑜𝑜𝑜] = 4 7 = 0.57 MATH VOCABULARY: Random Experiments, Sample Space, Elementary Events, Sure Event, Impossible Event, Theoretical Probability. Axel Cotón Gutiérrez Mathematics 1º ESO 11.13