
Recommended
Recommended
More Related Content
Similar to Female surpass male in bachelor's degree earning in the U.S.A
Similar to Female surpass male in bachelor's degree earning in the U.S.A (9)
More from gilbertoPena2
More from gilbertoPena2 (14)
Recently uploaded
Recently uploaded (20)
Female surpass male in bachelor's degree earning in the U.S.A
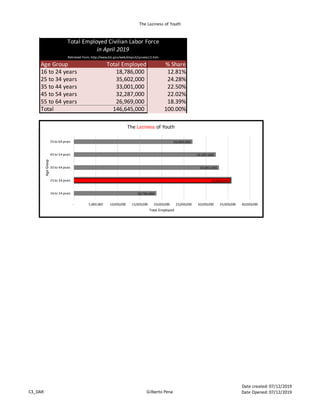
- 1. The Laziness of Youth C3_DAR Gilberto Pena Date created: 07/12/2019 Date Opened: 07/12/2019 Age Group Total Employed % Share 16 to 24 years 18,786,000 12.81% 25 to 34 years 35,602,000 24.28% 35 to 44 years 33,001,000 22.50% 45 to 54 years 32,287,000 22.02% 55 to 64 years 26,969,000 18.39% Total 146,645,000 100.00% Total Employed Civilian Labor Force in April 2019 Retrieved from: http://www.bls.gov/web/empsit/cpseea13.htm 18,786,000 35,602,000 33,001,000 32,287,000 26,969,000 - 5,000,000 10,000,000 15,000,000 20,000,000 25,000,000 30,000,000 35,000,000 40,000,000 16 to 24 years 25 to 34 years 35 to 44 years 45 to 54 years 55 to 64 years Total Employed AgeGroup The Laziness of Youth
- 2. 25-34 year olds at almost 25% C3_DAR Gilberto Pena Date created: 07/12/2019 Date Opened: 07/12/2019 Age Group Total Employed % Share 16 to 24 years 18,786,000 12.81% 25 to 34 years 35,602,000 24.28% 35 to 44 years 33,001,000 22.50% 45 to 54 years 32,287,000 22.02% 55 to 64 years 26,969,000 18.39% Total 146,645,000 Total Employed Civilian Labor Force in April 2019 Retrieved from: http://www.bls.gov/web/empsit/cpseea13.htm 16 to 24 years, 18,786,000 25 to 34 years, 35,602,000 35 to 44 years, 33,001,000 45 to 54 years, 32,287,000 55 to 64 years, 26,969,000 25-34 year olds at almost 25% 16 to 24 years 25 to 34 years 35 to 44 years 45 to 54 years 55 to 64 years
- 3. 3DS UP C3_DAR Gilberto Pena Date created: 07/12/2019 Date opened: 07/12/2019 Platform Global Unit Sales Switch 182,128m PS4 177,041m XOne 49,417m 3DS 25,097m Global Unit Sales by Platform week of 5/11/19 Reference: http://www.vgchartz.com/ 182,128m 177,041m 49,417m 25,097m m 20,000m 40,000m 60,000m 80,000m 100,000m 120,000m 140,000m 160,000m 180,000m 200,000m Switch PS4 XOne 3DS 3DS UP
- 4. Streaming subscription takeoff in 2016 C3_DAR Gilberto Pena Date created: 07/12/2019 Date opened: 07/12/2019 Year* 2015 2016 2017 2018 Subscriptions 9.10 20.30 31.50 46.40 Number of U.S. Paid Subscriptions in millions (Streaming) Reference:http://www.riaa.com/wp-content/uploads/2018/09/RIAA-Mid-Year-2018-Revenue-Report-News- Notes.pdf *Figures represent the first half of each year - 5.00 10.00 15.00 20.00 25.00 30.00 35.00 40.00 45.00 50.00 2015 2016 2017 2018 StreamingSubscription Year Streaming subscription takeoff in 2016
- 5. Extream decrease sales of songs in the U.S.A C3_DAR Gilberto Pena Date created: 07/12/2019 Date opened: 07/12/2019 Subscription & streaming Album downloads Single downloads 2013 $1,450 $1,232 $1,568 2014 $1,868 $1,151 $1,408 2015 $2,407 $1,091 $1,195 2016 $3,962 $819 $873 2017 $5,665 $624 $651 Digital music Revenues by type in the United States (in millions U.S. dollars) Reference: http://www.statista.com/statistics/186710/digital-music-revenue-in- the-us-since-2008/ $0 $1,000 $2,000 $3,000 $4,000 $5,000 $6,000 2013 2014 2015 2016 2017 DigitalRevenueintheU.S Year Extreamdecrease sales of songs in the U.S.A Subscription& streaming Album downloads Single downloads
- 6. Bachelor’s degree earning C3_DAR Gilberto Pena Date created: 07/12/2019 Date Opened: 07/12/2019 Male Female Total 1950 328,840 103,220 432,060 1960 254,060 138,380 392,440 1970 451,100 341,220 792,320 1980 473,610 455,810 929,420 1990 491,700 559,650 1,051,350 2000 530,370 707,510 1,237,880 Number of bachelor's degrees earned in U.S by gender Reference: http://www.statista.com/statistics/185157/number-of-bachelor-degrees-by-gender-since-1950/ *2020 is an estimate Which parts of table will you be using? How can you manipulate the data to communicate your message? (Think about sorting or deleting unecessary content before making your chart. You don't want to include Grand Totals with individual data - choose one or the other) 328,840 254,060 451,100 473,610 491,700 530,370 103,220 138,380 341,220 455,810 559,650 707,510 - 100,000 200,000 300,000 400,000 500,000 600,000 700,000 800,000 1950 1960 1970 1980 1990 2000 Degreesearned by Gender Year Female surpass male in bachelor's degree earning in the U.S.A Male Female