Ghuma $ Russian Call Girls Ahmedabad ₹7.5k Pick Up & Drop With Cash Payment 8...
Condicion corporal vaca
1. A Dairy Cow Body Condition Scoring System and
Its Relationship to Selected Production Characteristics
E. E. WILDMAN, I G. M. JONES, P. E. WAGNER, 2
and R. L. BOMAN 3
Department of Dairy Science
H. F. TROUTT, JR., and T. N. LESCH
College of Veterinary Medicine
Virginia Polytechnic Institute and State University
Blacksbu rg 24061
ABSTRACT
A scoring system with 1 to 5 scale
was devised to measure body condition
of dairy cows at any point during the
lactation cycle. Cows were scored on
appearance and palpation of back and
hind quarters only. Relationships of body
weight, frame size measurements, milk
production, and characteristics related to
the body condition scoring system were
determined. During 18 too, 28 cows in
each of 29 dairy herds were used for
body measurements and body condition
scores. Data were obtained from each
herd at 3-mo intervals. Body weight and
frame size measurements could not be
correlated with body condition score.
Dairy cows of greatest efficiency of milk
production showed no significant increase
in body condition during lactation, had
fewer days open, but had lower per-
sistency of lactation. Dairy cows that in-
creased significantly in body condition
during lactation were less efficient pro-
ducers, had a greater number of days
open, and had high body condition
scores at the end of lactation. The body
condition scoring system is a means of
accurately determining body condition
of dairy cows, independent of body
weight and frame size.
Received June 1, 1981.
1Department of Animal Sciences, University of
Vermont, Burlington 05405.
2Franklin County Extension Service, Chambers-
burg, PA 17201.
3Southern Piedmont Research and Continuing
Education Center, Blackstone, VA 23824.
INTRODUCTION
The continuing increase in milk production
per cow can be attributed to improvements in
genetics, health, reproduction, and nutrition.
Greater production is accompanied by in-
creased stress and under certain conditions
(e.g., fat cow syndrome) is accompanied by
increased metabolic disorders and infectious
diseases at parturition (10, 13). Body condi-
tion, or cow fitness pertaining to degree of
body fat, at parturition influences the occur-
rence of metabolic disorders (10). The ideal
body condition for pregnant, nonlactating
dairy cows that allows cows to attain maximal
milk production and minimal metabolic dis-
orders during the subsequent lactation has not
been defined.
The increased incidence of metabolic
diseases in high producing dairy cows indicates
a need for concern with each stage of the lacta-
tion cycle and effects on subsequent lactation
cycles. Body condition of the dairy cow must
be optimal during each stage of the lactation
cycle for maximal return. Ration formulation
systems are designed to feed each cow to pro-
duce to her capability with minimal metabolic
disorders and, therefore, theoretically to maxi-
mize profit. Recommendations for satisfying
the nutritional requirements of dairy cows are
based on maintenance needs of a cow at a given
weight and with additional needs for milk pro-
duction, gestation, or both (11). No considera-
tion is given to body condition, especially in
relation to frame size. A dairy cow may need
to gain or lose weight, particularly during the
last third of lactation, to be in proper condi-
tion for parturition and subsequent lactation.
High energy intake during the dry period can
cause excessive weight gain, and high protein
intake increases the incidence of "alert
1982 J Dairy Sci 65:495-501 495
2. 496 WlLDMAN ET AL.
downer" cow syndrome, an apparent myo-
paralytic disease of the parturient dairy cow
(4).
On a practical basis, neither dairy farmers
nor advisors agree on what constitutes desired
body condition for a dairy cow. Dairy scientists
have not developed the necessary objective re-
search to advise dairy farmers properly on the
optimal body condition of dairy cows. It would
be beneficial to have a practical means of
determining optimal body condition for dairy
cows during any given stage of the production
cycle, especially the last third of lactation and
the dry period, in preparation for parturition
and subsequent lactation (3).
EXPERIMENTAL PROCEDURE
Thirty Virginia dairy herds, enrolled in Dairy
Herd Improvement Association (DHIA), were
selected so that 10 herds had DHI rolling herd
averages of less than 6350 kg milk, 10 herds
averaged between 6350 and 7258 kg, and 10
herds exceeded 7258 kg. One of the low pro-
ducing herds discontinued DHIA and was
dropped from the study.
Herds were visited every 3 mo, with 10 herd
visits per mo. Twenty-eight cows were selected
from each herd for individual measurements
including taped body weights, body condition,
number of palpatable intercostal spaces, and
wither, sternum, and hook heights. Five cows
were selected from various production groups
by DHI Estimated Relative Producing Ability
(ERPA)a: 1) ERPA over 680 kg, 2) ERPA
between 227 and 680 kg, 3) ERPA between +
227 kg, and 4) ERPA less than -227. Eight
first-calf heifers were selected at random.
Culled cows were replaced with cows from the
same ERPA group as the cows which were
culled.
A body condition scoring system was de-
vised to assess the body condition of a dairy
cow at any point during the production cycle.
An effort was made not to be influenced by
frame size, milk production, health, or any fac-
tor other than those described for each body
4ERPA is the deviation between a cow's average
305 day, ME milk and the average for all herdmate
records, adjusted by the number of lactations for the
specific cow in question.
condition score. Cows were scored on appear-
ance and palpation of back and hind quarters
only. Factors considered were the thoracic and
lumbar regions of the vertebral column (chine,
loin, and rump), spinous processes (loin),
anterior coccygeal vertebrae (tailhead), tuber
sacrale (hooks), and tuber ischii (pin bones).
A single factor may be misleading; however, all
factors considered together provide an accurate
score. On a scale of 1 through 5, condition
score 1 indicates severe undercondition and
5 indicates severe overcondition. Each condi-
tion score was assessed as follows:
1) Individual spinous processes had limited
flesh covering, were prominent, the ends were
sharp to the touch, and together the processes
formed a definite overhanging shelf effect to
the loin region. Individual vertebrae of the
chine, loin, and rump regions were prominent
and distinct, hooks and pin bones were sharp
with negligible flesh covering, and severe
depressions between hooks and pin bones were
noted. The area below the tailhead and be-
tween the pin bones was severely depressed
causing the bone structure of the area to appear
extremely sharp. This condition score is not
shown as only 4 of 1793 observations were
scored 1.
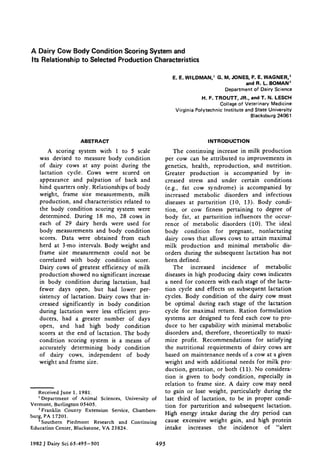
2) Individual spinous processes were visually
discernible but were not prominent (Figure 1).
Ends of processes were sharp to the touch
although they had greater flesh covering, and
the processes did not have a distinct overhang-
ing shelf effect. Individual vertebrae of chine,
loin, and rump regions were not visually dis-
Figure 1. Side view of a cow scored condition 2.
Individual spinous processes comprise the short bones
that make up any shelf effect along the loin.
Journal of Dairy Science Wol.65, No. 3, 1982
3. OUR INDUSTRY TODAY 497
i Q •
Figure 2. Rear view of the cow in Figure 1 scored
condition 2.
tinct but were readily distinguishable by palpa-
tion. Hooks and pin bones were prominent,
but the depression between them was less
severe. The area below the tailhead and be-
tween the pin bones was depressed, but the
bone structure was not devoid of flesh covering
(Figure 2).
3) Spinous processes were discernible by
applying slight pressure. Together processes
appeared smooth and the overhanging shelf
effect was not noticeable. Vertebrae of the
chine, loin, and rump regions appeared as a
rounded ridge, and hooks and pin bones were
rounded and smooth. The area between the pin
bones and around the tailhead appeared smooth
without sign of fat deposition (Figure 3).
4) Individual spinous processes could be
distinguished only by firm palpation and,
together, the processes appeared fiat or
rounded with no overhanging shelf effect. The
ridge formed by the vertebral column of the
chine region was rounded and smooth, but loin
and rump regions appeared flat. Hooks were
rounded, and the span between the hooks was
flat. Area around tailhead and pin bones was
rounded, with evidence of subcutaneous fat
deposition (Figure 4).
5) Bone structure of the vertebral column,
spinous processes, hooks, and pin bone regions
was not visually apparent, and evidence of sub-
cutaneous fat deposition was prominent. The
tail head appeared to be buried in fatty tissue
(Figures 5 and 6).
Complete DHIA records for each cow were
obtained for use in analyzing the effectiveness
of the body con~lition scoring system. For
statistical purposes, DHIA measures were
divided into groups as described in Table 1.
Dairy merit (P. T. Chandler, personal communi-
cation) is determined by the equation: Test day
daily 4% fat corrected milk (FCM)/metabolic
size (Wkg-TS). Dairy merit is based on the
proposition that partial efficiency of milk pro-
duction is independent of body size. Feed
capacity is proportional to metabolic size, and
production capacity is proportional to meta-
bolic size (5). Dairy merit is used in this study
as a measure of milk production efficiency or
production per unit of metabolic size.
Multiple regression analysis (2) was used to
evaluate the relationship between the body
condition scoring system, body measurements,
and DHIA measures. Significant effects were
Figure 3. Body condition score 3.
Figure 4. Body condition score 4, the desired con-
dition for drying-off cows.
Journal of Dairy Science Vol. 65, No. 3, 1982
4. 498 WILDMANET AL.
Figure 5. Side view of a cow scored 5.
tested by least squares analysis of variance pro-
cedure (1). Correlation coefficients were be-
tween all dependent and independent variables.
Adjusted means (1) were tested for signifi-
cance of all possible comparisons by the
Scheffe procedure (12).
RESULTS AND DISCUSSION
Correlation coefficients (Table 2) indicated
that as body condition increased, weight and
ratio of body weight to wither height increased
and number of palpable intercostal spaces de-
creased (P<.01). Correlation coefficients be-
tween condition score and wither, sternum, and
hook heights each approached zero. Measures
associated with weight gain increased with in-
creasing body condition as expected; however,
frame size (height at withers, sternum, or
hooks) was not associated with body condi-
tion. A cow of large frame size did not receive
a high condition score because of her frame
size.
Klosterman (6) reported that weight alone
was not a good measure of cow size because of
the effect of body condition. The body condi-
tion scoring system takes into account a factor
other than weight or frame size and suggests
that the system is an indicator of degree of fit-
ness of dairy cows.
Mean body condition scores were different
(P<.05) between each stage of lactation except
there were no differences between stages 4-and
5 which represent cows in milk greater than
239 days and dry cows (Table 1). Body condi-
tion decreased sharply during early lactation,
~ ~::i:
Figure 6. Rear view of a cow scored 5.
increased from approximately peak of lactation
through the end of lactation, and was constant
during the dry period. Present dry cow feeding
practices usually consider gestation and weight
only, and, therefore, body condition at the end
of lactation would be expected to remain con-
stant through the dry period. The change in
body condition throughout the lactation cycle
responded as expected and showed that the
body condition scoring system, as defined in
this study, accurately differentiated fitness of
cows in various stages of lactation.
All mean body condition scores were differ-
ent (P<.05) at each group of dairy merit (Table
1). Efficient producing cows maintained a mean
score of 2.5 for the lactation cycle whereas in-
efficient producers maintained an average score
of 3.3. Either low producing cows did not have
the ability to efficiently utilize body fat for
milk production or they were inefficient milk
producers and consequendy, deposited body
fat with greater efficiency. Cows producing at
average efficiency were intermediate in body
condition (2.8).
Average body condition scores were all
different (P<.05) for each measure of persis-
tency of lactation (Table 1). Cows of greater
persistency of lactation had a mean body condi-
Journal of Dairy Science Vol. 65, No. 3, 1982
5. OUR INDUSTRY TODAY 499
TABLE 1. Means of body condition scores for groups of selected DHIA milk production and related measures.
Item Groups N
Body
condition
score
Stage of lactation a (days)
Dairy merita (4% FCM/Wkg'TS)
Persistency of lactationa,g (%)
Days opena
Age at calvingb (months)
Seasonb (months)
1) Less than 80 570 2.516 c
2) 80-159 595 2.708 d
3) 160-239 649 2.959 e
4) Greater than 239 797 3.390 f
5) Dry period 462 3.375 f
1) Less than .16 1577 3.306 c
2) .16-.22 876 2.815 d
3) Greater than .22 620 2.496 e
1) Less than 90 650 2.677 c
2) 90-110 1698 3.010 d
3) Greater than 110 725 3.278 e
1) Less than 60 628 2.656 c
2) 60-100 1041 2.917 d
3) Greater than 100 1404 3.221 e
1) Less than 30 226 3.066 c
2) 30-60 1731 3.032 c
3) Greater than 60 1116 3.045 c
1) December--March 917 3.056 c
2) April-July 1129 3.077 c
3) August--November 1027 2.984 d
aMeans were adjusted for herd, age at calving, and season effects.
bMeans were adjusted for herd effects.
c'd'e'fMeans within an item with different letters differed (P<.05).
gPersistency of lactation index is based upon a cow's projected 305 day, ME milk production. A new projec-
tion is calculated after each test. The index is computed by comparing the new projection to a base projection
made on the test day after 80 days in milk.
TABLE 2. Correlation coefficients for body condition scores, body weight, number of apparent intercostal
spaces, frame size measurements, and ratio of weight to wither height.
Inter-
Wither Sternum Hook costal
Condition Weight height height height spaces
Weight .44" *
Wither height .04 .62" *
Sternum height -. 15 ** .18" * .49" *
Hook height .08* .61"* .86** .41"*
Intercostal spaces --.49 ** --.29" * --.09 ** .24 **
Ratio a .51"* .96** .39** .04**
--.12"*
.42** --.28**
aRatio = weight/wither height.
*(/'<.05).
**(P<.01).
Journal of Dairy Science Vol. 65, No. 3, 1982
6. 500 WILDMANET AL.
TABLE 3. Meansof body conditionscore by stage of lactation and dairy merit,a
Efficiency of milk production (4% FCM/Wkg'Ts)
Stage of lactation .22 .16-.22 .16
Lessthan 80 days 2.47Ab 2.60Ab 2.57Ab
(342) (131) (97)
80-159 days 2.47Ab 2.75Bbc 2.95Cc
(185) (284) (126)
160-239 days 2.62Ab 2.81Bc 3.19Cd
(78) (282) (289)
Greater than 239 days 2.72Ab 3.08Ad 3.50Be
(15) (179) (603)
aMeanswere adjusted for herd, age at calving,and season effects.
A'B'CMeanswithin a stage of lactation (rows) with different letters differed (P<.05).
b'c'd'eMeans within dairy merit (columns) with different letters differed (P<.05).
( )Number of observations in a mean.
tion score of 3.3; low persistency cows had a
mean score of 2.7. Average persistency cows
were intermediate with a mean score of 3.0.
Hence, as mean body condition score increased,
results for dairy merit and persistency of lac-
tatiOn are difficult to explain. It is possible that
since persistency of lactation is based on each
month's projected 305-day mature equivalent
4% fat-corrected milk, the interaction was con-
founded and insignificant (P<.05). Since DHIA
uses a single average lactation curve as a basis
on which to compare persistency of each cow,
an efficient producing cow may have an "ab-
normal" lactation curve as compared with the
standard curve, but such a curve may be de-
sirable. The greater slopes, ascending and
descending, project low persistency of lacta-
tion, but overall production for the lactation
could be greater than that of the average pro-
ducing cow. If this is the case, then cows with
lower body condition could have been more
efficient producers and yet less persistent.
Average body condition scores at different
days open were different (P<.05; Table 1).
Body condition score increased as days open
increased. The fetus has a negligible effect on
energy requirements of the dam until after 200
days (11). Thus, a cow being open or pregnant
should have no effect on body condition. There
are numerous factors affecting days open, one
of which may be that she is overconditioned.
Body condition score was not affected by
age at calving (P>.05). For season, only August
through November was different (P<.05) from
other seasons. Although different statistically,
mean body condition scores for each season
were not different practically.
The effect of dairy merit, within stage of lac-
tation, upon body condition is in Table 3. All
cows tended toward a common body condition
during the first 80 days of lactation. The more
efficient, higher producing cows did not change
in body condition throughout lactation
(P>.05). However, inefficient producers in-
creased in body condition (P<.05) and ap-
parently were more efficient in converting
energy to body fat than to milk.
Means of dairy merit for each body condi-
tion score are in Table 4. Means for dairy merit
were different (P<.05) except between the two
undercondition scores. As body condition
scores increased, dairy merit decreased by more
than 50%. The overconditioned dairy cow is
inefficient for milk production whether be-
cause of stage of lactation or solely condition-
ing.
In beef cattle condition scoring can be
accurate and effective as a management tool to
improve productive and reproductive perform-
ance (7). Dairy cows gain weight more effi-
Journal of Dairy Science Vol.65, No. 3, 1982
7. OUR INDUSTRY TODAY 501
TABLE 4, Means of dairy merit for each body condi-
tion score,a
Dairy
Body merit
condition (4% FCM/
score N Wkg"Ts)
1 4 .26b
2 260 .22b
3 1094 .18c
4 397 .14d
5 38 .11e
aMeans were adjusted for herd, age at calving, and
season effects.
b'c'd'eMeans within different letters differ
(P<.05).
ciently during late lactation than during the dry
period (3, 8, 9). Our study showed that at
drying off a greater percentage of the cows
were overconditioned than were undercondi-
tioned. An effective and practical use for the
body condition scoring system may be to con-
trol excess lipogenesis in late lactation to pre-
vent fat cow syndrome after start of the sub-
sequent lactation (8, 13). Further, use of the
body condition scoring system to measure the
effect of overconditioning over a number of lac-
tations would provide greater insight into the
relationship between health disorders and body
condition. It is suggested that body condition
scores should be measured for cows included in
certain research studies, e.g., grouping cows,
feed, feeding systems comparisons, etc. Differ-
ences in body condition may influence conclu-
sions draw. The body condition scoring system
is an accurate and practical means of determin-
ing the degree of fitness in dairy cows, indepen-
dent of cow frame size.
ACKNOWLEDGMENTS
The authors are grateful for the technical
assistance of Gregory Clabaugh, the Forage
Testing Laboratory, and the Southern Dairy
Records Processing Center. Deep appreciation
is expressed for the cooperation of the 29
Virginia dairy farms. Financial support was
provided by the Extension Service, United
States Department of Agriculture, and the Set-
aside Program of the Virginia State Dairymen's
Association.
REFERENCES
1 Barr, A. J., J. H. Goodnight, J. P. Sail, and J. T.
Helwig. 1972. A user's guide to SAS 72, SAS
Inst., Inc., Raleigh, NC.
2 Barr, A. J., J. H. Goodnight, J. P. Sail, and J. T.
Helwig. 1976. A user's guide to SAS 76, SAS
Inst., Inc., Raleigh, NC.
3 Belyea, R. L., C. E. Coppock, W. G. Merrill, and
S. T. Slack. 1975. Effects of silage based diets on
feed intake, milk production, and body weight of
dairy cows. J. Dairy Sci. 58:1328.
4 Julien, W. E., H. R. Conrad, and D. R. Redman.
1977. Influence of dietary protein on susceptibility
to alert downer syndrome. J. Dairy Sci. 60:210.
5 Kleiber, M. 1961. Pages 321-322 in The fire of
life; an introduction to animal energetics. John
Wiley and Sons, Inc., New York, London.
6 Klosterman, E. W. 1972. Beef cattle size for maxi-
mum efficiency. J. Anim. Sci. 34:875.
7 Lowman, B. G., N. A. Scott, and S. H. Sommer-
ville. 1976. Condition scoring of cattle. East
Scotland Coll. Agric., Bull. No. 6.
8 Moe, P. W., W. P. Flatt, and H. F. Tyrrell. 1972.
Net energy value of feeds for lactation. J. Dairy
Sci. 55:945.
9 Moe, P. W., J. T. Reid, and H. F. Tyrrell. 1965.
Effect of level of intake on digestibility of dietary
energy by high-producing cows. J. Dairy Sci. 48:
1053.
10 Morrow, D. A. 1976. Fat cow syndrome. J. Dairy
Sci. 59:1625.
11 National Research Council. 1978. Nutrient require-
ments of dairy cattle. Nat. Acad. Sci., Washing-
ton, DC.
12 Snedecor, G. W., and W. G. Cochran. 1967. Statis-
tical methods. 6th ed.
13 Troutt, H. F. 1974. Pathology associated with
rations. Proc. Am. Assoc. Bovine Practitioners
6:68.
Journal of Dairy Science Vol. 65, No. 3, 1982