
Recommended
More Related Content
What's hot
What's hot (20)
Viewers also liked
Viewers also liked (14)
Similar to MS Math Night, fall 2014
Similar to MS Math Night, fall 2014 (20)
Recently uploaded
Recently uploaded (20)
MS Math Night, fall 2014
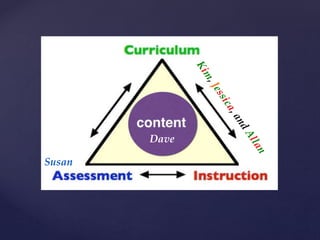
- 1. Dave Susan
- 2. { WHAT { content standards competencies proficiencies HOW curriculum program unit plans lesson plans content vs. curriculum
- 3. NCTM standards broad learning goals for levels CCSS specific learning goals sequenced by grade level CMP grade-level content by unit/ lesson Math Content
- 4. NCTM: Algebra Standard for Grades 6 - 8 CCSS – 8th Grade Standards, Expressions and Equations, Functions CMP – 8th Grade Algebra, Unit 3 Solving Equations Mathematical and Problem- Solving Goals Develop an initial conceptual understanding of different uses of variables Solve linear equations in one variable Develop a strategy for distributing a negative sign over a sum or difference in a linear expression Explore relationships between symbolic expressions and graphs and lines, paying particular attention to the meaning of intercept and slope Solve linear equations with rational number coefficients, including equations whose solutions require expanding expressions using the distributive property and collecting like terms Develop a strategy for solving linear equations with parentheses Use symbolic algebra to represent situations and to solve problems, especially those that involve linear relationships Understand that a function is a rule that assigns to each input exactly one output. The graph of a function is the set of ordered pairs consisting of an input and the corresponding output. Continue to develop understanding and some fluency with factoring quadratic expressions Recognize and generate equivalent forms for simple algebraic expressions and solve linear equations Connect the x-intercepts of a quadratic function to solving a quadratic equation 0 = ax^2 + bx + c Solve equations by factoring Use solutions of equations to make predictions and decisions Interpret information provided by equivalent expressions in context
- 5. MS math and ERB { MS math and assessment at Canterbury School
- 6. { Comprehensive Testing Program = CTP4 produced by the Educational Records Bureau “the ERB’s” students in grades 3 - 8
- 7. { aptitude { achievement Quantitative Analysis Mathematics 1 & 2 2 kinds of information provided by the ERB’s
- 8. test items from subsequent grade from current grade from previous grade content on Mathematics 1 and 2
- 9. { mastery of all expected target goals 66%
- 10. { normal score distribution over a bell curve “norm group”
- 11. 0 20 40 60 80 100 independent schools norm Canterbury School 2014 National Percentile Rank grade 5 Mathematics 1 & 2
- 12. 100 80 60 40 20 0 A B C Canterbury School independent schools NORM Mathematics 1 & 2 mean percentile of correct answers - 2014 Grade 5 select sub-test categories A number systems/ number theory B geometry/ spatial sense C statistics
- 13. 0 20 40 60 80 100 independent schools norm Canterbury School 2014 National Percentile Rank grade 6 Mathematics 1 & 2
- 14. 100 80 60 40 20 0 A B C Canterbury School independent schools NORM Mathematics 1 & 2 mean percentile of correct answers - 2014 grade 6 select sub-test categories A number systems/ number theory B geometry/ spatial sense C statistics
- 15. 0 20 40 60 80 100 independent schools NORM Canterbury School 2014 National Percentile Rank grade 7 Mathematics 1 & 2
- 16. 100 80 60 40 20 0 A B C Canterbury School independent schools NORM Mathematics 1 & 2 mean percentile of correct answers - 2014 grade 7 select sub-test categories A number systems/ number theory B geometry/ spatial sense C statistics
- 17. 0 20 40 60 80 100 independent schools NORM Canterbury School, sp13 2014 National Percentile Rank grade 8 Mathematics 1 & 2
- 18. 100 80 60 40 20 0 A B C Canterbury School independent schools NORM Mathematics 1 & 2 mean percentile of correct answers - 2014 grade 8 select sub-test categories A number systems/ number theory B geometry/ spatial sense C statistics
- 19. { strong content + outstanding curriculum + phenomenal teachers __________________________ well-prepared math students Canterbury School MS Math
Editor's Notes
- Spend a moment discussing where the standards of content come from, How the content of CMP reflects those content standards, and then how the rigorous content delivered in the best way, by expert teachers results in very strong, well prepared math students as evidenced by our ERB scores (Susan)
- How CMP content was decided – discuss the process by which the three relate… NCTM – National Council of Teachers of Mathematics CCSS – Common Core State Standards CMP – Connected Math Program
- Participated in a lesson with materials and content from CMP and delivered by an exceptionally passionate and truly skilled educator Dave reviewed the idea that foundational math content exists independently of any program used to deliver it, and explored the strength of the math concepts contained in CMP in relationship to that laid out in CCSS and NCTM So now let’s explore the success of our pedagogy and methodology (our teachers and the CMP program we use to deliver the content) at promoting kids’ understanding of math concepts This is done via assessment. Canterbury School uses many assessments to measure student progress and to evaluate our program, but the most readily accessible is the ERB So my job is to help you understand what ERB scores are and how they can be indicative of our kids’ achievement in math
- First, a quick review. We administer a standardized test to students in grades 308 each spring called the Comprehensive Testing Program, or CTP. In particular, we use version 4, so it is called the CTP4. These tests are produced by a company called Educational Research Bureau, or ERB, so the tests we use are generally referred to as “the ERB’s”
- Within the CTP$ battery, there are two kinds of subtests. The first kind measures aptitude, or a child’s ability to learn and/or to manipulate knowledge in new ways. Other subtests measure achievement, a child’s immediate level of content knowledge and skills.
- Dave has already shown you the learning goals from the CMP program and how ideally matched they are to national understandings of learning outcomes or standards as described by the CCSS and NCTM Principles and Standards. But, specifically, which of that content shows up in the test items of the ERB? In general, each subtest of the ERB at any level contains test items drawn from three grade levels of content– the present grade, the last grade level, and the next grade level. This enables the math subtest to provide a snapshot of content at three levels of mastery– foundational content that should have been mastered in the grade before, desired learning outcomes from the the current grade, and if a student can use what he or she knows to at a more challenging level.
- If you think about the test items in this way, a score of 66% indicates a student theoretically has answered 1/3 of the questions correctly showing full mastery of the 33% of the content from the previous year AND has answered the second third of the questions correctly and knows the 33% of the content from the current grade. Anything higher than 66% could be considered “icing on the cake,” because it shows that a student answered questions correctly around content she or he is not formally expected to master until the end of the next grade!
- There is one other bit of scoring information that may be helpful. When we get students’ score reports, we also get an overall report with overall statistics about an entire grade of students. But these scores are NOT based on the number of questions a student has gotten right or wrong. Instead, these comparison scores compare the overall mean or average score from that grade against a group or groups of students that they consider to be a “typical” or “normal” bunch of test takers. This picture is of a statistical phenomenon called the “normal” curve, because it represents the idea that– among any group of test-takers, scores tend to fall into this pattern. A bunch of students score roughly the same and fewer test-takers score higher and lower. By tracing a group identified as the “norm” group over time, ERB established a norm score range and provides Canterbury with data about how well a current group of students did by comparison to this norm group. The most significant of these norm groups for us is the independent school norm, because that is the apples to apples idea I talked about at the beginning. So you will see that comparison on the following graphs.