The future of work infographic
•
0 likes•2,032 views

Alongside the recent shared article on the future of work https://www.slideshare.net/futureagenda2/the-future-of-work-oct-2018 this infographic highlights some of the key data driving and representing the changes underway. More information on https://www.futureagenda.org/news/future-of-work
Report
Share
Report
Share
Download to read offline
Recommended
Presentation by Andrew Bell, Head of OECD Skills Strategies at the OECD Centre for Skills for the 11th Meeting of the OECD Southeast Asian Regional Policy Network on Education and Skills, 24 November 2021
Mr. Andrew Bell, Head of the OECD Skills Strategy at the OECD Centre for Skills, discussed the general, overarching implications of mega trends (globalisation, technological progress, demographic change, migration and climate change) and the COVID-19 pandemic on skills demand and supply in Southeast Asia. Skills Implications of Megatrends from an International and National Perspective
Skills Implications of Megatrends from an International and National PerspectiveOECD Centre for Skills
Lee Rainie, Director of Internet and Technology research, spoke about the skills requirements for jobs in the future at the International Telecommunications Union’s “capacity building symposium” for digital technologies. He discussed the changing structure of jobs and the broad labor force and the attitudes of Americans about the likely changes that robots, artificial intelligence (AI) and other advances in digital life will create in workplaces. The session took place in Santo Domingo on June 18, 2018.Skills Requirements for Future Jobs - 10 Facts
Skills Requirements for Future Jobs - 10 FactsPew Research Center's Internet & American Life Project
El lza Mohamedou, Head of the OECD Centre for Skills presented at the Southeast Asia Regional Programme Forum on 20 May 2021, during the breakout session “Reskilling and upskilling for an inclusive and sustainable recovery”
Southeast Asia Regional Programme Forum 2021: Breakout session “Reskilling an...
Southeast Asia Regional Programme Forum 2021: Breakout session “Reskilling an...OECD Centre for Skills
Labor Markets Core Course 2013: Jobs as Pathways to Ending Poverty and Boosti...
Labor Markets Core Course 2013: Jobs as Pathways to Ending Poverty and Boosti...Health, Education, Social Protection and Labor World Bank
More Related Content
Similar to The future of work infographic
Lee Rainie, Director of Internet and Technology research, spoke about the skills requirements for jobs in the future at the International Telecommunications Union’s “capacity building symposium” for digital technologies. He discussed the changing structure of jobs and the broad labor force and the attitudes of Americans about the likely changes that robots, artificial intelligence (AI) and other advances in digital life will create in workplaces. The session took place in Santo Domingo on June 18, 2018.Skills Requirements for Future Jobs - 10 Facts
Skills Requirements for Future Jobs - 10 FactsPew Research Center's Internet & American Life Project
El lza Mohamedou, Head of the OECD Centre for Skills presented at the Southeast Asia Regional Programme Forum on 20 May 2021, during the breakout session “Reskilling and upskilling for an inclusive and sustainable recovery”
Southeast Asia Regional Programme Forum 2021: Breakout session “Reskilling an...
Southeast Asia Regional Programme Forum 2021: Breakout session “Reskilling an...OECD Centre for Skills
Labor Markets Core Course 2013: Jobs as Pathways to Ending Poverty and Boosti...
Labor Markets Core Course 2013: Jobs as Pathways to Ending Poverty and Boosti...Health, Education, Social Protection and Labor World Bank
Similar to The future of work infographic (20)
Mega trends impacting on higher education - riga, 6 november 2017
Mega trends impacting on higher education - riga, 6 november 2017
Workplace 2020 Playbook on Future of Talent Acquisition
Workplace 2020 Playbook on Future of Talent Acquisition
Southeast Asia Regional Programme Forum 2021: Breakout session “Reskilling an...
Southeast Asia Regional Programme Forum 2021: Breakout session “Reskilling an...
Labor Markets Core Course 2013: Jobs as Pathways to Ending Poverty and Boosti...
Labor Markets Core Course 2013: Jobs as Pathways to Ending Poverty and Boosti...
Life Science: Engaging Active and Passive Jobseekers in Europe and Asia
Life Science: Engaging Active and Passive Jobseekers in Europe and Asia
What's Keeping Women out of Data Science? (press deck)
What's Keeping Women out of Data Science? (press deck)
The Asian Talent Crunch - The Current Skills Shortages in Asia
The Asian Talent Crunch - The Current Skills Shortages in Asia
Making Gender Targets Count: Time for G20 Leaders to Deliver
Making Gender Targets Count: Time for G20 Leaders to Deliver
More from Future Agenda
More from Future Agenda (20)
Future of off premise dining an initial perspective - 01 03 22
Future of off premise dining an initial perspective - 01 03 22
Future of asthma care a global expert view - summary - august 2021
Future of asthma care a global expert view - summary - august 2021
Future of work employability and digital skills march 2021
Future of work employability and digital skills march 2021
The UK in 2030 - An expert informed view on some key trends
The UK in 2030 - An expert informed view on some key trends
Future of retail - Five key future trends - 9 Dec 2020
Future of retail - Five key future trends - 9 Dec 2020
Future of work employability and digital skills nov 2020
Future of work employability and digital skills nov 2020
The world's most innovative cities past present future - oct 2020
The world's most innovative cities past present future - oct 2020
Future of hospital design initial perspective - sept 2020
Future of hospital design initial perspective - sept 2020
Future Risk: 12 Key Issues for Insurance in the Next Decade
Future Risk: 12 Key Issues for Insurance in the Next Decade
Recently uploaded
Recently uploaded (20)
Falcon Invoice Discounting: Unlock Your Business Potential
Falcon Invoice Discounting: Unlock Your Business Potential
Al Mizhar Dubai Escorts +971561403006 Escorts Service In Al Mizhar
Al Mizhar Dubai Escorts +971561403006 Escorts Service In Al Mizhar
Ooty Call Gril 80022//12248 Only For Sex And High Profile Best Gril Sex Avail...
Ooty Call Gril 80022//12248 Only For Sex And High Profile Best Gril Sex Avail...
obat aborsi bandung wa 081336238223 jual obat aborsi cytotec asli di bandung9...
obat aborsi bandung wa 081336238223 jual obat aborsi cytotec asli di bandung9...
Nanded Call Girl Just Call 8084732287 Top Class Call Girl Service Available
Nanded Call Girl Just Call 8084732287 Top Class Call Girl Service Available
Jual Obat Aborsi ( Asli No.1 ) 085657271886 Obat Penggugur Kandungan Cytotec
Jual Obat Aborsi ( Asli No.1 ) 085657271886 Obat Penggugur Kandungan Cytotec
Falcon Invoice Discounting: Empowering Your Business Growth
Falcon Invoice Discounting: Empowering Your Business Growth
Berhampur 70918*19311 CALL GIRLS IN ESCORT SERVICE WE ARE PROVIDING
Berhampur 70918*19311 CALL GIRLS IN ESCORT SERVICE WE ARE PROVIDING
KALYANI 💋 Call Girl 9827461493 Call Girls in Escort service book now
KALYANI 💋 Call Girl 9827461493 Call Girls in Escort service book now
Pre Engineered Building Manufacturers Hyderabad.pptx
Pre Engineered Building Manufacturers Hyderabad.pptx
Only Cash On Delivery Call Girls In Sikandarpur Gurgaon ❤️8448577510 ⊹Escorts...
Only Cash On Delivery Call Girls In Sikandarpur Gurgaon ❤️8448577510 ⊹Escorts...
QSM Chap 10 Service Culture in Tourism and Hospitality Industry.pptx
QSM Chap 10 Service Culture in Tourism and Hospitality Industry.pptx
Horngren’s Cost Accounting A Managerial Emphasis, Canadian 9th edition soluti...
Horngren’s Cost Accounting A Managerial Emphasis, Canadian 9th edition soluti...
Challenges and Opportunities: A Qualitative Study on Tax Compliance in Pakistan
Challenges and Opportunities: A Qualitative Study on Tax Compliance in Pakistan
Puri CALL GIRL ❤️8084732287❤️ CALL GIRLS IN ESCORT SERVICE WE ARW PROVIDING
Puri CALL GIRL ❤️8084732287❤️ CALL GIRLS IN ESCORT SERVICE WE ARW PROVIDING
Berhampur CALL GIRL❤7091819311❤CALL GIRLS IN ESCORT SERVICE WE ARE PROVIDING
Berhampur CALL GIRL❤7091819311❤CALL GIRLS IN ESCORT SERVICE WE ARE PROVIDING
The future of work infographic
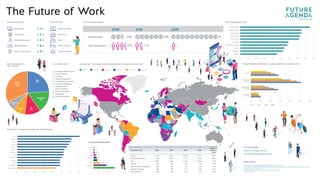
- 1. The Future of Work Data sources: https://data.oecd.org/eduatt/population-with-tertiary-education.htm http://www.ilo.org/global/about-the-ilo/multimedia/maps-and-charts/enhanced/WCMS_541385/lang--en/index.htm https://population.un.org/wpp/ http://www3.weforum.org/docs/WEF_Future_of_Jobs_2018.pdf Company Reports Unemployment - Percentage of adults who are looking for but unable to find work (2017) 0 10 20 30 40 Russia 2.4%Japan 3.9%China 3.9%US 6.0% 6.8%EU Average 7.1%India 13.1%Brazil South Africa 42.0%Kenya 27.2% Unemployment Rates (2018) 0% 10% 20% 30% 40% 50% 60% Low income countries Middle income countries High income countires World 2020 2030 2040 2050 Top 10 Companies Globally Top 10 Skills in 2020 1. Complex Problem Solving 2. Critical Thinking 3. Creativity 4. People Management 5. Coordinating with Others 6. Emotional Intelligence 7. Judgement and Decision Making 8. Service Orientation 9. Negotiation 10.Cognitive Flexibility For more details: www.futureagenda.org tim.jones@futureagenda.org 0% 10% 20% 30% 40% 50% 60% 70% 80% 90% Blockchain New Materials Encyption Augmented / Virtual Reality Digital Trade Cloud Computing Machine Learning Internet of Things App-enabled Markets Big Data Analytics Technology Adoption by 2022 70%0% 10% 20% 30% 40% 50% 60% OECD Average United States Israel Norway Switzerland UK Australia Ireland Lithuania Russia Japan Canada Korea below 4% from 4-6% from 6-9% from 9-13% from 13-17% above 17% Most New Jobs (2022) Redundant Roles Data Analysts Data Entry Clerks AI Specialists Accounting Operations Managers Admin Big Data Analysts Factory Workers Digital Transformation Customer Support < 1 > < 2 > < 3 > < 4 > < 5 > Growth Population (m) 2020 2030 2040 2050 2020 to 2050 World 7,795 8,551 9,210 9,771 25% Sub Saharan Africa 1,106 1,418 1,776 2,167 96% Asia 4,623 4,946 5,154 5,256 14% Europe 743 739 729 716 -4% Latin America / Caribbean 664 718 757 780 17% Northern America 369 395 417 434 18% Rest of World 290 335 377 418 44% Total Value ($tn) Total Employees (m) 2008 2.60 3.51 5.98 10 2018 2028 1.73 1 Old-age Dependency Ratio (Ratio of population aged 65+ per population 20-64) Percent of 25 to 34 years old Population with Tertiary Education Most Freelancers (2017) Top 5 countries India 24% US 12% Pakistan 9% Philippines 7% Rest of World 32% Bangladesh 16%