Weekly Newsletter for 30th October, 2010
•
0 likes•100 views

Catch the latest Equity research reports from Fullerton Securities at http://www.fullertonsecurities.co.in/equity/markets/research_reports.aspx

Recommended
More Related Content
What's hot
What's hot (20)
Viewers also liked
Viewers also liked (10)
Similar to Weekly Newsletter for 30th October, 2010
Similar to Weekly Newsletter for 30th October, 2010 (20)
More from Fullerton Securities
More from Fullerton Securities (20)
Recently uploaded
Recently uploaded (20)
Weekly Newsletter for 30th October, 2010
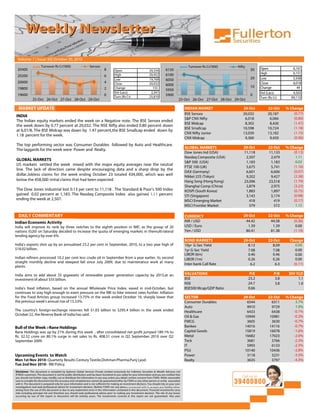
- 1. MARKET UPDATE INDIAN MARKET 29-Oct 22-Oct % Change BSE Sensex 20,032 20,187 (0.77) S&P CNX Nifty 6,018 6,066 (0.80) BSE Midcap 8,302 8,426 (1.47) BSE Smallcap 10,598 10,724 (1.18) CNX Nifty Junior 13,030 13,182 (1.15) CNX Midcap 9,360 9,450 (0.96) GLOBAL MARKETS 29-Oct 22-Oct % Change Dow Jones Ind (USA) 11,118 11,133 (0.13) Nasdaq Composite (USA) 2,507 2,479 1.11 S&P 500 (USA) 1,183 1,183 0.02 FTSE 100 (UK) 5,675 5,741 (1.16) DAX (Germany) 6,601 6,606 (0.07) 9,202 9,427 (2.38) 23,096 23,518 (1.79) Shanghai Comp (China) 2,879 2,975 (3.23) KOSPI (South Korea) 1,883 1,897 (0.75) Nikkei 225 (Tokyo) Hang Seng (Hong Kong) Volume: 1 | Issue: 82| October 30, 2010 0 2 4 6 8 19600 19800 20000 20200 20400 25-Oct 26-Oct 27-Oct 28-Oct 29-Oct Turnover Rs Cr('000) Sensex 0 10 20 30 5900 5950 6000 6050 6100 6150 25-Oct 26-Oct 27-Oct 28-Oct 29-Oct Turnover Rs Cr('000) Nifty INDIA The Indian equity markets ended the week on a Negative note. The BSE Sensex ended the week down by 0.77 percent at 20,032. The NSE Nifty also ended 0.80 percent down at 6,01/8. The BSE Midcap was down by 1.47 percent,the BSE Smallcap ended down by 1.18 percent for the week. The top performing sector was Consumer Durables followed by Auto and Healthcare. The laggards for the week were Power and Realty. GLOBAL MARKETS US markets settled the week mixed with the major equity averages near the neutral line. The lack of direction came despite encouraging data and a sharp drop by the dollar.Jobless claims for the week ending October 23 totaled 434,000, which was well below the 458,000 initial claims that had been expected. The Dow Jones industrial lost 0.13 per cent to 11,118 . The Standard & Poor's 500 Index gained 0.02 percent at 1,183. The Nasdaq Composite Index also gained 1.11 percent Open 20,334 High 20,452 Low 19,769 Close 20,032 Change 155 Vol (Lacs) 2,341 Turn (Rs Cr) 25,810 Open 6,101 High 6,151 Low 5,938 Close 6,018 Change 49 Vol (Lacs) 4,503 Turn (Rs Cr) 89,110 KOSPI (South Korea) 1,883 1,897 STI (Singapore) 3,143 3,174 (0.98) MSCI Emerging Market 418 419 (0.17) MSCI Frontier Market 579 572 1.15 DAILY COMMENTARY CURRENCY 29-Oct 22-Oct % Change INR / USD 44.42 44.58 (0.36) USD / Euro 1.39 1.39 0.00 Yen / USD 80.41 81.38 (1.19) BOND MARKETS 29-Oct 22-Oct Change 8.13 8.09 0.04 7.08 7.08 0.00 0.46 0.46 0.00 0.26 0.26 0.00 6.2 6.3 (0.11) VALUATIONS P/E P/B DIV YLD 23.2 3.8 1.1 24.7 3.8 1.0 0.66 SECTOR 29-Oct 22-Oct % Change Consumer Durables 6544 6311 3.7% Auto 9910 9729 1.9% Healthcare 6433 6438 -0.1% Oil & Gas 10949 10981 -0.3% FMCG 3605 3630 -0.7% Bankex 14016 14116 -0.7% Capital Goods 15819 16078 -1.6% Metal 16682 17023 -2.0% Teck 3681 3766 -2.3% IT 5993 6133 -2.3% PSU 10140 10436 -2.8% Power 3118 3231 -3.5% Realty 3635 3797 -4.3% NSE BSE500 Mcap/GDP Ratio BSE LIBOR (1m) Inter-bank Call Rate 10yr G-Sec Yield 1yr G-Sec Yield LIBOR (6m) Indian Economic Activity India will improve its rank by three notches to the eighth position in IMF, as the group of 20 nations (G20) on Saturday decided to increase the quota of emerging markets in themulti-lateral lending agency by over 6%. India's exports shot up by an annualised 23.2 per cent in September, 2010, to a two year high of $18.02 billion. Indian refiners processed 10.2 per cent less crude oil in September from a year earlier, its second straight monthly decline and steepest fall since July 2009, due to maintenance work at many plants. India aims to add about 35 gigawatts of renewable power generation capacity by 2015,at an investment of about $55 billion. India's food inflation, based on the annual Wholesale Price Index, eased in mid-October, but continues to stay high enough to exert pressure on the RBI to hike interest rates further. Inflation for the Food Articles group increased 13.75% in the week ended October 16, sharply lower that the previous week's annual rise of 15.53%. The country's foreign-exchange reserves fell $1.03 billion to $295.4 billion in the week ended October 22, the Reserve Bank of India has said. Bull of the Week :-Rane Holdings Rane Holdings was up by 21% during this week , after consolidated net profit jumped 189.1% to Rs. 32.32 crore on 80.1% surge in net sales to Rs. 408.51 crore in Q2 September 2010 over Q2 September 2009. Upcoming Events to Watch Mon 1st Nov 2010:-Quarterly Results Century Textile,DishmanPharma,Punj Lyod. Tue 2nd Nov 2010:- RBI Policy. Disclaimer: This document is compiled by Epitome Global Services Private Limited exclusively for Fullerton Securities & Wealth Advisors Ltd (FSWA) customers. This document is not for public distribution and has been furnished to you solely for your information and you are notified that you should not further copy, modify, use or distribute the information in any way unless you obtain written consent from FSWA. While reasonable care to compile the document but the accuracy and completeness cannot be guaranteed either by FSWA or any other person or entity associated with it. The document is prepared only for your information and is not sufficient for making an investment decision. You should rely on your own investigations and seek professional advice for investment decision. Neither FSWA nor any person connected with it, accepts any liability either gained 0.02 percent at 1,183. The Nasdaq Composite Index also gained 1.11 percent ending the week at 2,507. investigations and seek professional advice for investment decision. Neither FSWA nor any person connected with it, accepts any liability either arising from the use of this document or due to any inadvertent error in the information contained in this document. Financial investments carry risks including principal risk and therefore you should seek professional advice prior to making any investment decision. The risk of any losses occurring by use of this report or document will be entirely yours. The investments covered in this report are not guaranteed. Also past
- 2. COMMODITY 29-Oct 22-Oct Change % Change Crude Oil (USD/bbl) 81.5 81.9 (0) (0.6) Gold (Rs/10 gm) 19,786.0 19,428.0 358 1.8 Silver (Rs/kg) 36,954.0 35,180.0 1774 5.0 SECTORAL ANALYSIS TOP PERFORMING SECTORS BSE Consumer Durables % Average Gainers This Wk Prev. Wk Return Volume Titan Inds. 3553 3287 8.1 2,084 Rajesh Exports 118 110 7.1 65,157 Gitanjali Gems 295 289 2.2 121,096 Blue Star 454 469 (3.1) 2,027 Videocon Inds. 253 265 (4.3) 50,256 BSE Auto % Average Gainers This Wk Prev. Wk Return Volume Cummins India 793 747 6.1 4,077 Maruti Suzuki 1551 1509 2.8 17,213 M & M 732 716 2.3 86,203 Bajaj Auto 1514 1492 1.5 35,736 MRF 9302 9183 1.3 1,208 Price Price Volume: 1 | Issue: 82| October 30, 2010 Sectoral Performance Analysis BSE Consumer Durables The BSE Consumer Durables index gained 3.7 percent for the week. The top gainer for the week was Titan Industries gaining 8.1 percent followed by Rajesh Exports gaining 7.1 percent. The loosers in this sector were Gitanjali Gems,Blue Star and Videocon lost in the range of 3.1-4.3 percent . BSE Auto The BSE Auto Index gained 1.9 percent this week. The top gainers were Cummins India gaining 6.1 percent followed by Maruti gaining 2.8 percent. M&M gained 2.3 percent on back of good Q2FY11 results , Bajaj Auto gained 1.5 percent and MRF gained 1.3 percent. Light Sweet Crude Oil lost 0.6 percent this week closing at $81.5 from $81.9 per barrel last week. Gold gained 1.8 percent closed at Rs 19,786 while Silver closed 5.0 percent higher at Rs 36,954 in the Indian market respectively. BSE Healthcare % Average Gainers This Wk Prev. Wk Return Volume Ipca Labs. 325 304 7.0 44,581 Glenmark Pharma. 340 319 6.5 84,923 Dr Reddy's Labs 1658 1638 1.2 31,158 Apollo Hospitals 522 516 1.2 8,216 Cipla 352 353 (0.2) 186,649 Jubilant Life 315 318 (0.9) 31,981 BSE Oil & Gas % Average Gainers This Wk Prev. Wk Return Volume B P C L 730 724 0.9 47,138 Reliance Inds. 1096 1090 0.5 385,307 Essar Oil 147 148 (0.4) 498,932 I O C L 419 430 (2.7) 69,067 H P C L 487 501 (2.8) 52,351 BSE fmcg % Average Gainers This Wk Prev. Wk Return Volume Godrej Consumer 419 405 3.5 26,236 Colgate-Palm. 875 858 2.0 4,771 Nestle India 3489 3444 1.3 4,657 ITC 171 169 1.1 229,311 Ruchi Soya Inds. 132 134 (1.4) 90,830 Mcleod Russel 230 237 (2.8) 6,941 Price Price Price BSE Healthcare The BSE Healthcare Index lost 0.1 percent this week . The top gainer in this index was Ipca Labs gaining 7.0 percent followed by Glenmark gaining 6.5 percent.Dr Reddy gained 1.2 percent , Apollo Hospitals gained 1.2 percent .The loosers in this sector were Cipla and Jubilant Life loosing 0.2 and 0.9 percent respectively. BSE Oil & Gas The BSE Oil & Gas Index lost 0.3 percent this week. The Top gainer in this index was BPCL gaining 0.9 percent followed by RIL gaining 0.5 percent.The loosers were Essar oil ,IOCLand HPCL losing in the range of 0.4 - 2.8 percent. BSE FMCG The BSE FMCG Index lost 0.7 percent this week . Top gainer in this index was Godrej Consumers gaining 3.5 percent followed by Colgate Pamolive gaining 2.0 percent. Nestle gained 1.3 percent. The other gainers in this sector were ITC gaining 1.1 percent.The loosers in this sector were Ruchi Soya and Mcleod Russel loosing in the range of 1.4-2.8 percent. This document is compiled by Epitome Global Services Private Limited exclusively for Fullerton Securities & Wealth Advisors Ltd (FSWA) customers. This document is not for public distribution and has been furnished to you solely for your information and you are notified that you should not further copy, modify, use or distribute the information in any way unless you obtain written consent from FSWA. While reasonable care to compile the document but the accuracy and completeness cannot be guaranteed either by FSWA or any other person or entity associated with it. The document is prepared only for your information and is not sufficient for making an investment decision. You should rely on your own investigations and seek professional advice for investment decision. Neither FSWA nor any person connected with it, accepts any liability either arising from the use of this document or due to any inadvertent error in the information contained in this document. Financial investments carry risks including principal risk and therefore you should seek professional advice prior to making any investment decision. The risk of any losses occurring by use of this report or document will be entirely yours. The investments covered in this report are not guaranteed. Also past performance of an investment or fund is not an indication of future performance. FSWA, its affiliates, or associates, or any regulatory or other body or entity assumes no liability or responsibility for investment results or losses arising out of investment decisions made by you. This document is not to be considered as an offer to sell or a solicitation to buy any security or financial product. FSWA reserves the right to modify or alter the terms and conditions of the use of this service or discontinue, temporarily or permanently, the information and services provided (or any part thereof) at any time, with or without prior notice and FSWA shall not be liable to you for any suspension,modification,or terminationof the informationand services provided herein.
- 3. FII / MF ACTIVITY (Rs. Cr) 22-Oct 25-Oct 26-Oct 27-Oct 28-Oct 1138.26 698.7 97.7 -557.7 - 150 651 -135 -372 -70.7 219 321 754.25 -300 - -392 88.38 -853 -472 -146 -12 -37.9 3.1 -22 -50.8 1103 1721 -133 -1723 -267 189918 193126 195940 198690 201197 314.1 95.1 -343.9 -376.1 -80.4 TURNOVER (Rs. Cr) Name Rs % Rs % Rs % Maruti Suzuki 1551.2 3.0% Atlas Copco (I) 1798.95 11.0% Rane Holdings 330.65 21.0% M & M 731.9 2.0% Thermax 863.65 10.0% LGS Global 75 21.0% ICICI Bank 1161.7 2.0% City Union Bank 50.5 10.0% Seshasayee Paper 256.5 20.0% ITC 171.2 1.0% UTV Software 574 9.0% Elgi Equipment 184.3 19.0% Reliance Inds. 1095.8 0.0% Dena Bank 136.45 8.0% Sonata Software 59.4 18.0% Name Rs % Rs % Rs % NTPC 195.0 -6.0% Bajaj Electrical 271 -17.0% SE Investments 23.45 -53.0% FII Cash Net FII Index Futures FII Index Options FII Stock Futures FII Stock Options Open Interest FII Net TOP 5 MIDCAP GAINERS TOP 5 SMALLCAP GAINERS Name Name Name Mutual Fund Name MOVERS & SHAKERS TOP 5 FRONTLINE GAINERS TOP 5 FRONTLINE LOSERS TOP 5 MIDCAP LOSERS TOP 5 SMALLCAP LOSERS Volume: 1 | Issue: 3 | April 8, 2009Volume: 1 | Issue: 82 | October 30, 2010 19700 19800 19900 20000 20100 20200 20300 20400 -2000 -1500 -1000 -500 0 500 1000 1500 2000 22-Oct 25-Oct 26-Oct 27-Oct 28-Oct MF FII Sensex 4813 4959 5899 5373 5018 14941 15818 16828 24832 16742 160796 144405 252505 118781 0 20000 40000 60000 25-Oct 26-Oct 27-Oct 28-Oct 29-Oct BSE NSE CASH NSE F&O NTPC 195.0 -6.0% Bajaj Electrical 271 -17.0% SE Investments 23.45 -53.0% Tata Steel 590.0 -5.0% MVL 64.05 -14.0% TRF 653 -24.0% Hindalco Inds. 210.5 -5.0% Financial Tech. 986.3 -14.0% Avance Tech. 7 -19.0% DLF 350.1 -5.0% Mahindra Holiday 409.85 -12.0% Subhkam Capital 350.9 -18.0% JP Associates 120.3 -4.0% Jyothy Lab. 275.2 -12.0% Well Pack Paper. 50.4 -17.0% Company Name Transaction Date Holding after Transaction % Ambuja Cements J C Toshniwal 23/9/2010 10000 0 Ambuja Cements Rameshchandra Darak 23/09/2010 8000 0.01 Asian Hotels (West) Sushil Gupta 23/09/2011 86100 5.82 Chambal Fertilisers H S Bawa 23/09/2012 15490 0.04 Compucom Software Sambhav Infotech Pvt Ltd 23/09/2013 100000 26.1 HDFC Bank Arup Kumar Rakshit 25/09/2010 500 0.00 Hindustan Media Reliance Dual Advantage Fund 25/09/2011 9000 5.00 India Steel Works Sandeep Mulik 25/09/2012 3000 0.02 ITC Ltd K N Grant 25/09/2013 40000 0.00 Jindal Steel & Power Rakesh Jindal 24/09/2010 1100 - Jubilant Organosys Dr. Naresh Trehan 15/09/2010 25000 0.02 M & M Financial Services Standard Chartered Pvt Equity 14/09/2010 2358831 7.37 Navneet Publications Mohinder Pal Bansal 13/09/2010 4000 - OnMobile Global Kiran M A 09/09/2010 22200 - Oracle Financial Services Vijay Sharma 14/09/2010 500 - Page Industries Nari Genomal 13/09/2010 7639 20.50 Sanguine Media Ramesh Genomal 13/09/2010 6900 20.51 Smartlink Network Systems Sunder Genomal 13/09/2010 6949 20.50 Transformers and Rectifiers C V Ravi 13/09/2010 200000 13.48 Smartlink Network K R Naik 16/09/2010 15916 48.18 BUY BUY SELL SELL BUY SELL SELL SELL SELL SELL SELL BUY SELL SELL SELL BUY SELL BUY SELL INSIDER UPDATES No. of Shares Transacted Quantity BUY/SELLAcquirer Designation Company Official SELL Company Official CMD MD Strategic Investor Strategic Investor Strategic Investor Strategic Investor Chairman Vice President Director Strategic Investor Strategic Investor Promoter Group Promoter Group Strategic Investor Director Strategic Investor Vice President Promoter Group Disclaimer: This document is compiled by Epitome Global Services Private Limited exclusively for Fullerton Securities & Wealth Advisors Ltd (FSWA) customers. This document is not for public distribution and has been furnished to you solely for your information and you are notified that you should not further copy, modify, use or distribute the information in any way unless you obtain written consent from FSWA. While reasonable care to compile the document but the accuracy and completeness cannot be guaranteed either by FSWA or any other person or entity associated with it. The document is prepared only for your information and is not sufficient for making an investment decision. You should rely on your own investigations and seek professional advice for investment decision. Neither FSWA nor any person connected with it, accepts any liability either arising from the use of this document or due to any inadvertent error in the information contained in this document. Financial investments carry risks including principal risk and therefore you should seek professional advice prior to making any investment decision. The risk of any losses occurring by use of this report or document will be entirely yours. The investments covered in this report are not guaranteed. Also past performance of an investment or fund is not an indication of future performance. FSWA, its affiliates, or associates, or any regulatory or other body or entity assumes no liability or responsibility for investment results or losses arising out of investment decisions made by you. This document is not to be considered as an offer to sell or a solicitation to buy any security or financial product. FSWA reserves the right to modify or alter the terms and conditions of the use of this service or discontinue, temporarily or permanently, the information and services provided (or any part thereof) at any time, with or without prior notice and FSWA shall not be liable to you for any suspension, modification, or termination of the information and services provided herein.