
Recommended
Recommended
More Related Content
Similar to 95Orchestrating Big Data Analysis Workflows in the Cloud.docx
Similar to 95Orchestrating Big Data Analysis Workflows in the Cloud.docx (20)
More from fredharris32
More from fredharris32 (20)
Recently uploaded
Recently uploaded (20)
95Orchestrating Big Data Analysis Workflows in the Cloud.docx
- 1. 95 Orchestrating Big Data Analysis Workflows in the Cloud: Research Challenges, Survey, and Future Directions MUTAZ BARIKA and SAURABH GARG, University of Tasmania ALBERT Y. ZOMAYA, University of Sydney LIZHE WANG, China University of Geoscience (Wuhan) AAD VAN MOORSEL, Newcastle University RAJIV RANJAN, China University of Geoscience (Wuhan) and Newcastle University Interest in processing big data has increased rapidly to gain insights that can transform businesses, govern- ment policies, and research outcomes. This has led to advancement in communication, programming, and processing technologies, including cloud computing services and technologies such as Hadoop, Spark, and Storm. This trend also affects the needs of analytical applications, which are no longer monolithic but com- posed of several individual analytical steps running in the form of a workflow. These big data workflows are
- 2. vastly different in nature from traditional workflows. Researchers are currently facing the challenge of how to orchestrate and manage the execution of such workflows. In this article, we discuss in detail orchestration requirements of these workflows as well as the challenges in achieving these requirements. We also survey current trends and research that supports orchestration of big data workflows and identify open research challenges to guide future developments in this area. CCS Concepts: • General and reference → Surveys and overviews; • Computer systems organization → Cloud computing; • Computing methodologies → Distributed algorithms; • Computer systems organization → Real-time systems; Additional Key Words and Phrases: Big data, cloud computing, workflow orchestration, research taxonomy, approaches, and techniques ACM Reference format: Mutaz Barika, Saurabh Garg, Albert Y. Zomaya, Lizhe Wang, Aad van Moorsel, and Rajiv Ranjan. 2019. Or- chestrating Big Data Analysis Workflows in the Cloud: Research Challenges, Survey, and Future Directions. ACM Comput. Surv. 52, 5, Article 95 (September 2019), 41
- 3. pages. https://doi.org/10.1145/3332301 This research is supported by an Australian Government Research Training Program (RTP) Scholarship. This research is also partially funded by two Natural Environment Research Council (UK) projects including (LANDSLIP:NE/P000681/1 and FloodPrep:NE/P017134/1). Authors’ addresses: M. Barika and S. Garg, Discipline of ICT | School of Technology, Environments and Design (TED), College of Sciences and Engineering, University of Tasmania, Hobart, Tasmania, Australia 7001; emails: {mutaz.barika, saurabh.garg}@utas.edu.au; A. Zomaya, School of Computer Science, Faculty of Engineering, J12 - Computer Science Build- ing. The University of Sydney, Sydney, New South Wales, Australia; email: [email protected]; L. Wang, School of Computer Science, China University of Geoscience, No. 388 Lumo Road, Wuhan, P. R China; email: [email protected]; A Van Moorsel, School of Computing, Newcastle University, Newcastle upon Tyne, NE1 7RU, United Kingdom; email: [email protected]; R. Ranjan, School of Computer Science, China University of Geoscience, No. 388 Lumo Road, Wuhan, P. R China, and School of Computing, Newcastle University, Newcastle upon Tyne, NE1 7RU, United Kingdom;
- 4. email: [email protected] Permission to make digital or hard copies of all or part of this work for personal or classroom use is granted without fee provided that copies are not made or distributed for profit or commercial advantage and that copies bear this notice and the full citation on the first page. Copyrights for components of this work owned by others than ACM must be honored. Abstracting with credit is permitted. To copy otherwise, or republish, to post on servers or to redistribute to lists, requires prior specific permission and/or a fee. Request permissions from [email protected] © 2019 Association for Computing Machinery. 0360-0300/2019/09-ART95 $15.00 https://doi.org/10.1145/3332301 ACM Computing Surveys, Vol. 52, No. 5, Article 95. Publication date: September 2019. https://doi.org/10.1145/3332301 mailto:[email protected] https://doi.org/10.1145/3332301 95:2 M. Barika et al. 1 INTRODUCTION In recent years, Big Data has gained considerable attention from governments, academia, and en- terprises. The term “big data” refers to collecting, analyzing,
- 5. and processing voluminous data. Those interested in big data are looking for ways to efficiently store and analyze their large datasets to distill useful information [22]. However, it is difficult for traditional data processing platforms to process large datasets with a great variety of types. Similarly, traditional data processing appli- cations that relied on these platforms are incapable of achieving the intended analytical insights to make better decisions. Hence, many big data platforms have recently been proposed for trans- acting with big data, facilitating the design and building of big data analysis applications to ingest, and processing as well as analyzing tremendous volumes of data. The complexity of supporting big data analysis is considerably larger than the perception cre- ated by recent publicity. Unlike software solutions that are specifically developed for some appli- cation, big data analytics solutions typically require the integration of existing trusted software components in order to execute the necessary analytical tasks. These solutions need to support the high velocity, volume, and variety of big data (i.e., 3Vs of big data [78]) and thus should leverage the capabilities of cloud datacenter computation as well as storage resources as much as possible. In particular, many of the current big data analytics solutions can be classified as data-driven work- flows, which integrate big data analytical activities in a workflow. Analytical tasks within these big data workflow applications may require different big data platforms (e.g., Apache Hadoop or Storm) as well as a large amount of computational and storage resources to process large volume
- 6. and high velocity data. Intrusion detection, disaster management, and bioinformatics applications are some examples of such applications. Big data workflows are very different from traditional business and scientific workflows (see Appendix B), as they have to continuously process heterogeneous data (batch and streaming data) and support multiple active analytical tasks at each moment in time. Moreover, they involve ana- lytical activities that have heterogeneous platform and infrastructure requirements, and the overall workflows can be highly dynamic in nature because processing requirements at each step are de- termined by data flow dependencies (the data produced in earlier steps in the workflow) as well as control flow dependencies (the structural orchestrations of data analysis steps in the work- flow). In addition, big data workflows are different from streaming operator graphs that formed by streaming processing systems like Apache Storm and Flink, as they have heterogeneous an- alytical activities, and involve multiple data sources that inject their data into upstream or/and downstream analytical activities and multiple outputs; but these systems employ continuous op- erator models to process streaming data only and have one cluster, and they form operator graphs with one feeding data source and one sink operator. The focus of previous workflow taxonomy studies [1, 46, 102, 141] are either on business pro- cesses and information systems (for G. M. Giaglis [46]) or Grid computing and its applications (for J. Yu and R. Buyya [141] and Rahman et al. [102]). Given the advancement in big data ap-
- 7. plications and systems, new surveys are required that can synthesize current research and help in directing future research. Some recent surveys (such as by Sakr et al. [109, 110] and Mansouri et al. [87]) focused on a specific aspect of the big data applications and their management. They have not given overall dimensions involved in their orchestration such as workflow initialization and parallelization. For example, Sakr et al. [110] focused on big data analysis with MapReduce model research, while Sakr et al. [109] and Mansouri et al. [87] studied only data management aspects for deploying data-intensive applications in the cloud. Recently, Liu et al. [79] provided a survey covering scheduling frameworks for various big data systems and a taxonomy based on their features without any indepth analysis of issues related to big data analytical workflows and their orchestration. ACM Computing Surveys, Vol. 52, No. 5, Article 95. Publication date: September 2019. Orchestrating Big Data Analysis Workflows in the Cloud 95:3 However, big data workflow applications processing big data exhibit different patterns and per- formance requirements that traditional workflow processing methods and current workflow man- agement systems cannot handle efficiently. Therefore, we require research into new orchestration models as well as orchestration platform and management technologies that can provide services to support the design of big data workflows, the selection of
- 8. resources (including at platform and infrastructure), and the scheduling and deployment of workflows. These needs for future research drive us to investigate the answer of the following research questions in this article: (1) what are the different models and requirements of big data workflow applications?, (2) what are the chal- lenges based on the nature of this type of workflow application and cloud + edge datacenters that we will face when developing a new big data orchestration system?, and (3) what are the current approaches, techniques, tools and technologies to address these challenges? To assist in this future aim and answer the above research questions, we identify the require- ments of big data workflow orchestration systems for management of such workflows execution on the cloud. We discuss the current state of the art, provide research taxonomy, and list open issues. The article makes the following concrete research contributions: — An exhaustive survey of big data programming models (see Section 3.3). We further elabo- rate on this survey to explain the relationship between big data programming models and workflows (Appendix A). — Propose a comprehensive research taxonomy to allow effective exploration, assessment, and comparison of various big data workflow orchestration issues (see Section 5) across multiple levels (workflow, data, and cloud). — Apply the proposed research taxonomy for surveying (see
- 9. Section 6) a set of carefully cho- sen big data workflow orchestration tools (see Appendix C), orchestration techniques, and research prototypes. — Identify current open research issues (see Section 8) in the management of big data work- flows based on the literature survey and requirements. This article is structured as follows: Section 2 compares the proposed research taxonomy against the literature. Section 3 presents a typical example of big data workflow that spans the three layers (workflow, data, and cloud) and its orchestration in a cloud system. Section 4 highlights the key important requirements of big data workflows while in Section 5, we present a taxonomy for chal- lenges in fulfilling those requirements. Section 6 presents the current approaches and techniques to address these challenges. Section 7 reviews scientific workflow systems with data-intensive capa- bilities and big data orchestrating systems, and discusses the capabilities of big data orchestrating systems against the presented research taxonomy. Section 8 presents and discusses the open issues for further research, while Section 9 concludes the article. 2 RELATED WORK: POSITIONING VERSUS EXISTING TAXONOMIES Several previous studies [1, 46, 102, 141] focus on understanding either business process modeling or scientific workflow orchestration tools and techniques. As discussed earlier, big data workflow applications present a unique set of requirements that require a fresh perspective on researching
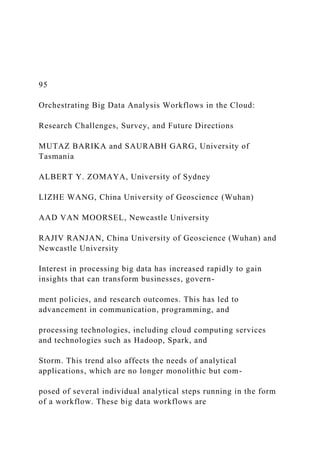
- 10. orchestration tools and techniques. In a narrow context, Liu et al. [79] provided a survey and taxonomy of existing big data work- flow orchestrators (e.g., Yet Another Resource Negotiator (YARN), Mesos), focusing on scheduling techniques. Sakr et al. [110] provided a survey of MapReduce- based approaches and techniques for the development of large-scale data analysis solutions. In another paper, Sakr et al. [109] pre- sented a survey of big data storage solutions (e.g., HadoopDB, HyperTable, Dryad) for managing ACM Computing Surveys, Vol. 52, No. 5, Article 95. Publication date: September 2019. 95:4 M. Barika et al. Fig. 1. An example workflow for anomaly detection over sensor data streams and its mapping to program- ming models/frameworks and cloud + edge datacenters. big data in cloud environments. Similarly, Mansouri et al. [87] presented a taxonomy and survey of cloud-based big data storage management tools. To the best of our knowledge, existing taxonomies and surveys are limited to one aspect of big data or data-intensive applications (e.g., MapReduce data processing model [110] or data manage- ment [87, 109]). In contrast, we present a holistic research taxonomy to understand end-to-end issues related to orchestrating big data workflow applications
- 11. on clouds. We propose a taxonomy that gives exhaustive classification of big data workflow orchestration tools and techniques from the perspective of additional (sub-)dimensions contributing to future development by giving “in- depth” analysis of existing works. In other words, this work aims to alleviate the research gaps in understanding the big data workflows. 3 BIG DATA WORKFLOW ORCHESTRATION 3.1 Representative Example of a Big Data Workflow To aid understanding of big data workflows and the issue of orchestrating such workflow applica- tions in the cloud and edge resources, we present a typical example of anomaly detection (shown in Figure 1). It is a representation of the workflow presented in Ref. [2]. The data pipeline is used to analyze sensor data streams for online anomaly detection. The repre- sentation of this workflow spans the three layers (workflow, data, and cloud) is shown in Figure 1. First of all, the streams of data (i.e., stream logs) are ingested in the pipeline by following a mes- sage ingestion model (i.e., Kafka), where all events that are collected within a window of time are pre-processed by filtering and enriching them with additional metadata, e.g., external timestamps. Next, aggregation of events is done, for example, per region or sensor type in a given window of time, which get clustered into different categories and later passed to pattern matching step (last step). At the cluster events step, a clustering-based outlier detection algorithm will run in a batch
- 12. fashion over all produced aggregated events in order to generate outliers (possible/proposed anom- alies). After that, all outliers are mined to extract possible frequent patterns, and those extracted patterns are further transformed into complex event processing queries reliant on the selected strategy. Finally, all patterns are matched to output the outliers by constantly injecting the rules into distributed complex event processing engines, and these engines perform continuous queries on the streams of data coming from either the pre-processing step or aggregate step for online anomaly detection. Accordingly, the stream programming model is followed for processing and analyzing sensor data streams ingested in this workflow to produce continuous insights (online ACM Computing Surveys, Vol. 52, No. 5, Article 95. Publication date: September 2019. Orchestrating Big Data Analysis Workflows in the Cloud 95:5 anomaly detection) by using Apache Storm [2]; also, the anomaly patterns and analysis results gen- erated in this workflow could be stored in Structured Query Language (SQL) or NoSQL databases. From the above example, we can easily see that the analytical tasks included in the data pipeline require seamless coordination for real-time and dynamic decision making, handling different types of heterogeneity and uncertainties such as changing in data velocity or data volume. That includes (1) fulfilling the need of diverse computational models for pre-
- 13. processing streams, aggregating and clustering events, and extracting possible frequent patterns; (2) managing inter-dependent analyt- ical tasks, where any change in execution and performance characteristics of one can affects the downstream steps; and (3) matching patterns’ analytical tasks needed to take the advantage of edge resources available at edge datacenters to perform edge analytics, avoiding any possible latency. Therefore, to achieve this seamless execution for such types of workflow, various programming tasks need to be performed, leading to several challenges related to cloud + edge resources and data orchestration, which span over three different levels (workflow, data, and cloud). 3.2 Workflow Level One of the aims of the big data workflow orchestration platform is to manage the sequence of analytical tasks (formed workflow application) that needs to deal with static as well as dynamic datasets generated by various data sources. This includes various programming tasks, i.e., work- flow composition and workflow mapping [104]. Workflow composition is to combine different analytical tasks, where their workloads are dependent on each other and any change made in the execution and characteristics of one step affects the others. Therefore, different users of the workflow define their requirements and constraints from different contexts, resulting in different analytical tasks of a workflow needing to be executed, where the requirements are not only dif- ferent but may also conflict with each other. Accordingly, a workflow orchestration system should
- 14. provide the guidance for domain experts to define and manage the entire pipeline of analytical tasks, data flow, and control flow, and their Service Level Agreement (SLA) and Quality of Service (QoS) needs. It can support different workflow orchestration techniques to compose heterogeneous analytical tasks on cloud and edge resources including script- based (that defines composition flow using script languages), event-based (that uses event rules defined in workflow language to provide responsive orchestration process), or adaptive orchestration (that dynamically adopts composition flow in accordance to application and execution environment needs). Internet of Things (IoT) and Cyber-Physical Systems (CPS) have several requirements such as processing a large amount of data streams from the physical world, the real-time decision making to sensor events and dynamic management of data flow [112]. In other words, IoT and CPS applications are adaptive workflows involving event-driven tasks that sophistically analyse data streams for decision making. These workflows can be considered as a specific exemplar of big data pipeline and managed under the umbrella of big data workflow orchestration system and techniques, as big data workflows con- sist of dynamic and heterogeneous analytical activities, where data arrives in different formats, at different volumes, and at different speeds [150]. Workflow mapping is to map the graph of analytical tasks to big data programming platforms (e.g., batch analytical task to Apache Hadoop, streaming analytical task to Apache Storm), cloud resources, and edge resources. It also needs to consider different configuration possibilities (con-
- 15. figuration of each big data programming framework, e.g., number of map and reduce tasks with Apache Hadoop in the context of batch processing; configuration of cloud resources, e.g., the type of resource and the location of datacenter; configuration of edge resources, e.g., type of edge device and network latency), This requires a cross-layer resources configuration selection technique in the big data orchestration system to select custom configurations from plenty of possibilities. ACM Computing Surveys, Vol. 52, No. 5, Article 95. Publication date: September 2019. 95:6 M. Barika et al. As a result, several challenges have emerged due to the complexity and dynamism of big data workflow including workflow specification languages, initialization, parallelization and schedul- ing, fault-tolerance, and security. Since the heterogeneous and dynamic nature of cloud + edge resources bring additional challenges (we will discuss this at Cloud + Edge Datacenter level), these challenges further complicate those workflow-related challenges. 3.3 Big Data Programming Models/Frameworks Level The processing of big data requires heterogeneous big data programming models, where each one of them provides a solution for one aspect. Within big data workflow, various computational models may be required for involved analytical tasks, where one
- 16. analytical task may also need dis- tinct computation models based on the characteristics of data (batch processing for static datasets, stream processing for dynamic datasets, hybrid processing for static and dynamic datasets). SQL and NoSQL models are also utilized for storing data to cope with volume and velocity of data. Therefore, understanding these models is essential in selecting the right big data processing frame- work for the type of data being processed and analyzed. These different models cover the ingesting, storing, and processing of big data. The MapReduce programming model (batch-oriented model) and stream programming model are used for data processing, NoSQL/SQL models are used for data storage, and message ingestion models are used for data importing. In this section, we will review these models and compare them to outline the main differences. The complex and dynamic configuration requirements of big data workflow ecosystems calls for the need to design and develop new orchestration platforms and techniques aimed at man- aging: (1) sequence of analytical activities (formed workflow application) that needs to deal with static as well as dynamic datasets generated by various data sources; (2) heterogeneous big data programming models; and (3) heterogeneous cloud resources. 3.3.1 MapReduce Programming Model. The MapReduce programming model [31] is a leading batch-oriented parallel data programming model that is intended for processing complex and mas- sive volumes of data at once (static data) to gain insights. It was
- 17. developed at Google Research and relied on the following functions: Map and Reduce. The input data (finite large datasets) is stored firstly in Hadoop Distributed File System (HDFS). Then, the input data is split into smaller chunks, and then these chunks are processed in a parallel and distributed manner by Map tasks that gen- erate intermediate key-value pairs. After that, these pairs are aggregated by Reduce function. Due to the finiteness property, this model has the capability to perform computation on data in stages, where it can wait until one stage of computation is done before beginning another stage of compu- tation, allowing it to perform jobs just as sorting all intermediate results globally [55]. Moreover, in respect of increasing the future computation load, this model allows us to scale horizontally by adding more workers to cope with such loads. This model exploits data locality to schedule computation tasks to avoid unnecessary data transmission [56]. 3.3.2 Stream Programming Model. In this model, data arrives in streams, which are assumed to be infinite and are being processed and analyzed (in a parallel and distributed manner) as they arrive and as soon as possible to produce incremental results [55, 56]. The sources of streams could be, for example, mobile and smart devices, sensors, and social media. Thus, the stream computation in the stream programming model is assumed to process continuous incoming streams with low latency (i.e., seconds and minutes of delays), instead of processing a very large dataset in hours and more [75]. There are two approaches to achieve this kind of pro- cessing/computation. The native stream processing approach
- 18. processes every event as it arrives in succession, resulting in the lowest-possible latency, which is considered as the advantage ACM Computing Surveys, Vol. 52, No. 5, Article 95. Publication date: September 2019. Orchestrating Big Data Analysis Workflows in the Cloud 95:7 of this approach; nevertheless, the disadvantage of this approach is that it is computationally expensive because it processes every incoming event. The micro-batch processing approach aims to decrease the cost of computation for the processing stream by treating the stream as a sequence of smaller data batches; in this approach, the incoming events are divided into batches by either time of arrival or once batch size hits a certain threshold, resulting in the reduction of processing computational cost, but could also bring together more latency [69, 82]. With this model, stream computations are independent of each other, which means there is no dependency or relation among them. Moreover, in respect of increasing future computation load, this model allows us to scale vertically and horizontally to cope with such loads. Due to data-flow graphs implementing both data programming models, the stream- programming model can emulate batch processing. Apache Storm is one of the examples of the stream processing platform. In addition to stream-oriented big data platforms, a number of stream-oriented services are offered by various cloud providers, which deliver stream-oriented big data
- 19. platforms as services. Examples of these services are Microsoft Azure Stream Analytics and IBM Streaming Analytics. 3.3.3 NoSQL/SQL Models. For storing big data, there are two models, which are: NoSQL model and SQL model. The NoSQL models (MongoDB, Amazon Dynamo, Cassandra, HyperTable, BigTable, HBase) provide access capabilities reliant on transactional programming primitives in which a specific key allows a search for a specific value. The use of these access primitives re- sults in improving the scalability and predictions of performance, making it suitable for storing huge amounts of unstructured data (such as mobile, communication, and social media data). SQL data stores (Oracle, SQL Server, MySQL, PostGreSQL) organize and manage data in relational ta- bles, where SQL as a generic language provides the ability to query as well as manipulate data. In essence, when transactional integrity (Atomicity, Consistency, Isolation, and Durability (ACID) properties) is a strict requirement, these data stores are more effective than NoSQL stores. How- ever, both NoSQL and SQL data stores are likely to be used by future big data applications, and that is driven by data varieties and querying needs. SQL Models (Apache Hive, Apache Pig) provide the ability to query data over various cloud storage resources, e.g., Amazon S3 and HDFS, based on structured query language. In respect of increasing future load, the NoSQL model allows us to scale horizontally using sharding or partitioning techniques to cope with this future load; while the SQL model has limited capability to cope with such loads.
- 20. 3.3.4 Message Ingestion Models. The message ingestion model is a publish-subscribe messag- ing pattern that allows us to import data from various sources and inject it as messages (i.e., events/streams) into big data platforms for processing to produce analytical insights, where the senders of messages are called publishers and the receivers of messages are called subscribers. The stream computations are independent to each other, which means there is no dependency or relation among them. Moreover, in respect of increasing future computation loads, this model can scale horizontally by adding more workers to cope with such loads. Relying on these mod- els, message ingestion systems (such as Amazon Kinesis and Apache Kafka) achieve a durable, high-throughput, fault-tolerant, and low-latency queuing of streaming data. Amazon Web Services (AWS) Kinesis is a cloud-based stream platform offered by Amazon. It provides powerful services that allow working easily with real- time streaming data (to load and analyze continuous data) in the AWS cloud, and the ability to develop and build custom streaming data applications to meet specific needs. 3.3.5 Hybrid Models. To support applications requiring both batch and stream data processing, hybrid models are developed. An example of a cloud service that implements hybrid data program- ming models (batch and stream) is Google cloud Dataflow. It is a Google fully-managed service for ACM Computing Surveys, Vol. 52, No. 5, Article 95. Publication date: September 2019.
- 21. 95:8 M. Barika et al. stream data processing and batch data processing as well. Dataflow is an unified execution frame- work and programming model for creating and executing both batch and stream pipelines to load, process, and analyze data, without having to pay attention to operational tasks such as resource management and performance optimization. As an execution framework, it handles the lifetime of resources transparently and provisions resources on demand to reduce latency while, at the same time, maintaining high utilization efficiency. Moreover, as a unified programming model, it uses the Apache Beam model that eliminates programming model switching cost between batch and streaming mode by providing the ability for developers to represent the requirements of compu- tation without taking into consideration the data source. Lambda Model—A batch-first approach uses batching for unifying … Christian Bischof Daniela Wilfinger https://doi.org/10.21278/TOF.43206 ISSN 1333-1124 eISSN 1849-1391
- 22. BIG DATA-ENHANCED RISK MANAGEMENT Summary Today’s global and complex supply networks are susceptible to a broad variety of internal and external risks. Thus, comprehensive and innovative approaches to risk management are required. This paper addresses the question of how Big Data can be used for the implementation of an advanced risk management system. A conceptual framework covering three major dimensions of Big Data-driven risk management, i.e. type of risk, risk management phases and available technology, is introduced. Additionally, selected application examples for early detection, assessment, mitigation and prevention of risks in supply networks are provided. Key words: Risk Management, Supply Networks, Digitalisation, Big Data 1. Introduction Global supply networks are the basis for gaining access to raw materials, suppliers, and markets. Although these global networks provide substantial advantages and potentials for all companies involved in the supply chain, they also contain substantial risks mainly coming from a high degree of vulnerability and exposure of intra- and inter-company production and logistic processes to unforeseen events. [1] Thus, real-time reactions to disturbances,
- 23. especially of time-critical processes, become increasingly important. Accordingly, John Chambers, the chairman and chief executive officer of Cisco Systems, made the following remark after the earthquake in Japan: “In an increasingly networked world, supply chain risk management is top of mind in global organizations as well as a key differentiator for leading value chain organizations”. [2] As a consequence, innovative approaches to supply management have gained importance in recent years. Generally, supply chain management is a widely accepted concept for the target-oriented management of (global) supply chains and networks. In today’s complex and dynamic environment, risks in the supply chain constantly endanger the profitability of the companies involved. Therefore, approaches like risk-adjusted supply chain management including structured risk management and an early- warning system can potentially avoid or mitigate risks, leading to a further improved financial performance and competitive advantages. [3] TRANSACTIONS OF FAMENA XLIII-2 (2019) 73 C. Bischof, D. Wilfinger Big Data-Enhanced Risk Management Recent developments in the field of digital technology have improved support for approaches like risk-adjusted supply management. The
- 24. application of innovative technologies, in-memory computing, the Internet of Things (IoT), and Radio Frequency Identification (RFID), can facilitate establishing globally interconnected manufacturing and logistics systems. This leads to greater transparency and agility, and consequently to the ability to manage the constantly increasing dynamics and complexity of global supply networks. [4] 2. Research Purpose and Methodology This paper addresses the question of how Big Data potentially affects risk management in supply networks. For this purpose, the currently ongoing transformation of supply chains into supply networks is outlined first. This sets a basis for the analysis of major risks lurking in such networks. Furthermore, a risk management cycle is introduced as the methodological basis representing one dimension of the framework for Big Data-enhanced risk management developed subsequently. In contrast to existing approaches, this framework aims at providing a comprehensive view of risk management by integrating two additional dimensions: the type of risk and the technology that can either avoid or minimize risk. 3. Transformation of Supply Chains into Supply Networks One of major challenges facing global companies are planning, managing and controlling their supply chains. [5] So far, the global division of work processes has shaped modern supply chains, leading to economic benefits – especially
- 25. for industrialized countries. In this context, the supply chain is considered as a linear chain in which the material, information and finances flow linearly in one direction from suppliers to producers, retailers and end customers. This process is ongoing as companies are still deciding on whether an intensified participation in global supply chains may increase their profitability. Today, discussions and decisions in supply management mainly take place in the context of “make, cooperate or buy”. Companies do not act as a self-contained construct anymore, but rather consider collaborative partnerships as a sustainable competitive advantage. [6] Previously, supply chain professionals managed the “Four V’s - Volatility, Volume, Velocity, and Visibility” in order to optimize objectives, such as total cost or service quality. [7] Although still valid, these objectives are currently challenged as digital technologies enable innovative approaches to the setup, organization, management, and hence to the performance of global supply chains. [8] Originally, the main driver for the development of inter-organizational supply networks was the application of internet technologies for information allocation. [9] Recent developments in digitalisation and digital technologies have accelerated the transformation of supply chains into complex and globally interrelated supply networks with numerous interfaces and channels. The horizontal integration of these supply networks has to consider a vast number of requirements of systems, processes and
- 26. cultures coming from different companies and locations. [10] Since the external environment of such networks has also become more complex and increasingly volatile, the planning and management efforts together with the inherent risks of global supply networks have grown significantly. 4. Risk Management in Global Supply Networks Today, companies are exposed to a large number of risks resulting from market globalisation, reduced product lifecycles, complex networks of international partners, unpredictable demand, uncertain supply, cost pressure, necessity to be lean and agile, increasing outsourcing and off-shoring, and dependency on suppliers [11]. In the specific context of logistics and supply chain management, risks may arise from the complexity of the 74 TRANSACTIONS OF FAMENA XLIII-2 (2019) Big Data-Enhanced Risk Management C. Bischof, D. Wilfinger market characterized by the shortage of suppliers, replacement products and technologies. [12] More comprehensively, the supply chain risk can be considered as any risk to the flows of information, material and product from the original suppliers to the delivery of the final product to the end customer. [13] According to March and Shapira, the supply chain risk is “a
- 27. variation in the distribution of possible supply chain outcomes, their likelihood, and their subjective values”. [14] Merging the two definitions stated above and considering the different types of flows generated between the cooperating companies, the supply chain risk is considered in this paper as an adverse effect on the flows between various elements of a supply network. Variability may affect the flow of information, goods/materials and/or financial resources. Therefore, the following risk assessment is based on three risk segments representing these flows within a supply network: a) The physical movement of materials and products from suppliers to customers is referred to as material flow. Even in a small and structured supply chain, there is a certain risk that the material is not provided on time, in the expected amount and quality at the designated place/company. Due to greater interconnectivity and the influence of the bullwhip-effect in supply networks, this risk increases exponentially. Additional risks to the material flow in supply networks are related to global sourcing. The extensive application of this sourcing strategy leads to significantly longer transport distances and times and consequently to a greater susceptibility of the entire network to unforeseen events, such as political crises, terrorist attacks or natural disasters. Other elements of material flow risk that need to
- 28. be considered are single sourcing risk, sourcing flexibility risk, supply capacity risk, supply selection and outsourcing risk, production risk, operational disruption, demand volatility, etc. [15] b) Financial impacts of variations and/or disruptions in the material flow consist of lost turnover, increased cost due to higher inventories, penalties, and lower cash flows. Besides these derivative monetary effects, one major financial flow risk is the exchange rate risk. In global supply networks, exchange rates have a significant influence on companies’ after-tax profit, supplier selection, market development, and other operational decisions. [15] Price and cost risks may also arise from the scarcity of raw materials or fluctuations on international commodity markets. [16] Another major element of the financial flow risk is the financial strength of network partners. The financial weakness of a network member may easily affect the entire supply network not only in terms of financial but also of material flows. [15] c) The high complexity and dynamics of global supply networks require multiple information flows in parallel to the material and financial flows. These information flows are not only needed for the collaborative organization and coordination of the network in day-to-day operations, but also for having the necessary strategies for managing risks and disruptions. Information technology is
- 29. widely perceived as an important facilitator in the collaborative (risk) management of supply networks. [17] Therefore, the information accuracy risk is a major threat to the information flow as it hinders or prevents the prompt interchange of relevant information among network partners. Considering the current state in business practice, this risk is still present because a variety of information systems and the current information technology operated by supply networks often negatively affect interoperability and information flows. [18] Another element of the information flow risk is the information system security and disruption, which may be caused by the lack of professional IT-management, hackers, or natural disasters. [15] TRANSACTIONS OF FAMENA XLIII-2 (2019) 75 C. Bischof, D. Wilfinger Big Data-Enhanced Risk Management Due to a high degree of integration and interdependency, every stage or process within a supply network carries an inherent risk potentially affecting the entire collaboration. Hence, a comprehensive risk management framework is required. The objectives of such risk management are to identify possible risk sources within and outside the supply network and to develop appropriate action plans. Therefore, the risk management cycle consisting of three
- 30. different stages is applied in this study in order to keep the influencing risks on a low level. Risk Identification and Monitoring Risk Assessment Risk Mitigation and Prevention Fig. 1 Risk management cycle a) Risk Identification and Monitoring: This initial stage of the risk management process identifies risks and their potential causes. Common risks together with extra risks have to be determined. Hence, the main focus of risk identification is to recognize future uncertainties to enable proactive management of risk-related issues. Risk factors, such as suppliers, countries, and transportation systems, are monitored and evaluated by various key performance indicators (KPIs). The level of an in- stock inventory, production throughput, capacity utilization, and delivery lead times are some of the KPIs that can be applied to identify an abnormal situation that may involve a potential risk. If there is a significant deviation from the standard in a KPI, the alarm is triggered, establishing an early-warning-system. [17, 19] b) Risk Assessment: After identification, an assessment is
- 31. required in order to prioritize risks and take specific management actions. Probability of occurrence, risk level and risk impact are criteria that are widely used for differentiating risk. Consequently, the use of probability functions and historical data is necessary. Due to a relative lack of data (data are often available for risks such as currency rate and lead time but are usually rare and insufficient for events like earthquakes and terrorism), risk assessment can be rather difficult. Moreover, risk impact is usually expressed in terms of cost, but performance loss, physical loss, psychological loss, social loss, and time delay also have a significant impact on the company and therefore on the supply network. [20] c) Risk Mitigation and Prevention: Based on the data collected and assessed in the previous stages, risk mitigation aims at the elimination of identified risks or the reduction in the degree of their probability of occurrence and/or their impact. For this purpose, risk mitigation strategies are implemented by adopting two conventional approaches. In the reactive approach, no action is taken before the risk has materialised but there is a strategy in place to lower the impact. In this strategy, no plan to reduce the probability of occurrence is considered. In the proactive approach, strategies are implemented to mitigate the risks before they materialise. Proactive mitigation plans are implemented in order to decrease
- 32. the probability of occurrence rather than to reduce a potential impact of a materialised risk. [20] 76 TRANSACTIONS OF FAMENA XLIII-2 (2019) Big Data-Enhanced Risk Management C. Bischof, D. Wilfinger Applying Big Data to traditional risk management approaches may result in potential enhancements of the process and consequently in a significant reduction in the level of the overall risk to the entire supply network. 5. The Concept of Big Data Although there is no universally accepted definition, a common understanding of Big Data has been established in science and practice. This understanding is based on the major characteristics of Big Data – the four V’s. [21] data volumes in the range of gigabytes and terabytes can be processed. As the range will continue to increase, the data unit of a petabyte will be widely available in the foreseeable future. forms, ranging from machine data to relationship data. This data can be structured, partly structured or
- 33. completely unstructured and can be generated by internal as well as external data sources. -time acquisition, transformation, processing and analysis of streaming data generated by sensors and embedded systems or data coming from the web. This can be obtained by applying in-memory computing. depends, for instance, on the quality of data collection and secure transmission channels. Thus, Big Data is able to combine different data sources and various types of structured and unstructured data. Additionally, it allows for the analysis of large amounts of data in real time, which has not yet been possible. 6. Big Data-Enhanced Risk Management Framework In order to assess the potential implications and benefits of Big Data for the risk management in supply networks, a methodological framework needs to be developed. For this purpose, a three-dimensional approach will be applied covering the two major aspects of risk management in supply networks: the type of risks as one dimension and the phases of the risk management cycle as the other. Additionally, a third dimension is to be introduced addressing the major technologies in the area of Big Data (Fig. 2).
- 34. Fig. 2 Big Data-enhanced risk management framework TRANSACTIONS OF FAMENA XLIII-2 (2019) 77 C. Bischof, D. Wilfinger Big Data-Enhanced Risk Management The main technologies that are discussed extensively in the context of Big Data are in- memory computing, advanced analytics, the Internet of Things, and blockchain. -memory computing is an approach where data is no longer stored on hard disks but constantly provided in the random-access memory of information systems. This allows more rapid access to this data and its real-time processing. [22] - memory platforms aiming at integrating and analysing large amounts of various data coming from different internal and external sources. Thus, advanced analytics allows constant monitoring of relevant data sources leading to an event-triggered analysis and timely reactions to internally and externally induced variations in the material, financial, and information flows. Additionally, advanced analytics can be utilised to predict future developments and risks by a statistical analysis of historical data. [23]
- 35. ) is a new paradigm which can be defined as a dynamic global network infrastructure consisting of a variety of devices or things such as RFID tags, sensors, mobile phones, and actuators, which are able to interact with each other through addressing schemes and self-configuring capabilities or collaborate with their neighbours to reach common goals. [24, 25] In the context of supply networks, this concept not only increases transparency but also allows for innovative, decentralised planning and coordination approaches for global material flows. -related risks is the blockchain technology as it constitutes the foundation of trust-free economic transactions based on its unique technological characteristics. [26] This innovative technology refers to a distributed database for capturing and storing a consistent and immutable event log of transactions between network actors. In a supply network, all actors have access to the history of transactions. As the current blockchain technology not only processes financial transactions but can also ensure compliance of transactions with programmable rules in the form of smart contracts, a high potential for risk prevention in supply networks may be assumed. [27] The following discussion of the impacts of these technologies on the risk management
- 36. in supply networks and their benefits follows the phases of the risk management cycle. Based on these phases and considering the different types of risks in supply networks, selected application examples are discussed in detail. Risk Identification and Monitoring Identification and monitoring of material flow risk can be enhanced by using sensors, RFID tags and embedded systems in order to continuously track materials and products within the supply network. Additionally, data from external service providers like insurance companies need to be integrated because external events, such as political unrests, disasters or strike calls, may significantly disturb or even disrupt the material flow in global supply networks. These sources generate a vast amount of streaming data that needs to be monitored, processed and shared in real time throughout the supply network. This can be achieved by utilising in-memory computing systems that are capable of constant monitoring of data streams based on certain rules or even complex algorithms. In case of an exception, an alert can be issued or certain processes within the supply network can be initiated. [28] 78 TRANSACTIONS OF FAMENA XLIII-2 (2019) Big Data-Enhanced Risk Management C. Bischof, D. Wilfinger
- 37. Financial flow risk may be divided into a systematic and an unsystematic risk. The systematic financial flow risk is driven by generic external factors outside the network (e.g. economic fluctuations and crisis). Thus, monitoring this risk requires the consideration of external data coming from different sources like financial markets, banks, and rating agencies. Due to the fluctuating dynamics of systematic financial flow risk, a fast identification of relevant risks is crucial, requiring processing of this data in real time. Unsystematic financial flow risk refers to the partners engaged within the supply networks. Changes in their financial stability and performance need to be detected early by monitoring data coming from credit rating agencies but also additional data, e.g. the data from social media. By implementing statistical algorithms, early warnings on the financial perspective can be generated. [29] Information flow risk threatens the key capability of a supply network to deliver the relevant information to respective decision makers on time due to delayed or disrupted data transmission. An early detection of missing or distorted data may be achieved by using in- memory-based streaming analytics. Data streams coming from different sources inside and outside the networks are processed and verified in real time based on rules or concepts such as machine-learning. [30] Risk Assessment
- 38. Traditional approaches and IT-systems cannot be used in in the suggested enhanced risk management framework due to the volume, variety and velocity of data that needs to be considered. Rather, innovative Big Data technologies need to be implemented in order to increase effectiveness and efficiency of risk management in supply networks by calculating automatically the probability of occurrence, the impact and the level of risks. This is achieved by combining data-oriented stochastic approaches and deterministic models. The stochastic prediction is based on data acquired from various internal and external sources by applying statistical and mathematical algorithms in order to assess the risk probability. These results are then processed in a driver- oriented model that calculates the impact of the risk on certain key performance indicators, such as delivery time, credit score, and return on investment, based on defined cause-effect chains. This leads to a comprehensive risk level assessment. [31] By applying in-memory computing, processing of data streams can be automated and executed in real time. This allows immediate reactions to identified high-level risks. Additionally, a sensitivity and what-if analysis can be carried out leading to a more thorough and in-depth risk assessment. Risk Mitigation and Prevention
- 39. After having identified and assessed potential risks in the supply network, Big Data can help to eliminate or reduce the probability of occurrence and/or the impact of an identified risk. In-memory computing significantly reduces a material flow risk by enabling the fast execution of the Manufacturing Resource Planning (MRP) process. Previously, the necessary calculations and process steps had to be done using batch processing in an enterprise resource planning system or an advanced planning system. With the application of in-memory computing, the MRP run can be triggered without time delays, potential material flow risks coming from e.g. a changing sales forecast; in addition, irregularities or interruptions in the material flow can be better managed. [32] Mobile devices together with advanced analytics TRANSACTIONS OF FAMENA XLIII-2 (2019) 79 C. Bischof, D. Wilfinger Big Data-Enhanced Risk Management allow timely recognition of disturbances or disruptions in the logistics chain and consequently preventive or corrective actions to secure supplies, e.g. by redirecting transport flows. Thus, rapid reactions to deviations or failures in every single stage of the supply chain are possible. [15]
- 40. Advanced analytics can also help mitigate or prevent a financial flow risk as it uses statistical methods and machine-learning techniques to support decisions on accepting or rejecting a customer or a partner, increasing or decreasing the loan value, interest rate or term. The speed and accuracy of decisions represent a major benefit of innovative approaches to the management of financial flow risk. Additionally, these approaches and techniques can also be used for automated risk mitigation actions like forward exchange transactions. Mitigation and prevention of information flow risk can be achieved by using IoT-based standard services. Other than traditional interfaces, these standard services and protocols allow the flexible integration of different IT-systems within the supply network. By combining the IoT services with in-memory systems, information can be shared in real time among all relevant partners. Real-time monitoring of the data flows within the network allows us to prevent and mitigate information flow risk. Security aspects, such as unauthorized access and manipulation of data within the network, can be addressed with the application of blockchain technology. Typical use cases for this technology are smart contracts which use computerised transaction protocols that execute the terms of a contract. With this type of technology, common contractual conditions and minimized exceptions, both malicious and accidental, can be achieved without the support of trusted intermediaries. As no human interaction is
- 41. needed, the information flow risk can be significantly reduced. Other benefits of this technology are the reduction in fraud losses, arbitration and enforcement costs and other transaction costs. [33, 34] Incorporating these use cases and potential benefits into the theoretical framework results in a comprehensive and detailed picture of how Big Data technologies can be applied in order to enhance risk management in supply networks: Fig. 3 Use cases for Big Data-enhanced risk management 80 TRANSACTIONS OF FAMENA XLIII-2 (2019) Big Data-Enhanced Risk Management C. Bischof, D. Wilfinger 7. Factors Influencing the Use of Big Data Technologies Having discussed potential benefits of Big Data technologies in the area of risk management, factors that may influence or challenge the application of these technologies also need to be considered. Although the nature and extent of these factors are highly specific to the respective use case, some general aspects are discussed below as they are relevant for the implementation in business practice. a) Big Data usually leads to a massive and continuous data flow. However, the purpose
- 42. of Big Data-enhanced risk management is not to end up with the largest mass of data. Rather, it aims at utilizing data to improve and accelerate decisions as well as processes in the entire risk management cycle. Therefore, the company-specific objectives for Big Data-enhanced risk management have to be defined first. Subsequently, concrete use cases need to be derived which then determine the analytical requirements such as the amount and type of data and consequently, the required data sources. Also, technical aspects like data storage or questions like how often data should be loaded or whether it is necessary to have all data available in real time can be addressed adequately. [35] b) Additionally, achieving and maintaining the quality of required data is becoming a constant challenge. This applies especially to external data which can be incorrect, inconsistent, redundant, distorted or biased. Traditionally, many companies have tried to improve data quality by establishing a golden record representing a single source of truth. However, most of the time this is too difficult or time-consuming in a Big Data environment. Thus, companies need to apply the notion of “fit for purpose” as the overarching principle with regards to data quality. Based on this principle, they can determine which data quality processes to run and whether to apply processes for data validation, enhancement or enrichment as well as the tools
- 43. used in these processes (e.g. statistical methods or artificial intelligence techniques). [36] c) Big Data-enhanced risk management potentially involves hundreds of variables and parameters. Incorporating all data into the driver-oriented predictive models for assessment, mitigation and prevention of risk would lead to overfitting and result in a bad prediction performance. A possible solution consists of applying sensitivity analysis in order to evaluate the susceptibility of the applied models and the resulting key performance indicators to changes in input parameters. Based on the results of the sensitivity analysis, the weighting factor for the most influential parameters is increased while irrelevant data is removed from the models, resulting in gradually refined models, and consequently in an enhanced quality and accuracy of the generated predictions. [37] d) Costs are another factor influencing the successful application of the Big Data- enhanced risk management framework introduced in this paper. Today, the required technologies have reached a high degree of maturity and are commonly available at a constantly decreasing cost. Thus, the hardware and software components are no longer the main cost drivers. The major cost, however, is incurred by the operation and overall management or the integration of Big Data into an existing IT
- 44. ecosystem. [38] Big Data has to be considered as an investment, therefore a critical analysis of its benefits and corresponding costs is crucial. TRANSACTIONS OF FAMENA XLIII-2 (2019) 81 C. Bischof, D. Wilfinger Big Data-Enhanced Risk … RAE-Revista de Administração de Empresas (Journal of Business Management) 379 © RAE | São Paulo | 59(6) | November-December 2019 | 379-388 ISSN 0034-7590; eISSN 2178-938X ANTONIO CARLOS GASTAUD MAÇADA¹ [email protected] ORCID: 0000-0002-8849-0117 RAFAEL ALFONSO BRINKHUES² [email protected] ORCID: 0000-0002-9367-5829 JOSÉ CARLOS DA SILVA FREITAS JUNIOR³ [email protected] ORCID: 0000-0002-9050-1460 ¹Universidade Federal do Rio Grande do Sul, Escola de Administração, Porto Alegre, RS, Brazil
- 45. ²Instituto Federal de Educação, Ciência e Tecnologia do Rio Grande do Sul, Viamão, RS, Brazil ³Universidade do Vale do Rio dos Sinos, Escola de Gestão e Negócios, São Leopoldo, RS, Brazil FORUM Submitted 10.01.2018. Approved 07.19.2019 Evaluated through a double-blind review process. Guest Scientific Editors: Eduardo de Rezende Francisco, José Luiz Kugler, Soong Moon Kang, Ricardo Silva, and Peter Alexander Whigham Original version DOI: http://dx.doi.org/10.1590/S0034-759020190604 INFORMATION MANAGEMENT CAPABILITY AND BIG DATA STRATEGY IMPLEMENTATION Capacidade de gestão da informação e implementação de estratégia de Big Data Capacidad de gestión de la información e implementación de estrategia de Big Data ABSTRACT Firms are increasingly interested in developing Big Data strategies. However, the expectation of the value of these benefits and of the costs involved in acquiring or developing these solutions are not homogeneous for all firms, which generates competitive imperfections in the
- 46. market for strategic resources. Information Mana- gement Capability (IMC) aims to provide the required unique insights for successful Big Data strategies. This study analyzes IMC as an imperfection agent in the market for strategic Big Data resources. The hypotheses were tested using a survey of 101 respondents and analyzed with SEM-PLS. The results indicate the positive influence of IMC on value expectation and a negative effect on cost expectation. Cost expectation inversely affects the intent to purchase or develop the resources to implement Big Data strategies. Value expectation has a positive effect on both intents. KEYWORDS | Big Data, information management, strategic factor market, value expectation, cost expectation. RESUMO O interesse das organizações em desenvolver estratégias de Big Data está aumentando significativamente. No entanto, a expectativa do valor desses benefícios e dos custos envolvidos na aquisição ou desenvolvimento dessas soluções não é homogênea para todas as empresas, gerando imperfeições competitivas no mercado de recursos estratégicos. A Capacidade de Gestãoda Informação (CGI) tem como premissa fornecer as informa- ções necessárias para que as estratégias de Big Data sejam bem- sucedidas. Este artigo se propõe a analisar o CGI como um agente imperfeito no Strategic Factor Market de Big Data. As hipóteses foram testadas a partir de uma pesquisa de 101 respondentes e analisadas com a utilização de SEM-PLS. Os resultados indicam uma influência IMC positiva na expectativa de valor e uma negativa na expectativa de custo. A expectativa de custo afeta inversamente a intenção de comprar ou desenvolver os recursos para implantar estratégias de Big Data. A expectativa de valor tem um efeito positivo em ambas as intenções.
- 47. PALAVRAS-CHAVE | Big Data, gestão da informação, strategic factor market, expectativa de valor, expectativa de custo. RESUMEN El interés de las organizaciones en el desarrollo de estrategias de Big Data está aumentando significativa- mente. Sin embargo, la expectativa del valor de los beneficios y de los costos implicados en el acreedor o el desarrollo de estas soluciones no es homogénea para todas las empresas, impugnando las imperfecciones en el mercado de los recursos estratégicos. Capacidad de Gestión de la Información (CGI) utiliza las premisas proporcionar las pruebas requeridas para el éxito de Big Data, este artículo tiene como objetivo analizar el CGI como un agente de imperfección en el Strategic Factor Market de Big Data. Las hipótesis se probaron de una encuesta de 101 respondedores y se analizaron con SEM-PLS. Los resultados indican la positiva influencia de CGI sobre la expectativa y una negativa en una expectativa de los costos. La expectativa de los costos inversa- mente afecta al intento de comprar o de desarrollar los recursos para implementar estrategias Big Data. La expectativa de valor tiene un efecto positivo en ambos intents. PALABRAS-CLAVES | Big Data, information management, strategic factor market, expectativa de valor, expecta- tiva de los costos. mailto:[email protected] mailto:[email protected] FORUM | INFORMATION MANAGEMENT CAPABILITY AND BIG DATA STRATEGY IMPLEMENTATION Antonio Carlos Gastaud Maçada | Rafael Alfonso Brinkhues |
- 48. José Carlos da Silva Freitas Junior 380 © RAE | São Paulo | 59(6) | November-December 2019 | 379-388 ISSN 0034-7590; eISSN 2178-938X INTRODUCTION “Big Data is possibly the most significant ‘tech’ disruption in business and academic ecosystems since the meteoric rise of the Internet and the digital economy” (Agarwal & Dhar, 2014, p. 443). Diverse forms of data that do not generate value do not contribute to an organization. Data value is, thus, driving increasing interest in big data (Chiang, Grover, Liang, & Zhang, 2018). Researchers and technology vendors recognize the benefits of adopting big data analytics in business practices (Wang, Kung, Wang, & Cegielski, 2018). Firms are increasingly interested in developing Big Data strategies (Tabesh, Mousavindin, & Hasani, 2019). The percentage of firms that already invest or plan to invest in Big Data grew from 64 percent in 2013 (Gartner, 2014) to 73 percent (Davenport & Bean, 2018). “Organizations are currently looking to adopt Big Data technology, but are uncertain of the benefits it may bring to the organization and concerned with the implementation costs” (Lakoju & Serrano, 2017, p. 1). The volume of investments is growing at an even greater rate. The Big Data technology and services market will grow at an 11.9 percent compound annual
- 49. growth rate (CAGR) to 260 billion dollars through 2022 (IDC, 2018). The expected organizational impacts are many, and include cost reductions, an increase in business insights, revelations of strategic information, and improved decision making (Kwon, Lee, & Shin, 2014). However, the expected value of these benefits and the costs involved to acquire and develop these solutions are not homogeneous for every firm, which generates competitive imperfections in the market for strategic resources. According to strategic factor market (SFM) theory, firms need to be consistently more informed than are other firms that aim to implement the same strategy to obtain superior performance (Barney, 1986). The author affirms that analyzing the firm’s capabilities can create these circumstances more so than the competitive environment. We argue that information management capability (IMC) can bring the unique insight required for successful Big Data strategies. We define IMC as the firm's ability to access data and information from internal and external environments, to map and distribute data for processing, and to allow the firm to adjust to meet the market needs and directions. The literature indicates that IMC positively influences a firm’s performance directly (Carmichael, Palácios-Marques, & Gil-Pichuan, 2011) or is mediated by other organizational capabilities (Mithas, Ramasubbu, & Sambamurthy, 2011). There is no evidence that a firm’s current IMC can accommodate
- 50. the sharp growth in the flow of unstructured data (White, 2012). However, IMC can have a relevant role in the expectations for and intent to implement a strategy to deal with Big Data. Many practitioners are seeking such opportunities due to easy access to computational capabilities and analytical software (Agarwal & Dhar, 2014). On the other hand, 43 percent of directors refer to budget deficits as the main barrier delaying the actions to take advantage of this context (Mckendrick, 2013). This indicates symmetry in the cost expectation of the resources for a Big Data strategy. From an academic standpoint, many studies investigate this phenomenon, especially in Information Systems (IS) in terms of analyzing the value creation from these data (e.g., Brown, Chui, & Manyika, 2011; Davenport, Barth & Bean, 2012; Johnson, 2012; McAfee & Brynjolfsson 2012, Lakoju & Serrano, 2017). Nevertheless, few works focus on the relationship between IMC and Big Data in order to obtain this value (Brinkhues, Maçada, & Casalinho, 2014; Mohanty, Jagadeesh, & Srivatsa, 2013). “The current literature on big data value realization is characterized by a limited number of empirical studies and some repackaging of old ideas” (Günther, Rezazade Mehrizi, Huysman, & Feldberg, 2017). This study aims to determine how the variation in the level of IMC among the firms creates competitive imperfections in the
- 51. resources market for the implementation of Big Data strategies. To cover this research gap, we propose a scale to measure IMC and conceptually develop a research model to evaluate the relationship between IMC and the implementation of Big Data strategy empirically. This model, based on SFM theory, specifically investigates the influence of IMC on the value and cost expectations of the resources needed for this implementation, and based on transaction cost theory, the effect of these expectations on the intent to acquire or develop these resources. We constructed the scale following the literature and collect data from executives via card sorting. We tested the research model through a survey of 101 directors and analyze the data utilizing SEM-PLS. This article proceeds as follows. The next section develops the hypotheses and presents the research model. The following section details the procedures to construct the IMC scale and for data collection. We present and discuss the results thereafter, and finally offer our conclusions and implications for research and managerial practice. INFORMATION MANAGEMENT CAPABILITY (IMC) AND THE STRATEGIC FACTOR MARKET (SFM) “Strategic Factor Markets (SFM) are markets where the necessary resources for implementation of a strategy are acquired”
- 52. (Barney 1986, p. 1231); thus, firms can only extract superior performance when SFM is imperfect due to the differences in the expectation of FORUM | INFORMATION MANAGEMENT CAPABILITY AND BIG DATA STRATEGY IMPLEMENTATION Antonio Carlos Gastaud Maçada | Rafael Alfonso Brinkhues | José Carlos da Silva Freitas Junior 381 © RAE | São Paulo | 59(6) | November-December 2019 | 379-388 ISSN 0034-7590; eISSN 2178-938X the future value of these strategic resources. In other words, firms must be able to exploit a larger value of the necessary resources for its strategic implementation rather than the costs to acquire them being significantly less than their economic value. "The goal of big data programs should be to provide enough value to justify their continuation while exploring new capabilities and insights" (Mithas, Lee, Earley, Murugesan, & Djavanshir, 2013, p. 18). To obtain this advantage, firms need to be consistently better informed than the other firms acting in the same SFM (Barney, 1986). IMC can serve as leverage in this advantage. Mithas et al. (2011) propose the IMC construct to develop a conceptual model linking it with three other organizational capabilities (customer management, process management, and performance management). Their results show that these management capabilities mediate the positive influence of IMC
- 53. on the firm’s performance. Mithas et al.'s (2011) IMC concept consists of three abilities: to provide data and information to users with appropriate levels of accuracy, timeliness, reliability, security, and confidentiality; to provide connectivity and universal access at an adequate scope and scale; and to adapt the infrastructure to the emerging needs and directions of the market. Carmichael et al. (2011) define IMC as a second-order construct composed of the compilation and production of information; access to information; and the identification of information distribution requirements. Another author, Phadtare (2011), proposes that IMC is linked to five factors: acquisition and retention, processing and synthesis, recovery and use, transmission and dissemination, and support system and integration. Based on the three works above (Mithas et al., 2011; Phadtare, 2011; Carmichael et al., 2011), we identify five dimensions of IMC (access, distribution, people, architecture, and infrastructure). Then, as we explain in detail in the next sections, we perform a card sorting analysis with executives, which pointed to a 10-item scale of these dimensions. From this analysis, we formulated a definition of IMC and applied in this study as corresponding to the firm’s set of skills that articulate information infrastructure, the architecture of information, and access to information, which enable organizational adjustment in response to changes imposed by internal and external environments. Thus,
- 54. we expect that organizations with more developed IMC are more accurate in their expectations of value and can take advantage of the asymmetry of information in the SFM, from which competitive imperfections in SFM derive. Additionally, we expect that companies that developed IMC at a higher level during one of the previous eras of IM – Decision Support, Executive Support, Online Analytical Processing, and Business Intelligence and Analytics (Davenport, 2014) – have a higher value expectation of the next frontier of Big Data. We predict this result because the development of IMC at an elevated level positively impacts organizational performance (Carmichael et al., 2011; Mithas et al., 2011), which favors a polarizing effect of perceptions between past and present (Vasconcelos, Mascarenhas, & Vasconcelos, 2006). Big Data strategy is a set of solutions based on recent advances in Big Data analytics. Organizations seek to incorporate these solutions in their own decision-making processes successfully (Tabesh et al., 2019). Hence, these firms have a greater expectation of value from Big Data strategies based on their positive experiences with prior IM investments. Conversely, firms that did not reach the same level of IMC may not have had the same success in their ventures in IM, and this negative experience may reflect in a greater expectation of the cost to adopt this type of
- 55. strategy. H1: Firms with more elevated IMC have a lower cost expectation to implement a Big Data strategy. H2: Firms with more elevated IMC have greater expectations of value extraction from implementing a Big Data strategy. Asymmetric value expectation and intent to purchase/develop Big Data strategy capabilities Prior studies also demonstrate the positive effect of using data for the purpose of acquiring Big Data solutions (Kwon et al., 2014). However, firms can also develop the resources and capabilities to implement a Big Data strategy internally. Organizations exist to realize internal transactions more efficiently than it is to do so in the market (Coase, 1937). Accordingly, firms that do not arrange their resources to reach their objectives more efficiently than the market lose their reason to exist. Thereby, the search for the necessary resources to implement a Big Data strategy can go down two paths: to develop them internally or to acquire them in the market. Organizations can develop the necessary capabilities internally for this implementation if they are efficient in rearranging the resources involved. However, if the cost to acquire such funds in the market is less than the value to produce them internally, then firms tend to acquire them. Transactions costs are the consequence of the asymmetrical and incomplete distribution of information among the organizations
- 56. involved in the exchange (Cordella, 2006). The emergence of various suppliers with solutions to manage Big Data leaves uncertainty about what value firms can exploit from these resources. Thus, the decision to buy or develop the factors necessary to implement a Big Data strategy is also affected by the differences in the asymmetrical expectations of value that the firm can extract from this investment. We expect that different levels of expectations positively influence FORUM | INFORMATION MANAGEMENT CAPABILITY AND BIG DATA STRATEGY IMPLEMENTATION Antonio Carlos Gastaud Maçada | Rafael Alfonso Brinkhues | José Carlos da Silva Freitas Junior 382 © RAE | São Paulo | 59(6) | November-December 2019 | 379-388 ISSN 0034-7590; eISSN 2178-938X both decisions, whether to purchase or internally develop the resources to extract value from Big Data. H3a: Firms with greater value extraction expectations of Big Data strategies have a higher purchase intent for these solutions. H3b: Firms with greater value extraction expectations of Big Data have a higher intent to develop these solutions internally. Asymmetric cost expectation and intent to
- 57. purchase or develop Big Data strategy capabilities Resources such as million instructions per second (MIPS) and terabytes of storage for structured data are less expensive through Big Data technologies than through traditional technologies (Davenport, 2014). However, the costs of other less tangible resources may be more difficult to predict. For instance, transaction costs frequently increase when adopting an IS solution. However, firms can reduce these costs when the costs associated with adoption do not exceed the external costs that affect adoption (Cordella, 2006). Just as we expect to see companies with better developed IMC to have a lower expectation of the costs necessary to employ a Big Data strategy, it is also likely that this prediction of reduced costs favors a greater predisposition toward implementation. Additionally, with a more accurate cost expectation, companies with an elevated IMC level can create an adequate strategy within their budgets. We also expect the opposite effect: firms with less developed IMC will tend to have less exact cost predictions and therefore greater uncertainty when deciding whether to buy or develop resources to implement a Big Data strategy. H4a: Firms with greater expectations of the costs to implement Big Data strategies have less purchase intent for these solutions. H4b: Firms with greater expectations of the cost to implement Big Data strategies have less intent to develop these solutions internally. Considering the four-hypothesis developed above, we built the Research Model. An illustrated presentation of this can be
- 58. seen in Figure 1. Figure 1. Research Model Cost expectation (CE) Strategic factor market theory Transaction cost economics Information management capability (IMC) Purchase intent (PI) Development intent (DI) Value expectation (VE) H1 H3a H3b H4b
- 59. H4a H2 RESEARCH METHODOLOGY We tested the hypotheses utilizing partial least squares structural equation modeling (PLS-SEM) based on survey data. PLS-SEM is frequently recommended for research in management because data in this field often do not adhere to a multi-varied normal distribution, while the models are complex and can still be informative. It is also recommended for smaller samples and models with less prior support (Ringle, Silva, & Bido, 2014; Hair, Hult, Ringle, & Sarstedt, 2013). In light of the involved variables and the nature of this research, we consider the use of this statistical technique appropriate for empirically testing the hypotheses of the conceptual model. However, we conducted a preliminary stage with a survey and Card Sorting analysis to propose a scale to measure IMC. We describe this stage in the next section, followed by the steps and details about the sample, data collection, and validation. FORUM | INFORMATION MANAGEMENT CAPABILITY AND BIG DATA STRATEGY IMPLEMENTATION Antonio Carlos Gastaud Maçada | Rafael Alfonso Brinkhues | José Carlos da Silva Freitas Junior 383 © RAE | São Paulo | 59(6) | November-December 2019 | 379-388 ISSN 0034-7590; eISSN 2178-938X
- 60. Card sorting to create an IMC scale We adapted a scale to measure IMC in the quantitative phase through a survey. This scale was based on existing research instruments (Carmichael et al., 2011; Mithas et al., 2011). The need to construct an IMC scale that could handle this new data environment did not influence the other variables, which already have tested scales. For the scale, we applied the Optimal Workshop tool to perform a Card Sorting with 10 IT executives. Each online participant took an average of seven minutes to complete. Based on the card sorting results, we reduced the scale from 20 items across five dimensions (people, distribution, access, infrastructure, and information architecture) to 10 items by analyzing a matrix in which we used the cut above 60 percent similarity. To evaluate the dimensions, we used a dendrogram analysis for the best merge method, which often outperforms the actual agreement method when a survey has fewer participants. It makes assumptions about more massive clusters based on individual pair relationships (Optimal WorkShop, 2017). The scores of the cut represent 40 percent of the participants who agree with parts of this grouping. Five dimensions emerged from the group of scale-items assessed by the executives, which were in turn selected from the existing literature. We collected this group through Card Sorting analysis and named them based on the gathered items (people, distribution, access, infrastructure, and information architecture) in line with the authors’ analysis of the results from the preliminary stage of the study. We thus developed the IMC scale for this study. We developed this scale because in-depth research about this construct (Mithas et al., 2011) was validated from an adaptation
- 61. from pre-existing secondary data, and to incorporate elements addressed in other works (Carmichael et al., 2011). The scales for the other variables of the research tool are adapted from the literature and modified as needed for this study. All items used a seven-point Likert scale (1-Strongly Disagree; 7 – Strongly Agree). We conducted the statistical analysis using the SmartPLS version 3.2.0 software package. Sample frame and data collection We collected data through an online research created using the Google Forms platform. Data were collected through social networks, primarily through specific discussion groups about the addressed subjects. Some 29,282 people saw the notices, 208 people clicked on them, and we received 114 completed forms. The answer rate was 59 percent. Among these, we eliminated 13 through three validation questions inserted in the questionnaire to help with data quality control, leaving us with a final sample of 101 forms. Thus, the sample exceeds the minimum of 68 cases, for a power of 0.8 and a medium effect size f2 of 0.15 (Hair et al., 2013) with the variables at a maximum number of two predictors. We calculated this minimum sample using the G*Power 3.1 tool (Faul, Erdfelder, Buchner, & Lang, 2009). The respondents were managers and executives in IT or other areas related to the implementation of IM strategies. Table 1 summarizes the profiles of the respondent firms, from which we can conclude that the sample is diversified and lightly
- 62. focused on industry and size, whether through the number of employees or invoicing. The two most apparent differences in the size variable appear in the first two rows. In the first row, there is a smaller percentage of firms invoicing up to one million dollars (16%), while the percentage of companies with up to 50 employees is 27 percent. In contrast, the second row presents a greater percentage of invoicing (23% from 1 to 6.7 million dollars) and a smaller number of employees. A possible explanation for these differences may be in the high number of technological jobs, which have a high profitability potential with fewer employees. There were significant differences in the results relating to industry or firm size. In using Finite Mixture PLS, we did not identify latent classes that evidence the presence of groups within a sample. Table 1. Respondent firms’ profiles Industry % Number of employees % Annual revenue % Technology 24% Up to 50 27% Up to 1 million dollars 16% Manufacturing 18% 51 - 100 13% 1 to 6.7 million dollars 23% Financial services 12% 101 - 500 11% 6.7 to 37.5 million dollars 14% Professional services 11% 501 - 1,000 16% 37.5 to 125 million dollars 12% Others 35% More than 1,000 33% More than 125 million dollars 36%
- 63. Note: n=101 FORUM | INFORMATION MANAGEMENT CAPABILITY AND BIG DATA STRATEGY IMPLEMENTATION Antonio Carlos Gastaud Maçada | Rafael Alfonso Brinkhues | José Carlos da Silva Freitas Junior 384 © RAE | São Paulo | 59(6) | November-December 2019 | 379-388 ISSN 0034-7590; eISSN 2178-938X RESULTS We first present an analysis of the results in terms of the measurement model, followed by an evaluation of the structural model. Evaluation of the measurement model We evaluated the measurement model through a series of reliability tests, including composite reliability (CR), Cronbach’s alpha, average variance extracted (AVE), and discriminant validity (Hair et al., 2013; Ringle et al., 2014). As Table 2 shows, following Fornell and Larcker’s (Henseler, Ringle, & Sinkovics, 2009) criteria, the model converges, and the result is satisfactory because the AVE is above 0.50 for all variables. Although the traditional indicator to evaluate internal consistency is Cronbach’s alpha, CR is the best for PLS-PM
- 64. because it is the least sensitive to the number of items in each construct (Ringle et al., 2014). In Table 2, we also see that all the variables present both indicators (Cronbach’s alpha and CR) above 0.7. Therefore, all the variables are considered adequate and satisfactory (Hair et al., 2013). Also in Table 2, we report the Fornell and Larcker (1981) criteria to verify the discriminant quality according to the correlating values between the variables. The results indicate no correlation between distinct variables greater than the square root of the AVE of each variable (highlighted in gray in the main diagonal). As the last criterion to evaluate the quality of the measurement model, we calculated discriminant validity utilizing a cross- loading analysis (Chin, 1998). In Table 3 we find no indicators with factor loadings below their variable than in others. Having attended to the quality criteria and discriminant validity of the model, we next evaluate the structural model in the next sub-section. Table 2. Quality Criteria Variables AVE Composite reliability Cronbach’s Alpha CE DI IMC PI VE Cost expectation 0.778 0.875 0.715 0.882 Development intent 0.698 0.874 0.784 -0.304 0.836 IMC 0.548 0.923 0.907 -0.407 0.258 0.740 Purchase intent 0.657 0.851 0.747 -0.405 0.735 0.300 0.811 Value expectation 0.819 0.901 0.780 -0.392 0.318 0.647 0.360 0.905 Mean 4,75 3,26 4,18 3,40 5,16 SD 1,64 1,87 1,64 1,92 1,67 Note: CE = Cost expectation; DI = Development intent; IMC =
- 65. Information management capability; PI = Purchase intent; VE = Value expectation. Table 3. Cross-Loadings Items x Variables IMC CE DI PI VE IMC1 0.585 -0.178 0.022 0.004 0.363 IMC2 0.757 -0.255 0.236 0.263 0.459 IMC3 0.784 -0.273 0.177 0.165 0.543 IMC4 0.823 -0.347 0.319 0.351 0.656 IMC5 0.817 -0.289 0.190 0.203 0.600 IMC6 0.697 -0.182 0.033 -0.048 0.349 IMC7 0.735 -0.265 0.308 0.480 0.486 IMC8 0.686 -0.293 0.107 0.286 0.425 IMC9 0.711 -0.417 0.125 0.191 0.337 IMC10 0.773 -0.455 0.259 0.186 0.452 CE1 -0.387 0.885 -0.299 -0.316 -0.390 CE2 -0.331 0.879 -0.237 -0.399 -0.301 DI1 0.253 -0.285 0.826 0.819 0.305 DI2 0.239 -0.204 0.892 0.588 0.253 DI3 0.145 -0.261 0.786 0.385 0.226 PI1 0.253 -0.285 0.826 0.819 0.305 PI2 0.249 -0.404 0.481 0.858 0.362 PI3 0.229 -0.269 0.517 0.751 0.166 VE1 0.557 -0.361 0.325 0.362 0.907 VE2 0.615 -0.349 0.250 0.289 0.903 FORUM | INFORMATION MANAGEMENT CAPABILITY AND BIG DATA STRATEGY IMPLEMENTATION Antonio Carlos Gastaud Maçada | Rafael Alfonso Brinkhues | José Carlos da Silva Freitas Junior
- 66. 385 © RAE | São Paulo | 59(6) | November-December 2019 | 379-388 ISSN 0034-7590; eISSN 2178-938X Evaluation of the structural model To test the hypotheses and the predictive power of the model, we calculated Pearson’s coefficients of determination (R2), the effect size (f2), predictive validity (Q2), and path coefficient (r). According to Cohen’s (1988) criteria, we can verify a medium effect of the model on the cost expectation (CE) (0.166) and development intent (DI) (0.139) variables, … Executive Program Practical Connection Assignment Infotech in a Global Economy Provide a reflection of at least 500 words (or 2 pages double spaced) of how the knowledge, skills, or theories of this course have been applied, or could be applied, in a practical manner to your current work environment. If you are not currently working, share times when you have or could observe these theories and knowledge could be applied to an employment opportunity in your field of study. Requirements: Provide a 500 word (or 2 pages double spaced) minimum reflection. Use of proper APA formatting and citations. If supporting evidence from outside resources is used those must be properly cited. Share a personal connection that identifies specific knowledge and theories from this course. Demonstrate a connection to your current work environment. If you are not employed, demonstrate a connection to your desired work environment.
- 67. You should NOT, provide an overview of the assignments assigned in the course. The assignment asks that you reflect how the knowledge and skills obtained through meeting course objectives were applied or could be applied in the workplace. Reference TextBook: Bashir, I. (2017). Mastering Blockchain. Birmingham, UK: Packt Publishing. (UC Library) • Kressel, H., & Lento, T. V. (2012). Entrepreneurship in the Global Economy : Engine for Economic Growth. Cambridge, UK: Cambridge University Press. (Included through library subscription) • Medina, C. (2016). Federal Cybersecurity : Strategy and Implementation for Research and Development. New York: Nova Science Publishers, Inc. (Included through library subscription) • Olsen, S., & National Academy of Engineering (U.S.). (2011). Global Technology : Changes and Implications: Summary of a Forum. Washington, D.C.: National Academies Press. (UC Library) Discussion II – Big Data - Infotech in a Global Economy The rising importance of big-data computing stems from advances in many different technologies. Some of these include: Sensors Computer networks Data storage Cluster computer systems
- 68. Cloud computing facilities Data analysis algorithms How does these technologies play a role in global computing and big data? Please make your initial post and two response posts substantive. A substantive post will do at least TWO of the following: · Ask an interesting, thoughtful question pertaining to the topic · Answer a question (in detail) posted by another student or the instructor · Provide extensive additional information on the topic · Explain, define, or analyze the topic in detail · Share an applicable personal experience · Provide an outside source (for example, an article from the UC Library) that applies to the topic, along with additional information about the topic or the source (please cite properly in APA) · Make an argument concerning the topic. At least one scholarly source should be used in the initial discussion thread. Be sure to use information from your readings and other sources from the UC Library. Use proper citations and references in your post. Discussion I - Chapter 10 Awareness Emerging threads and Counter measures How basic "situation awareness" can help tremendously with security countermeasures? Reference: Text book Attached