SlideShare a Scribd company logo
1 of 223
5A
Los Angeles is known for its smog, but air quality has improved
since the 1990’s and so have children’s lungs. The percent of
children with lung defects has decreased from 8 out of 100 in
1998 to 3.5 out of 100 in 2011 and is applauded as an
environmental success story (N Engl J Med 2015; 372:905-
913). For this forum, you are going to find, read and report on
a scientific, peer-reviewed research article. The topic is air
pollution’s effect on exercise and sports. For example, air
pollution was a big concern for the Olympics held in Beijing,
China and Rio, Brazil. What impact does it have on athletic
performance and health?
You are to find a scientific, peer-reviewed research article. The
best place is the library or PubMed. Do not report on a peer-
reviewed review paper on the topic. Remember, a review paper
summarizes several original research papers. You can use a
review to help you find a scientific study. Also, a research
study paper usually has the following sections: abstract,
introduction, methods, results, conclusions, figures and tables.
A review paper does not have these sections.
In your initial Forum post:
· list your selected article
· provide the reference for your chosen article
· describe the study and the results
· state what the study concludes
· evaluate the article. Do you think the study made appropriate
conclusions from its data? Was the study designed correctly to
address the hypothesis?
· Finally, provide your opinion on the matter. Be sure to justify
your position.
Rundell, Kenneth William. “Effect of Air Pollution on Athlete
Health and Performance.” British Journal of Sports Medicine
46.6 (2012): 407–412. Web.
Gryka, A et al. “Global Warming: Is Weight Loss a
Solution
?” International Journal of Obesity 36.3 (2012): 474–476. Web.
Raherison, C, and Filleul, L. “Asthma in Exercising Children
Exposed to Ozone.” The Lancet 360.9330 (2002): 411–411.
Web.
5b
This week we will have two topics in this forum. You will be
assigned one topic an then you are expected to respond to both
topics in your follow-up posts.
If your last name falls between these letters than your topic is:
· A-M: Topic 1, Qualitative, Quantitative and Mixed Methods
Studies
Topic 1: There are several different types of research data. We
divide these into qualitative, quantitative, and mixed methods.
For this forum, find one example of the study type you are
assigned. Tell the class the following:
· Complete reference of the paper
· The kind of study
· Why you feel it is that type of research
The study type you are assigned is based on the first letter of
your last name. Letter C ( Qualitative)
Study Type
First Letter of Your Last Name
Qualitative
A-D
Quantitative
E-H
Mixed Methods
I-M
Topic 2: There are many different types of study designs. Find
a study design that is one of these: case-controlled studies,
cohort study, randomized controlled trials, meta-analysis, or
case study.
Tell the class the following:
feel it is that type of research
Anguera, M Teresa et al. “The Specificity of Observational
Studies in Physical Activity and Sports Sciences: Moving
Forward in Mixed Methods Research and Proposals for
Achieving Quantitative and Qualitative Symmetry.” Frontiers in
psychology 8 (2017): 2196–2196. Web.
Lee, Sheng Yen. “Analysis of Relationship Marketing Factors
for Sports Centers with Mixed Methods Research.” Asia Pacific
Journal of Marketing and Logistics 30.1 (2018): 182–197. Web.
Review
Br J Sports Med 2012;46:407–412. doi:10.1136/bjsports-2011-
090823 407
ABSTRACT
Unfavourable effects on the respiratory and the cardio-
vascular systems from short-term and long-term
inhalation of air pollution are well documented. Exposure
to freshly generated mixed combustion emissions
such as those observed in proximity to roadways with
high volumes of traffi c and those from ice-resurfacing
equipment are of particular concern. This is because
there is a greater toxicity from freshly generated
whole exhaust than from its component parts. The
particles released from emissions are considered
to cause oxidative damage and infl ammation in the
airways and the vascular system, and may be related to
decreased exercise performance. However, few studies
have examined this aspect. Several papers describe
deleterious effects on health from chronic and acute air
pollution exposure. However, there has been no research
into the effects of long-term exposure to air pollution
on athletic performance and a paucity of studies that
describe the effects of acute exposure on exercise
performance. The current knowledge of exercising in the
high-pollution environment and the consequences that it
may have on athlete performance are reviewed.
Evidence supports unfavourable effects from short-
term and long-term inhalation of air pollution to
the respiratory and the cardiovascular systems.1–10
Combustion-related pollutants such as nitrogen
and sulphur oxides, the ammonium ion, organic
aerosols, particulate matter (PM) and ozone are
of concern. Inhaled PM can be causal to oxidative
stress-related airway and vascular injury. Although
there is ample evidence of short-term and long-term
exposure affecting the respiratory and the cardio-
vascular systems, little data are available demon-
strating the effects of air pollution inhalation on
athlete performance.10–12 During athlete training
and competition, lung deposition of emission-
related pollutants is high because of the increased
ventilation during exercise,13 14 and inhalation of
emission pollutants has been shown to cause the
release of infl ammatory mediators from airway
cells.15 16 Furthermore, the asthmatic response is
worsened by high emission pollution.17 This study
describes combustion-related pollutants that are
of concern to the athlete, examines adverse health
effects of inhaling airborne pollution during exer-
cise and presents current evidence that suggests
that athletic performance is compromised by inha-
lation of emission-related aerosols during exercise.
CATEGORIES OF PARTICULATE MATTER
Exposure to freshly generated mixed combustion
emissions such as those observed in proximity
to high volumes of traffi c is of particular concern
since evidence supports a greater toxicity from
the freshly generated whole exhaust than from its
component parts.15 Further, PM toxicity has been
shown to be related to particle surface area, num-
ber count and particle charge.18
Airborne PM is categorised by aerodynamic
diameter and includes the primary categories of
coarse, fi ne and ultrafi ne particles. Particles larger
than 10 μm are not considered harmful to airways
since they are primarily fi ltered at the nasopha-
ryngeal region. Coarse particles (PM10) include
those between 2.5 and 10 μm in diameter, fi ne
particles (PM2.5) are particles smaller than 2.5 μm
in diameter and ultrafi ne particles include those
less than 0.1 μm diameter.19 The establishment
of a separate category for particles less than 2.5
μm is based on research demonstrating that these
smaller particles are more toxic because of their
deeper penetration within the airways of the lung.
PM less than 1 μm in diameter (PM1) are recorded
in many studies, primarily because of portable
equipment limitations. This size range typically
includes particles in the 0.05 to 1 μm in diameter
and is a suitable representation of freshly gener-
ated particles. Although ultrafi ne PM (PM0.1),
are not yet recognised by the US Environmental
Protection Agency (EPA), they are considered
to be the most harmful.4 13 14 18 20 Ultrafi ne par-
ticle concentrations are high in freshly generated
exhaust and can penetrate deep within the lung,
but rapidly decrease in number count over time by
agglomeration and dispersion (fi gure 1).21
PM from freshly generated exhaust emissions are
likely to be the most toxic because they are high-
est in number count and surface area and are in the
particle size range of 50 to 100 nm (or about 1/1000
the diameter of a human hair) (fi gure 2). Fractional
deposition of these 50 to 100 nm particles occurs
in the alveolar region where exchange with the
circulation may occur. Although coarse and fi ne
particles are monitored by the EPA, most toxicol-
ogy research has investigated ultrafi ne particles
(PM0.1) and fi eld research has primarily measured
PM1. An increased deposition fraction (fraction of
inhaled particles remaining in the lungs after inha-
lation) of PM during exercise has been identifi ed,
with the largest deposition fraction noted for ultra-
fi ne particles. For example, the fractional deposi-
tion13 of PM0.1 is increased 4.5-fold during mild (38
l/min) exercise (fi gure 3).14 For PM2.5, it has been
estimated that 9% is deposited in the lungs with
6% reaching the alveolar region.22 Exercise appears
to increase the deleterious effects of PM inhalation
by deposition, while damaged airway epithelium
Correspondence to
Kenneth William Rundell,
Pharmaxis Inc, Medical
Affairs, One East Uwchlan
Ave, Suite 405, Exton,
Pennsylvania 19341, USA;
[email protected]
Received 1 December 2011
Accepted 11 December 2011
Published Online First
20 January 2012
Effect of air pollution on athlete health and
performance
Kenneth William Rundell
07_bjsports-2011-090823.indd 40707_bjsports-2011-
090823.indd 407 4/4/2012 4:24:00 PM4/4/2012 4:24:00 PM
Review
Br J Sports Med 2012;46:407–412. doi:10.1136/bjsports-2011-
090823408
from mechanical stress of high ventilation may enhance par-
ticle infi ltration to the circulatory system.
PM toxicology
The precise toxicological mechanism(s) of inhaled PM has not
been established; however, oxidative stress from exposure is
likely involved. It is thought that inhalation of emission pollut-
ants causes a release of infl ammatory mediators from airway
cells that then enter the circulatory system, causing increased
systemic oxidative stress. A decrease in lung antioxidants from
in vitro carbon black exposure has been identifi ed and suggests
that the epithelial lining fl uid-PM interface may represent an
important initial PM detoxifying step.23 This could be critical
to the exercising athlete as it is known that there is transient
loss
of airway surface liquid from high ventilation of dry air, mak-
ing airway cells more vulnerable to effects of air pollutants. An
acute twofold increase in lung antioxidants of rats exposed to
diesel exhaust PM has been identifi ed,24 suggesting a
protective
role against PM-induced oxidative stress for lung antioxidants.
As a consequence to exercise in high emission pollutants, a
44% decrease in total nitrate and a 40% increase in malondi-
aldehyde in exhaled breath condensate were found, support-
ing formation of the powerful oxidant, peroxynitrite9 from the
reaction of nitric oxide (NO) and superoxide. Alternatively, NO
reacts with glutathione in the lung to form a potent airway
bronchodilator, S-nitrosoglutathione (GSNO).25–27
Studies have shown that reduced GSNO in the asthmatic
airways could support increased leukotriene (LT) production,
while high levels could inhibit LT production.28 Since a pre-
dominantly LT-mediated bronchoconstriction after exercise in
high PM has been shown,29 and marked glutathione depletion
(to ~20% of pre-exposure levels)24 occurs in lung epithelial lin-
ing fl uid after particle exposure, GSNO depletion may be, in
part, responsible for PM-induced LT production.
If present in training and competition environments, freshly
generated particles are of specifi c concern to athletes, and are
likely to be related to the high prevalence of airway disease
among certain athletic populations. The prevalence of exer-
cise-induced bronchoconstriction (EIB), asthma and low rest-
ing lung function is high for athletes who train and compete in
a high PM-emission environments – far exceeding that of the
non-athlete and the low-pollutant-exposed athlete. Pollutants
from auto and truck emissions, high emissions from fossil-fu-
el-powered ice-rink resurfacers and ski-waxing fumes all nega-
tively affect the pulmonary and cardiovascular systems.
Potential consequences of inhaling pollutants during exer-
cise include decreased lung function, increased exacerbations
of asthma/EIB, decreased diffusion capacity, pulmonary
hypertension, cardiovascular effects and decreased perfor-
mance. McCreanor et al17 demonstrated the effect of a 2-h
walk while breathing high-PM/high-ozone air compared with
low-PM/low-ozone air on asthmatic airways. There was a
concurrent signifi cant decrease in forced vital capacity (FVC)
and forced expiratory volume in 1 s (FEV1) from the high-PM/
high-ozone exposure exercise, while lung function remained
unchanged from walking in low-PM/low-ozone air (fi gure 4).
An almost sixfold increase in sputum myeloperoxidase after
the high-PM walk was also observed, suggesting neutrophilic
infl ammation.
The high levels of PM1 observed at athletic fi elds and play-
grounds in close proximity to major highways (fi gure 1) can
affect pulmonary and vascular systems of healthy athletes.
Only 30 min exposure to high-PM (>60 000 particles/cm3)/
high-ozone (106 to 300 ppb) ambient air during exercise
Figure 1 Sixty-two days of particle counts on an athletic fi eld
within
50 m of a high-traffi c road. The x-axis is particle counts of
particles
<1 µm in diameter, those emitted from auto and truck
emissions.
Note that a rather rapid decay in number count is related to the
distance from the source. Redrawn.21
Figure 2 Size distribution in number count of freshly generated
emission particles. Note the largest number count is in the 50–
60-nm
size range.
Figure 3 Total particle deposition after 1-h rest and exercise
while breathing 25 g/m3 ultrafi ne carbon black particulate
matter.
Redrawn.14
07_bjsports-2011-090823.indd 40807_bjsports-2011-
090823.indd 408 4/4/2012 4:24:00 PM4/4/2012 4:24:00 PM
Review
Br J Sports Med 2012;46:407–412. doi:10.1136/bjsports-2011-
090823 409
20-min of exercise in freshly generated four-cycle exhaust
(PM0.1>300 000 particles • cm
−3, CO<5 ppm).
ATHLETE PM EXPOSURE
Ice-rink air is notoriously high in emission pollutants gener-
ated from combustion-powered ice resurfacers.31 There have
been numerous cases of NO2 and CO poisoning in ice rinks
from ice-resurfacer exhaust emissions. Along with high NO2
and CO, high particle counts from fossil-fuelled ice resurfacers
have been found.31 In one study, particle counts from rinks
resurfaced with electric-powered resurfacers and those resur-
faced with fossil-fuel-powered machines were compared.31
The particle counts in rinks using electric-powered resurfac-
ers were not different to the particle counts of the proximal
ambient air. Those rinks that were resurfaced by fossil-fuelled
machines, however, had particle counts ~30 times greater than
causes a small but signifi cant decrease in lung function in non-
asthmatics (fi gure 5).9
Inhalation of air pollution also has negative effects on the
vascular system. Thirty minutes of exercise in high-PM air
resulted in a basal vasoconstriction of the brachial artery,
disrupted normal vascular endothelial function, decreased
fl ow-mediated dilatation response and a 55% decrease in
re oxygenation of the muscle microcirculation.8 Arteriole dila-
tation was reported to be impaired after pulmonary exposure
to particles and myeloperoxidase was found on adhering neu-
trophils on the vascular endothelial wall.30 It was proposed
that this may affect the infl uence of NO on vascular tone
and that the decreased tissue perfusion of the microvascula-
ture from particle inhalation may compromise muscle func-
tion. Cutrufello et al10 noted an increase in pulmonary artery
pressure as well as disrupted fl ow-mediated dilatation after
Figure 4 Lung function of asthmatic subjects during and after a
2-hour walk in either low or high freshly generated diesel
emissions.
Redrawn.17
07_bjsports-2011-090823.indd 40907_bjsports-2011-
090823.indd 409 4/4/2012 4:24:01 PM4/4/2012 4:24:01 PM
Review
Br J Sports Med 2012;46:407–412. doi:10.1136/bjsports-2011-
090823410
FEV1, with little change in the FEV1/FVC ratio, is
characteristic
of early asthma development.
For the Nordic and alpine skier, ski-waxing fumes from
daily hot waxing provide a major contribution to exposure.
Many of today’s ski waxes are fl uorinated and have been
shown to have a negative effect on lung function.36 When
applied to skis, a hot iron is used; termed ‘hot waxing’. Hot
waxing results in ultrafi ne fl uorine particles being released
into the air in concentrations 25-fold higher than prewaxing.
Animal studies have shown that these fl uorine particles are
quite toxic.37 Although exposure does not occur during exer-
cise, it does occur on a daily basis beginning early in the skiers
career, when lungs are susceptible to damage. This repeated
exposure in combination with airway damage from high ven-
tilation of cold dry air during competition and training may
contribute to the airway dysfunction observed in Nordic ski-
ers. Of course, the elite skier spends little time in the wax
room, but young developing skiers do, since they wax their
own skis until reaching the elite level. Consequently, there
are many years of exposure to the developing lung on the path
to becoming an elite-level skier.
ATHLETE PERFORMANCE AND PM
Inhalation of high levels of combustion-derived PM during
exercise has been shown to result in reduced exercise perfor-
mance during short-term maximal-intensity cycle ergometry.10
12 A single 6-min exercise bout in high PM failed to reduce
exercise performance; however, a second 6-min of exercise in
high PM 3 days after the fi rst resulted in decreased exercise
performance. This observation supports a delayed infl am-
matory effect from the initial exercise.12 In a separate study,
decreased work accumulation was observed in a high-inten-
sity 6-min cycle ergometer ride that immediately followed
a 20-min high-PM exposure ride at 60% of estimated maxi-
mal heart rate,10 suggesting that a rapid response can occur
within a single 20-min exposure. In this study, low-PM (L)
and high-PM groups (H) were randomised, but L and H pairs
were exercised 1 day apart, to evaluate 24-h effect of exposure.
Unlike the previous study,12 these results showed decreases in
performance in both high-PM rides. This was thought to occur
because the 20-min prework accumulation ride allowed time
for a systemic infl ammatory response to occur, whereas the
earlier study12 did not incorporate that pretime trial 20-min
ride. The performance decreases from exercise in high emis-
sion-generated PM air observed in those studies were about
5%12 and 3%, respectively (fi gure 7).10 The implications of
these studies to the athlete competing in a high-air-pollution
environment suggest that even a 20-min warm-up in high air
pollution will have an impact on subsequent performance.
Further, only one 6-min bout of exercise in high pollution may
have a carryover effect that will decrease the performance in
exercise 3 days later.
Blunted fl ow-mediated dilatation from exercise in freshly
generated four-cycle emission aerosols has been observed
( fi gure 8A).10 12 Signifi cant increases in pulmonary artery
pres-
sure after high-pollution exercise were also noted (fi gure
8B).10
Vascular function was correlated with exercise performance
and accounted for as much as 24.4% of the decline in exercise
performance. The <5% performance decrements are quite sig-
nifi cant to the competing athlete. For example, all but the last
place fi nisher in the 3000-m steeplechase at the 2008 Olympics
were separated by less than 5%. These studies provide evi-
dence that high-PM conditions are likely to affect athletic
Figure 6 Measurements of PM1 at 10 ice rinks demonstrate
signifi cant increases in particulate matter (PM1) after rinks
were
resurfaced by fossil-fuelled machines. Rinks using electric-
powered
machines showed no increase in PM1. Redrawn.
6
Figure 5 Signifi cant change in lung function (forced expiratory
volume in 1 s (FEV1) and FEF25–75) of non-asthmatic subjects
after
30-min of high-particulate matter (PM1) exercise was identifi
ed. No
change in lung function was noted from low-PM1 exposure
exercise
(p=0.0005 for FEV1 and p=0.002 for FEF25–75). Redrawn.
9
proximal ambient air (fi gure 6). As a result of this study, the
Vancouver 2010 Olympic Games used electric-powered ice
resurfacers to ensure acceptable air quality at all 2010 Olympic
ice rinks.
Recent papers examining ice-rink air quality31 and the
relationship to EIB have associated the high prevalence of
airway dysfunction in skating athletes to inhalation of PM1.
6
7 The 20% to 43% prevalence of EIB reported in fi gure skat-
ers, hockey players and short-track-speed skaters32–34 is much
higher than the estimated 10% asthma prevalence in the US
and the reported prevalence for summer Olympic Games, ath-
letes.35 Repeated ventilation of cold/dry air during sport train-
ing and competition, combined with high levels of PM1, may
enhance the expression of or directly cause EIB and airway
damage. Long-term exposure can have signifi cant effects on
resting airway function.6 7 Signifi cant decrease in FVC, FEV1
and FEF25–75 over a 3-year period of daily training in an ice
rink with high PM1 from fossil-fuelled resurfacers in female
hockey players has been identifi ed.6 The decline in FVC and
07_bjsports-2011-090823.indd 41007_bjsports-2011-
090823.indd 410 4/4/2012 4:24:03 PM4/4/2012 4:24:03 PM
Review
Br J Sports Med 2012;46:407–412. doi:10.1136/bjsports-2011-
090823 411
CONCLUSION
Acute exposure to mixed exhaust aerosols during exercise can
cause decreases in lung and vascular function in healthy and
asthmatic subjects. Chronic exposure to mixed exhaust aerosols
during exercise may result in decreased lung function and may
promote vascular dysfunction, which appear to be related to
increased airway and systemic oxidative stress. The
physiological
effects of high-intensity exercise in high levels of mixed
exhaust
aerosols support the observed compromised performance.
Competing interests None.
Provenance and peer review Commissioned; internally peer
reviewed
REFERENCES
1. Brook RD, Brook JR, Urch B, et al. Inhalation of fi ne
particulate air pollution
and ozone causes acute arterial vasoconstriction in healthy
adults. Circulation
2002;105:1534–6.
2. Frampton MW. Does inhalation of ultrafi ne particles cause
pulmonary vascular
effects in humans? Inhal Toxicol 2007;19 Suppl 1:75–9.
3. Gauderman WJ, Vora H, McConnell R, et al. Effect of
exposure to traffi c on lung
development from 10 to 18 years of age: a cohort study. Lancet
2007;369:571–7.
4. Oberdörster G, Ferin J, Gelein R, et al. Role of the alveolar
macrophage in lung
injury: studies with ultrafi ne particles. Environ Health Perspect
1992;97:193–9.
5. Pietropaoli AP, Frampton MW, Hyde RW, et al. Pulmonary
function, diffusing
capacity, and infl ammation in healthy and asthmatic subjects
exposed to ultrafi ne
particles. Inhal Toxicol 2004;16 Suppl 1:59–72.
competition. In a recent study which examined the times of
the top three fi nishers in seven US marathons over the course
of 8 to 28 years, performance decrements were associated with
acute PM10 exposure among women but not men.
11 These fi nd-
ings may suggest an even greater vulnerability among females
and should be considered when making exercise recommenda-
tions to this population.
The response to PM0.1 inhalation 24 h after exposure in
healthy humans demonstrated signifi cant increase in diastolic
blood pressure, reduced heart rate variability and signifi cant
impaired vasodilatation of the brachial artery.8 Likewise, near
infrared spectroscopy demonstrated a decrease in the reoxy-
genation slope after cuff ischaemia, suggesting a constrictive
response in the microcirculation that supports a physiologically
signifi cant decrease in blood fl ow that could affect exercise
performance.8
The vascular dysfunction associated with PM inhalation
suggests reasonable means by which PM inhalation may
result in a cardiovascular incident due to the increased load
on the heart. However, this added stress on the heart is not
likely to result in a cardiovascular incident in the healthy pop-
ulation, but may affect cardiac output and thus performance.
Interestingly, just as LT receptor antagonists have been useful
in the treatment of asthma, montelukast has been found to
attenuate the vascular dysfunction associated with the bra-
chial artery after PM inhalation.38 This protection against
the vascular dysfunction associated with PM inhalation
could potentially improve exercise performance in high-PM
conditions.
Figure 7 Short-term exercise performance as work accumulated
in a
6-min all-out cycle ergometer ride in low-particulate matter
(PM1) and
high PM1. Note the signifi cant difference in performance in
high PM1.
Data were taken from two separate studies.10 12 Figure 8 (A,
B) Pre-exercise and postexercise fl ow-mediated
dilatation (FMD) of the brachial artery for four trials of 30-min
cycle
ergometry in low-particulate matter (PM) and high-PM-emission
air. FMD was signifi cantly less for high-PM versus low-PM
trials
(p<0.05). Pre-exercise and postexercise pulmonary artery
pressure
was signifi cantly greater in high PM versus low PM (p<0.005).
Redrawn.10
07_bjsports-2011-090823.indd 41107_bjsports-2011-
090823.indd 411 4/4/2012 4:24:03 PM4/4/2012 4:24:03 PM
Review
Br J Sports Med 2012;46:407–412. doi:10.1136/bjsports-2011-
090823412
23. Zielinski H, Mudway IS, Bérubé KA, et al. Modeling the
interactions
of particulates with epithelial lining fl uid antioxidants. Am J
Physiol
1999;277:L719–26.
24. Al-Humadi NH, Siegel PD, Lewis DM, et al. Alteration of
intracellular cysteine
and glutathione levels in alveolar macrophages and lymphocytes
by diesel
exhaust particle exposure. Environ Health Perspect
2002;110:349–53.
25. Gaston B, Reilly J, Drazen JM, et al. Endogenous nitrogen
oxides and
bronchodilator S-nitrosothiols in human airways. Proc Natl
Acad Sci USA
1993;90:10957–61.
26. Henderson EM, Gaston B. SNOR and wheeze: the asthma
enzyme?
Trends Mol Med 2005;11:481–4.
27. Que LG, Liu L, Yan Y, et al. Protection from experimental
asthma by an
endogenous bronchodilator. Science 2005;308:1618–21.
28. Zaman K, Hanigan MH, Smith A, et al. Endogenous S-
nitrosoglutathione modifi es
5-lipoxygenase expression in airway epithelial cells. Am J
Respir Cell Mol Biol
2006;34:387–93.
29. Rundell K W, Spiering BA, Baumann JM, et al.
Bronchoconstriction provoked by
exercise in a high-particulate-matter environment is attenuated
by montelukast.
Inhal Toxicol 2005;17:99–105.
30. Nurkiewicz TR, Porter DW, Barger M, et al. Systemic
microvascular dysfunction
and infl ammation after pulmonary particulate matter exposure.
Environ Health
Perspect 2006;114:412–19.
31. Rundell K W. High levels of airborne ultrafi ne and fi ne
particulate matter in indoor
ice arenas. Inhal Toxicol 2003;15:237–50.
32. Mannix ET, Farber MO, Palange P, et al. Exercise-induced
asthma in fi gure
skaters. Chest 1996;109:312–15.
33. Provost-Craig MA, Arbour KS, Sestili DC, et al. The
incidence of exercise-
induced bronchospasm in competitive fi gure skaters. J Asthma
1996;33:67–71.
34. Wilber RL, Rundell KW, Szmedra L, et al. Incidence of
exercise-induced
bronchospasm in Olympic winter sport athletes. Med Sci Sports
Exerc
2000;32:732–7.
35. Weiler JM, Layton T, Hunt M. Asthma in United States
Olympic athletes who
participated in the 1996 Summer Games. J Allergy Clin
Immunol 1998;102:722–6.
36. Hoffman MD, Clifford PS, Varkey B. Acute effects of ski
waxing on pulmonary
function. Med Sci Sports Exerc 1997;29:1379–82.
37. Oberdorster G, Gelein RM, Ferin J, et al. Association of
particulate air
pollution and acute mortality: involvement of ultrafi ne
particles? Inhal Toxicol
1995;7:111–24.
38. Rundell K W, Steigerwald MD, Fisk MZ. Montelukast
prevents vascular
endothelial dysfunction from internal combustion exhaust
inhalation during
exercise. Inhal Toxicol 2010;22:754–9.
6. Rundell K W. Pulmonary function decay in women ice
hockey players: is there a
relationship to ice rink air quality? Inhal Toxicol 2004;16:117–
23.
7. Rundell K W, Spiering BA, Evans TM, et al. Baseline lung
function, exercise-
induced bronchoconstriction, and asthma-like symptoms in elite
women ice
hockey players. Med Sci Sports Exerc 2004;36:405–10.
8. Rundell K W, Hoffman JR, Caviston R, et al. Inhalation of
ultrafi ne and
fi ne particulate matter disrupts systemic vascular function.
Inhal Toxicol
2007;19:133–40.
9. Rundell K W, Slee JB, Caviston R, et al. Decreased lung
function after inhalation
of ultrafi ne and fi ne particulate matter during exercise is
related to decreased
total nitrate in exhaled breath condensate. Inhal Toxicol
2008;20:1–9.
10. Cutrufello PT, Rundell KW, Smoliga JM, et al. Inhaled
whole exhaust
and its effect on exercise performance and vascular function.
Inhal Toxicol
2011;23:658–67.
11. Marr LC, Ely MR. Effect of air pollution on marathon
running performance.
Med Sci Sports Exerc 2010;42:585–91.
12. Rundell K W, Caviston R. Ultrafi ne and fi ne particulate
matter inhalation
decreases exercise performance in healthy subjects. J Strength
Cond Res
2008;22:2–5.
13. Chalupa DC, Morrow PE, Oberdörster G, et al. Ultrafi ne
particle deposition in
subjects with asthma. Environ Health Perspect 2004;112:879–
82.
14. Daigle CC, Chalupa DC, Gibb FR, et al. Ultrafi ne particle
deposition in humans
during rest and exercise. Inhal Toxicol 2003;15:539–52.
15. Campen MJ, Lund AK, Doyle-Eisele ML, et al. A
comparison of vascular effects
from complex and individual air pollutants indicates a role for
monoxide gases and
volatile hydrocarbons. Environ Health Perspect 2010;118:921–
7.
16. Larsson BM, Sehlstedt M, Grunewald J, et al. Road tunnel
air pollution induces
bronchoalveolar infl ammation in healthy subjects. Eur Respir J
2007;29:699–705.
17. McCreanor J, Cullinan P, Nieuwenhuijsen MJ, et al.
Respiratory effects
of exposure to diesel traffi c in persons with asthma. N Engl J
Med
2007;357:2348–58.
18. Ferin J, Oberdörster G, Penney DP. Pulmonary retention of
ultrafi ne and fi ne
particles in rats. Am J Respir Cell Mol Biol 1992;6:535–42.
19. EPA. Particulate Matter. http://www.epa.gov/pm/index.html
(accessed 1 September 2011).
20. Li N, Sioutas C, Cho A, et al. Ultrafi ne particulate
pollutants induce oxidative
stress and mitochondrial damage. Environ Health Perspect
2003;111:455–60.
21. Rundell K W, Caviston R, Hollenbach AM, et al. Vehicular
air pollution,
playgrounds, and youth athletic fi elds. Inhal Toxicol
2006;18:541–7.
22. Venkataraman C, Kao AS. Comparison of particle lung
doses from the fi ne and
coarse fractions of urban PM-10 aerosols. Inhal Toxicol
1999;11:151–69.
07_bjsports-2011-090823.indd 41207_bjsports-2011-
090823.indd 412 4/4/2012 4:24:05 PM4/4/2012 4:24:05 PM
SHORT COMMUNICATION
Global warming: is weight loss a solution?
A Gryka, J Broom and C Rolland
Centre for Obesity Research and Epidemiology, Faculty of
Health and Social Care, Robert Gordon University, Aberdeen,
UK
The current climate change has been most likely caused by the
increased greenhouse gas emissions. We have looked at the
major greenhouse gas, carbon dioxide (CO2), and estimated the
reduction in the CO2 emissions that would occur with the
theoretical global weight loss. The calculations were based on
our previous weight loss study, investigating the effects of a
low-carbohydrate diet on body weight, body composition and
resting metabolic rate of obese volunteers with type 2 diabetes.
At 6 months, we observed decreases in weight, fat mass, fat free
mass and CO2 production. We estimated that a 10 kg weight
loss of all obese and overweight people would result in a
decrease of 49.560 Mt of CO2 per year, which would equal to
0.2% of
the CO2 emitted globally in 2007. This reduction could help
meet the CO2 emission reduction targets and unquestionably
would be of a great benefit to the global health.
International Journal of Obesity (2012) 36, 474–476;
doi:10.1038/ijo.2011.151; published online 26 July 2011
Keywords: global warming; carbon dioxide; weight loss
Introduction
Climate change resulting from the mean rise in temperature
over the last 100 years has been widely discussed.1 It has been
accepted by the majority of scientists that the change is being
caused by the anthropogenic increase in greenhouse gas
emissions. Greenhouse gases in the atmosphere impair the
earth’s cooling processes, which results in the global rise in
temperature.1 The major greenhouse gas is carbon dioxide
(CO2), which mostly comes from burning of fossil fuels (gas,
oil, coal and other solid fuels). Other sources of CO2 emissions
include iron and steel production, cement manufacture, solid
waste combustion or petrochemical production. In 2007,
burning of fossil fuels and cement manufacture caused
emission of 30 649.36 Mt CO2 globally.
2 Across the world,
fossil fuels are combusted to provide energy to generate
electricity, for transport, business, agriculture and industry. If
the current emissions are not reduced, the global temperature
may rise by 2–7 1C by the end of the century, depending on
the models used.3 This in turn may cause the extinction of
many species, irreversible changes in the ecosystems and
environmental disasters like storms, wildfires, droughts or
floods. Such prognoses bring governments to set targets
for the reduction of CO2 production and support the search
for alternative energy sources.
Humans, apart from indirectly producing CO2 through
the use of fossil fuels and the industry, also produce CO2
during respiration. Consequently, global CO2 emissions
depend on the size of the population. In addition, due to
the fact that CO2 production is proportionate to body mass,
heavier individuals produce more (based on our data, for
every kg of body mass lost, resting metabolic rate (RMR)
dropped by about 18 kcal per day and there was a 1%
reduction in CO2 produced). The post-industrial changes to
human lifestyle and diet have resulted in an obesity
epidemic. Although the knowledge of obesity mechanisms
is quickly expanding and novel obesity treatments are being
developed, the situation on a world population level has
not improved. With the countless unsuccessful efforts to
tackle the obesity problem, it is more and more evident that
the global modification of today’s lifestyles and environ-
ments may be the only possible solution to the obesity
epidemic.
In light of the growing literature on the link between
obesity, type 2 diabetes (T2DM), coronary artery diseases and
climate change,4–8 we thought it would be interesting to
discuss the effect of the global reduction of body mass, in
particular of those individuals who are obese and overweight
on worldwide CO2 emissions. It is clear that an omnipresent
weight loss of all obese and overweight population is as
improbable in the short term as global warming is inevitable
if no action is taken. However, it is essential to model the
effect of population weight loss on CO2 emissions. We have
assumed a 10 kg weight loss, based on our observations as
well as other studies using a low carbohydrate diet for a
6-month period.9
Received 17 December 2010; revised 2 June 2011; accepted 24
June 2011;
published online 26 July 2011
Correspondence: Dr C Rolland, Centre for Obesity Research and
Epidemiology,
Faculty of Health and Social Care, Robert Gordon University,
St Andrew Street,
Aberdeen, AB25 1HG UK.
E-mail: [email protected]
International Journal of Obesity (2012) 36, 474– 476
& 2012 Macmillan Publishers Limited All rights reserved 0307-
0565/12
www.nature.com/ijo
http://dx.doi.org/10.1038/ijo.2011.151
mailto:[email protected]
http://www.nature.com/ijo
Methods
The calculations in the current paper are based on an
observed decrease of resting metabolic rate that occurred
with weight loss in our recent study. The intervention
involved 6 months on a low-carbohydrate, high-protein diet
and included 25 obese volunteers (13 females, 12 males) with
poorly controlled (glycated haemoglobin (HBA)1c47.5%)
T2DM (ISRCTN20400186). CO2 production and body com-
position were assessed at baseline and 6 months. The CO2
production was measured using the Quark RMR (Cosmed,
Rome, Italy). Body composition was measured by air-
displacement plethysmography (Bod Pod, Life Measurement
Inc., Concord, CA, USA). The majority of the variables were
not normally distributed; hence, the Wilcoxon signed-rank
test was used to investigate the 6-month changes in weight,
fat mass (FM), fat-free mass (FFM) and CO2 production.
Analyses were performed with SPSS, version 17.0 (SPSS Inc.,
Chicago, IL, USA).
Results and calculations
The dietary composition of participants on a low-carbohy-
drate/high-protein diet is outlined in Table 1. As expected,
the total energy of the diet was significantly lower during the
study than at baseline. According to our recommendations,
the total amount of carbohydrate, both as grams per day and
as a percent of daily total energy, was lower during the study
than at baseline. Additionally, the amount of protein
increased from 22% to about 30% of total energy levels,
but did not change when expressed in grams per day.
After 6 months of the weight loss programme, we observed
a decrease in weight, FM, FFM and CO2 production (Table 2).
The 6-month change in CO2 production was positively
correlated with the changes in weight (r¼0.506; P¼0.0.12)
and FM (r¼0.517; P¼0.011). The majority of weight lost was
attributed to a decrease in FFM (Table 2), reflecting the
higher protein content of the diet, which was about 30% of
energy intake (Table 1). Weight loss achieved by implement-
ing a normal- or a low-protein diet (that is, 10–15% of
energy), could perhaps induce a higher loss of FFM than a
high-protein diet. Consequently, such a diet would cause an
even bigger drop in RMR and CO2 production, but would not
be beneficial to the health of the individual losing weight.
On the basis of the current data, for every 1 kg of body
mass lost, the CO2 production would decrease 3.2 ml min
�1.
Therefore, an individual who lost 10 kg would produce 32 ml
of CO2 less every minute. This would equal to 168 12 l
(33.04 kg) of CO2 less in a year, compared with what would
be produced without weight loss. In 2008, the global number
of obese and overweight adults over 20 years old was 1.5
billion.10 If all those individuals lost 10 kg and sustained it
for a year, the reduction in CO2 emissions would be 49.56 Mt
CO2 per year. This would equate to 0.2% of CO2 emitted
globally in 2007 by burning of fossil fuels and the
manufacture of cement.2 Analogously, a 5-kg weight loss of
all overweight and obese people would reduce global CO2
emissions by only 0.1%.
Discussion
Our calculations have shown that a 10-kg weight loss of all
overweight and obese people would translate into a 0.2%
Table 1 Changes in diet composition during the low-
carbohydrate/
high-protein weight loss programme (n¼25)
Baseline 6 months Change P-valuea
Energy
Kcal 1845±74 1194±21 �594±600 0.001
Carbohydrate
g per day 164±69 50±25 �108±74.1 o0.001
% Total energy 41±9 22±11 �17.8±12.0 o0.001
Protein
g per day 87±33 79±28 �5.3±32.2 0.882
% Total energy 22±7 30±8 7.9±7.5 o0.001
Fat
g per day 80±44 68±20 �16.4±37.1 0.573
% Total energy 38.5 50.0 10.0±13.9 0.015
Values are expressed as mean±s.d. aSignificance level of the
difference
between baseline and 6 months, Wilcoxon signed-rank test.
Table 2 Changes in weight, fat mass, fat-free mass, resting
metabolic rate
and CO2 production, during the low-carbohydrate/high-protein
weight loss
programme (n¼25)
Baseline 6 months Change P-valuea
Weight (kg)
Males (n¼12) 117.7±19.5 108.0±20.9 �9.7±6.4 0.001
Females (n¼13) 104.6±22.2 94.2±22.1 �10.4±7.8 o0.001
Total 110.9±21.6 100.8±22.2 �10.1±7.0 o0.001
FM (kg)
Males 50.3±13.0 41.1±12.9 �9.2±5.2 o0.001
Females 54.1±17.6 45.7±19.8 �8.8±7.8 0.001
Total 52.4±15.7 43.4±16.5 �9.0±6.5 o0.001
FFM (kg)
Males 67.3±11.8 67.0±12.0 �0.3±1.7 0.266
Females 50.5±7.4 49.3±7.3 �1.6±1.4 o0.001
Total 59.0±12.8 58.1±13.3 �0.9±1.7 0.001
RMR (kcal per day)
Males 2267±451 2033±420 �234±181 0.001
Females 1845±428 1572±345 �274±306 0.002
Total 2048±81 1793±442 �254±250 o0.001
CO2 production (ml min
�1)
Males 258±56 220±45 �37±33 0.001
Females 201±47 173±42 �27±37 0.013
Total 226±58 195±50 �31±34 o0.001
Abbreviations: FFM, fat-free mass; FM, fat mass; RMR, resting
metabolic rate.
Values are expressed as mean±s.d. aSignificance level of the
difference
between baseline and 6 months, Wilcoxon signed ranks test.
Global warming and weight loss
A Gryka et al
475
International Journal of Obesity
reduction in the global CO2 emissions. This percentage
seems small; however, we have looked at personal produc-
tion only. Had we accounted for additional reductions in
CO2 emissions that would likely accompany weight loss, for
example decreases in transport costs, and smaller amounts of
food consumed as suggested by Edwards and Roberts,11 the
total estimated decreases in CO2 production would have
been greater. It could also be argued that the decrease in CO2
production, which accompanies weight loss, would mimic
the benefits of decreasing global population.
The theoretical global weight loss would also be of great
health benefit; halving the risks of developing T2DM and
obesity-related cancers, improving glycemic control in those
with T2DM, and finally improving blood pressure and lipid
profiles.12 Such changes would bring the significant reduc-
tions of healthcare costs and also improvements in general
quality of life.
The targets for CO2 emissions, as specified in the Kyoto
Protocol Reference Manual, vary for different countries and
regions of the world. The UK Low Carbon Transition Plan
suggests lowering the emissions by 18% from the 2008 levels,
or 95.9 Mt CO2 per year, by 2020.
13 A 10-kg weight loss of all
overweight and obese in the UK would account for over 1%
of the CO2 emission reduction target by 2020.
14–16
This estimation was only possible when a number of
assumptions were made. First, we assumed that weight loss
in overweight people would result in the same change in FM
and CO2 production as in the obese. Second, we assumed
that obese and overweight, but otherwise healthy people,
would show the same change in CO2 production with weight
loss, as did obese people with T2DM. Finally, it has been
shown that people with T2DM have higher RMR than those
without,17 and therefore, our calculations may be slightly
overestimated. However, if significant loss of FFM occurred
with weight loss (as may be the case with normal- or low-
protein diets), the decrease in RMR could have been higher,
in which case the current estimations would underestimate
it. Present calculations were not designed to accurately
reflect potential impact of global weight loss on climate
disruption, but to signal an opportunity for addressing
individual, global and environmental benefits of weight loss.
Health and climate change issues seem to be closely
related in the perspective of our future. We agree with
Wilkinson et al.,18 who stated that policies to reduce carbon
emissions and climate change will improve health and well-
being of the people. The opposite should also be true;
tackling lifestyle-related health problems should have a
positive effect on the environment. Universal moderate
weight loss of the overweight and obese would result in an
equivocal influence on the world carbon emissions with
possible effects on climate disruption. Nevertheless, this
relatively small amount could help to meet the CO2 emission
reduction targets and unarguably would be of great benefit
to the human’s health. Moreover, the shift from seeing
weight loss as beneficial for an individual’s health to also
being beneficial for the planet may change attitudes toward
healthy lifestyle. If such benefits were persuasive to govern-
ments across the world, a significant impact on global
warming might be achieved as a consequence.
Conflict of interest
The authors declare no conflict of interest.
Acknowledgements
We thank A Stewart for reading of the manuscript and
critical comments. The study of low-carbohydrate diet was
supported by the Go Lower Company.
References
1 HM Government. Climate change. HM Government, 2009,
http://
www.direct.gov.uk/en/Environmentandgreenerliving/Thewider
environment/Climatechange/index.htm.
2 The World Bank. World Development Indicators. CO2
emissions (kt)
(Online). The World Bank: Washington, DC, 2011. Available at
http://data.worldbank.org (Last updated 4 October 2010).
3 Met Office. Climate change F your essential guide. Report
No.:
09/0050. Met Office: Exeter, Devon, UK, 2009.
4 Faergeman O. Climate change and preventive medicine. Eur J
Cardiovasc Prev Rehabil 2007; 14: 726–729.
5 Shea KM. Climate change: public health crisis or opportunity.
J Public Health Manag Pract 2008; 14: 415–417.
6 Delpeuch F, Maire B, Monnier E, Holdsworth M. Globesity.
A Planet Out of Control? 2009. Earthscan: London.
7 Mawle A. Climate change, human health, and unsustainable
development. J Public Health Policy 2010; 31: 272–277.
8 Egger G, Swinburn B. Planet Obesity. We Are Eating
Ourselves and
The Planet to Death 2010. Allen & Unwin: Crows Nest.
9 Hession M, Rolland C, Kulkarni U, Wise A, Broom J.
Systematic
review of randomized controlled trials of low-carbohydrate vs
low-fat/low-calorie diets in the management of obesity and its
comorbidities. Obes Rev 2009; 10: 36–50.
10 World Health Organization. Obesity and Overweight. Fact
sheet
No. 311. WHO: Geneva, 2011. Available at http://www.who.int/
mediacentre/factsheets/fs311/en/index.html.
11 Edwards P, Roberts I. Population adiposity and climate
change.
Int J Epidemiol 2009; 38: 1137–1140.
12 Turner H, Wass J. Oxford Handbook of Endocrinology and
Diabetes.
Oxford University Press: Oxford, 2002.
13 HM Government. The UK Low Carbon Transition Plan.
National
Strategy for Climate and Energy. HM Government, The
Stationery
Office: Norwich, 2009.
14 Office for National Statistics. News Release: UK Population
Approaches 62 Million. Crown Copyright: Newport, 2010.
15 The Scottish Government. Scottish Health Survey 2008. The
Scottish Government: Edinburgh, 2009.
16 The NHS Information Centre. Health Survey for England
2008
Volume 1: Physical Activity and Fitness. The NHS Information
Centre: Leeds, 2009.
17 Bitz C, Toubro S, Larsen TM, Harder H, Rennie KL, Jebb SA
et al.
Increased 24-h energy expenditure in type 2 diabetes. Diab Care
2004; 27: 2416–2421.
18 Wilkinson RG, Pickett KE, De Vogli R. Equality,
sustainability, and
quality of life. BMJ 2010; 341: c5816.
Global warming and weight loss
A Gryka et al
476
International Journal of Obesity
http://www.direct.gov.uk/en/Environmentandgreenerliving/The
widerenvironment/Climatechange/index.htm
http://www.direct.gov.uk/en/Environmentandgreenerliving/The
widerenvironment/Climatechange/index.htm
http://www.direct.gov.uk/en/Environmentandgreenerliving/The
widerenvironment/Climatechange/index.htm
http://data.worldbank.org
http://www.who.int/mediacentre/factsheets/fs311/en/index.html
Reproduced with permission of the copyright owner. Further
reproduction prohibited without permission.
c.ijo2011151a.pdfGlobal warming: is weight loss a
solutionquestIntroductionMethodsResults and
calculationsDiscussionTable 1 Changes in diet composition
during the low-carbohydrate/high-protein weight loss
programme (n=25)Table 2 Changes in weight, fat mass, fat-free
mass, resting metabolic rate and CO2 production, during the
low-carbohydrate/high-protein weight loss programme
(n=25)Conflict of interestAcknowledgementsReferences
HYPOTHESIS AND THEORY
published: 19 December 2017
doi: 10.3389/fpsyg.2017.02196
Frontiers in Psychology | www.frontiersin.org 1 December 2017
| Volume 8 | Article 2196
Edited by:
Sergio Machado,
Salgado de Oliveira University, Brazil
Reviewed by:
Ludovic Seifert,
Université de Rouen, France
Itay Basevitch,
Anglia Ruskin University,
United Kingdom
*Correspondence:
M. Teresa Anguera
[email protected]
Specialty section:
This article was submitted to
Movement Science and Sport
Psychology,
a section of the journal
Frontiers in Psychology
Received: 01 September 2017
Accepted: 04 December 2017
Published: 19 December 2017
Citation:
Anguera MT, Camerino O,
Castañer M, Sánchez-Algarra P and
Onwuegbuzie AJ (2017) The
Specificity of Observational Studies in
Physical Activity and Sports Sciences:
Moving Forward in Mixed Methods
Research and Proposals for Achieving
Quantitative and Qualitative
Symmetry. Front. Psychol. 8:2196.
doi: 10.3389/fpsyg.2017.02196
The Specificity of Observational
Studies in Physical Activity and
Sports Sciences: Moving Forward in
Mixed Methods Research and
Proposals for Achieving Quantitative
and Qualitative Symmetry
M. Teresa Anguera1*, Oleguer Camerino2, Marta Castañer2,
Pedro Sánchez-Algarra3 and
Anthony J. Onwuegbuzie4, 5
1 Faculty of Psychology, Institute of Neurosciences, University
of Barcelona, Barcelona, Spain, 2 INEFC (National Institute of
Physical Education of Catalonia), IRBLLEIDA (Lleida Institute
for Biomedical Research Dr. Pifarré Foundation), University of
Lleida, Lleida, Spain, 3 Department of Statistics, Faculty of
Biology, University of Barcelona, Barcelona, Spain, 4
Department of
Educational Leadership and Counseling, Sam Houston State
University, Huntsville, TX, United States, 5 Faculty of
Education,
University of Johannesburg, Johannesburg, South Africa
Mixed methods studies are been increasingly applied to a
diversity of fields. In this
paper, we discuss the growing use—and enormous potential—of
mixed methods
research in the field of sport and physical activity. A second
aim is to contribute to
strengthening the characteristics of mixed methods research by
showing how systematic
observation offers rigor within a flexible framework that can be
applied to a wide range
of situations. Observational methodology is characterized by
high scientific rigor and
flexibility throughout its different stages and allows the
objective study of spontaneous
behavior in natural settings, with no external influence. Mixed
methods researchers
need to take bold yet thoughtful decisions regarding both
substantive and procedural
issues. We present three fundamental and complementary ideas
to guide researchers
in this respect: we show why studies of sport and physical
activity that use a mixed
methods research approach should be included in the field of
mixed methods research,
we highlight the numerous possibilities offered by observational
methodology in this field
through the transformation of descriptive data into quantifiable
code matrices, and we
discuss possible solutions for achieving true integration of
qualitative and quantitative
findings.
Keywords: systematic observation, qualitative recording
transformation, qualitative-quantitative integration,
qualitative-quantitative symmetry, sport and physical activity
sciences
Diverse substantive areas have increasingly found their way
into the expanding epistemological
and methodological arsenal applied in mixed methods research
in recent years (Ivankova and
Kawamura, 2010). Mixed methods studies have been defined by
several authors as studies aiming
to integrate qualitative and quantitative elements. Johnson et al.
(2007, p. 123), after analyzing 19
definitions provided by experts in the field, proposed the
following definition: “Mixed methods
research is the type of research in which a researcher or team of
researchers combines elements
https://www.frontiersin.org/journals/psychology
https://www.frontiersin.org/journals/psychology#editorial-board
https://doi.org/10.3389/fpsyg.2017.02196
http://crossmark.crossref.org/dialog/?doi=10.3389/fpsyg.2017.0
2196&domain=pdf&date_stamp=2017-12-19
https://www.frontiersin.org/journals/psychology
https://www.frontiersin.org
https://www.frontiersin.org/journals/psychology#articles
https://creativecommons.org/licenses/by/4.0/
mailto:[email protected]
https://doi.org/10.3389/fpsyg.2017.02196
https://www.frontiersin.org/articles/10.3389/fpsyg.2017.02196/f
ull
http://loop.frontiersin.org/people/213753/overview
http://loop.frontiersin.org/people/350236/overview
http://loop.frontiersin.org/people/329641/overview
http://loop.frontiersin.org/people/505754/overview
Anguera et al. Observation in Sport and Physical Activity
Sciences
of qualitative and quantitative research approaches (e.g., use
of qualitative and quantitative viewpoints, data collection,
analysis, inference techniques) for the broad purposes of
breadth
and depth of understanding and corroboration.” Empirical
studies undertaken in the field of sport and physical activity
have traditionally largely overlooked the methodological—
and epistemological—opportunities offered by mixed methods
research designs, but a growing number of studies in the
field of sport and physical activity have shown the enormous
potential that these designs offer for studying behaviors related
to individual performance (Camerino et al., 2012c; Iglesias and
Anguera, 2012), team performance (Camerino et al.,
2012b,c,d,e),
use of laterality and motor skills (Castañer et al., 2012),
and use of sports facilities by children (Pérez-López et al.,
2016), to name but a few examples. Settings of this type
contain an enormous conceptual richness to be explored and
methodologically captured, and we believe that the time has
come
to build on lessons learned and continue to move forward.
Although observation and other sources of data have been
given some attention in the mixed methods research literature,
few researchers have applied true observational research
methods. Systematic observation is a scientific procedure for
analyzing perceivable behaviors that occur spontaneously in a
natural setting (Bakeman and Gottman, 1997; Anguera, 2003).
In recent years, however, there has been a surge in the number
of empirical studies involving the application of mixed methods
research designs rooted in systematic observation in the field
of sport and physical activity (Camerino et al., 2012a; Anguera
et al., 2014). For this reason we believe that it is time to
reconsider studies that apply systematic observation through a
mixed method design in sport and physical activity. Examples
include shots in soccer (Maneiro et al., 2017), handball (Freitas
et al., 2010), or basketball (Fernández et al., 2009), corner
kicks and throw-ins (Casal et al., 2015), symmetry of actions
and reactions in fencing (Tarragó et al., 2017), maneuvers in
synchronized swimming (Rodríguez-Zamora et al., 2014), errors
in judo (Gutierrez-Santiago et al., 2013), pace during track
events (Aragón et al., 2017), influence of ball size on children’s
performance in basketball (Lapresa et al., 2013a), use of
gestures
and signals by coaches and physical education teachers
(Castañer
et al., 2013), and compliance with rules and regulations, which
themselves serve as a reference framework. The key to
accurately
capturing these realities lies in the application of an
observational
methodology that consists of the following successive stages:
construction of an ad-hoc observation instrument, computerized
recording and coding of behaviors observed, data quality
control, and quantitative analysis of resulting datasets using
adequate techniques for obtaining structured categorical data (in
particular, lag sequential analysis, polar coordinate analysis,
and
T-pattern detection). Each of these techniques is governed by
methodological rigor and scientific logic (Portell et al., 2015a).
Many studies portrayed as representing mixed methods
research studies are constrained by diverse methodological
shortcomings. However, in our opinion, there are two major
ones: inadequate integration of qualitative and quantitative
data and a lack of symmetry between the two approaches.
Greater symmetry between quantitative and qualitative
approaches is methodologically desirable given the need
to merge both perspectives, although there are obviously
situations in which a greater emphasis on one approach or
another is preferable (Sandelowski et al., 2009). There are
two distinct approaches to asymmetry within the theoretical
framework. The first is a phenomenological approach, or more
specifically, an “enactive or radical-embodiment” approach to
the neuroscience of consciousness (Thompson and Varela, 2001;
Lutz et al., 2002). This approach involves integrating first-
person
(phenomenological) data with neuroimaging data in order
to explore the mutual constraints between these two types of
data described in a different manner. The phenomenological
approach is used in cluster trials where physiological data are
obtained from participants in experimental situations. The
second approach, traditionally viewed as more complex, is the
successful mixing of qualitative and quantitative elements. We
believe that the complexity of this approach lies in the nature
of the data involved and it requires robust solutions to strike a
balance between the qualitative and quantitative elements.
Researchers of systematic observation in the field of sport
and physical exercise fundamentally draw their data from
what could be considered exemplary sources, namely video or
sound recordings of behaviors (i.e., direct observation;
Anguera,
2003) and narratives from in-depth interviews (i.e., indirect
observation; Morales-Sánchez et al., 2014; Anguera et al.,
2017).
Less frequently, they use elicited responses (i.e., responses to
structured or semi-structured interviews –Arias and Anguera,
2017- or questionnaires), simulated data (Manolov and Losada,
2017), and physiological data (Zurutuza et al., 2017). Our aim
in this article, then, is to provide guidance on how to resolve
two of the main shortcomings that undermine mixed methods
research in the field of sport and physical activity—integration
and symmetry of qualitative and quantitative data—and to show
how these solutions could be extrapolated to other fields. In the
following sections, we discuss three fundamental concepts with
the aim of contributing to the ongoing dialog in mixed methods
research and helping this field to advance.
SPORT AND PHYSICAL ACTIVITY AS A
NEW SUBSTANTIVE AREA IN MIXED
METHODS RESEARCH
In the late 1990s, Biddle (1997) found very little diversity in
research methods used in empirical studies in two of the most
prestigious sport and physical activity journals he chose to
study—The Journal of Sport and Exercise Psychology (JSEP),
a leading research journal in the field, and The International
Journal of Sport Psychology (IJSP), which was the first journal
in this field. Most of the quantitative research was based on
regression techniques and discriminant analysis, while most
of the qualitative research drew on interviews and content
analysis. During the same period, Morris (1999) reported that
observational and case studies accounted for just 2% of
scientific
production in this field between 1979 and 1998.
In a study published shortly afterwards, Biddle et al. (2001)
presented a detailed analysis of the methods used in both
Frontiers in Psychology | www.frontiersin.org 2 December 2017
| Volume 8 | Article 2196
https://www.frontiersin.org/journals/psychology
https://www.frontiersin.org
https://www.frontiersin.org/journals/psychology#articles
Anguera et al. Observation in Sport and Physical Activity
Sciences
quantitative and qualitative sport and exercise psychology
research, with a focus on discriminant analysis, hierarchical
regression, stepwise statistical procedures (although it should
be noted that stepwise procedures have been debunked by
numerous statisticians; cf. Thompson, 1995; Onwuegbuzie and
Daniel, 2003), and meta-analysis in the area of quantitative
research and thematic analysis (mostly interviews) in the area of
qualitative research. Biddle et al. (2001) words were
particularly
enlightening:
The extent to which such diverse approaches could or should be
integrated is a matter for the reader to decide. Some have stated
that qualitative and quantitative approaches reflect
fundamentally
different paradigms, such as when people refer to qualitative vs.
quantitative methods. Although there are obvious differences in
the two approaches, there are many cases when the two are
combined. (p. 778)
As we will discuss in the last section, one of the main
shortcomings of studies that involve an attempt to combine the
two approaches is the failure to successfully integrate
qualitative
and quantitative data. This is consistent with Bazeley’s (2010)
conclusion that “there are surprisingly few published studies
reporting results from projects which make more than very
elementary use of the capacity to integrate data and analyses
using computers” (p. 434). True integration in applied studies
is not easy task, but the aim of this paper is to show how
a novel methodological approach grounded within systematic
observation can help to overcome some of the challenges
involved.
Based on our experience and work, we can now confidently
state that the “multifaceted” perspective (Tashakkori and
Teddlie,
2010, p. 274) offered by a mixed methods research approach
(Johnson et al., 2007) is now widely present in the field of
sport and physical activity (van der Roest et al., 2015). An
optimal approach would be to take a wide-angle perspective
while resisting the temptation to pose an overly broad research
question, with the ultimate aim of making future research more
effective.
To gain a better perspective on the use of mixed methods
research in sports and physical activity studies worldwide,
we conducted what Alise and Teddlie (2010) refer to as
prevalence rate studies, which represents “a line of inquiry into
research methods in the social/behavioral sciences [referring
to the proportion of articles using a particular methodological
approach]” (p. 104), which is undertaken by assessing (a) the
prevalence rates of MM [mixed methods] in those fields and
(b) the degree to which disciplines are still dominated by the
traditional postpositivist QUAN [quantitative] approaches” (p.
107). Specifically, we performed a literature search of ISI-
indexed
journals in the Web of Science and the ISI Web of Knowledge
(Journal Citation Reports) to determine the number of articles
applying a mixed methods research approach in this field. We
placed no restrictions on language, year, or geographic location.
Table 1 presents a list of the journals analyzed, together with
their JCR impact factor and the number of articles that used
mixed methods research approaches. They key search term used
was mixed methods and we did not place any limits on
publication
dates, although our results show that the majority of articles
retrieved were published after the year 2000. Our findings show
that, compared with the situation described by Biddle (1997)
and
Morris (1999), a considerable number of ISI-indexed journals
now publish mixed methods research studies. We have included
all studies that, based on their keywords, can be considered
mixed
methods studies from the time the mixed methods movement
emerged. The results from the last 15 years highlight the
growing
number of mixed methods studies published in the field of
sport and physical activity. These studies include a considerable
number of conceptual and methodological papers on different
aspects of mixed methods, which have undoubtedly contributed
to the growth of applied empirical studies in this area. Indeed,
the 203 mixed methods research articles identified among this
set
of 67 journals yielded a mean of 3.03 mixed methods research
articles (SD = 4.98). This represents an important advance, not
only because of the increase in studies of this type, but also
because it shows that prestigious peer-reviewed journals are
now
publishing these studies.
INCLUSION OF PURELY OBSERVATIONAL
SPORTS AND PHYSICAL ACTIVITY
STUDIES IN THE FIELD OF MIXED
METHODS RESEARCH
Studies in the field of sport and physical activity frequently
address immediate research concerns that require a scientific
answer to questions related to multiple aspects of learning,
training, and performance. Such realities are multifaceted in any
field, but we are referring to the specific—and possibly
unique—
case of studies in which the primary and often the only goal is
to capture what is actually happening, with no regard for the
administration of standardized tests or the opinions or feelings
of the agents involved. Studies in the field of sport and physical
activity provide numerous examples of such cases, which, due
to their singularity, we believe deserve special consideration
(Castañer et al., 2013).
Let us imagine, for example, that we are interested in studying
the suitability of a certain tactic in an elite individual or team
competition (e.g., a judo or soccer match). A fitting research
design would be systematically to observe the athlete’s behavior
(systematic direct observation) and to conduct an in-depth
interview with the athlete and/or his or her trainer after the
event (indirect observation). Logically, the responses given by
the athlete or trainer might be different to the information
portrayed by the video recording (referred by Greene et al.,
1989; as initiation, which involves discovering paradoxes and
contradictions that emerge when findings from the two
analytical
strands are compared), because opinions regarding performance
can understandably vary and can be elaborated on in an
interview
situation. To meet the goal of our study, we would need to
merge
the quantitative and qualitative findings by comparing the
results
of the interview (presuming that these are purely qualitative)
with
the information captured in the video recordings (as annotation
of the behaviors observed in the successive images analyzed
Frontiers in Psychology | www.frontiersin.org 3 December 2017
| Volume 8 | Article 2196
https://www.frontiersin.org/journals/psychology
https://www.frontiersin.org
https://www.frontiersin.org/journals/psychology#articles
Anguera et al. Observation in Sport and Physical Activity
Sciences
TABLE 1 | Publication of mixed methods research studies in
ISI-Indexed sports
and physical activity journals.
Journal JCR Impact factor Number of
Mixed methods
articles, no.
Adapted Physical Activity Quarterly 1.324 2
American Journal of Sports Medicine 4.362 2
British Journal of Sports Medicine 5.025 4
Clinical Journal of Sport Medicine 2.268 2
Current Sports Medicine Reports 1.552 0
European Journal of Sport Science 1.550 2
European Physical Education Review 0.673 12
European Review of Aging and Physical
Activity
0.676 0
Exercise and Sport Sciences Reviews 4.252 0
Gait and Posture 2.752 0
Human Movement Science 1.598 0
Health Education Research 1.574 16
International Journal of the History of Sport 0.258 0
International Journal of Performance
Analysis in Sport
0.798 1
International Journal of Sport Nutrition and
Exercise Metabolism
2.442 0
International Journal of Sport Finance 0.385 0
International Journal of Sport Psychology 0.485 3
International Journal of Sports Medicine 2.065 0
International Journal of Sports Physiology
and Performance
2.662 1
International Journal of Sports Science
and Coaching
0.480 0
International Review for the Sociology of
Sport
0.953 1
International Review of Sport and Exercise
Psychology
4.526 0
Isokinetics and Exercise Science 0.488 0
Journal of Aging and Physical Activity 1.966 5
Journal of Applied Biomechanics 0.984 0
Journal of Applied Sport Psychology 1.062 3
Journal of Athletic Training 2.017 7
Journal of Biomechanics 2.751 0
Journal of Electromyography and
Kinesiology
1.647 0
Journal of Exercise Science and Fitness 0.333 1
Journal of Human Kinetics 1.029 0
Journal of Motor Behavior 1.418 0
Journal of Physical Activity and Health 2.090 8
Journal of Science and Medicine in Sport 3.194 3
Journal of Sports Science and Medicine 1.025 3
Journal of Sports Sciences 2.246 5
Journal of Teaching in Physical Education 1.021 7
Journal of Science and Medicine in Sport 3.194 3
Journal of Sport and Exercise Psychology 2.185 12
Journal of Sport and Social Issues 0.571 0
Journal of Sport Management 0.718 7
Journal of Sport Rehabilitation 1.276 2
(Continued)
TABLE 1 | Continued
Journal JCR Impact factor Number of
Mixed methods
articles, no.
Journal of Sports Medicine and Physical
Fitness
0.972 0
Journal of Sports Science and Medicine 1.025 3
Journal of Teaching in Physical Education 1.021 7
Journal of Strength and Conditioning
Research
2.075 4
Kinesiology 0.585 1
Medicine and Science in Sports and
Exercise
3.983 5
Medicina dello Sport 0.235 0
Motor Control 1.233 0
Pediatric Exercise Science 1.452 0
Perceptual and Motor Skills 0.546 1
Physical Education and Sport Pedagogy 0.811 6
Physical Therapy in Sport 1.653 0
Proceedings of the Institution of
Mechanical Engineers Part P-Journal of
Sports Engineering and Technology
0.885 0
Psychology of Sport and Exercise 1.896 7
Quality and quantity 0.720 32
Quest 1.017 1
Research in Sports Medicine 1.704 0
Research Quarterly for Exercise and Sport 1.566 9
Revista Internacional de Medicina y
Ciencias de la Actividad Fisica y del
Deporte
0.146 0
Revista de Psicología del Deporte 0.487 5
Scandinavian Journal of Medicine and
Science in Sports
2.896 4
Sociology of Sport Journal 0.750 0
Sport Education and Society 1.288 5
Sports Biomechanics 1.154 0
Sports Medicine 5.038 1
Total Number of Articles − 203
produces a systematized, quantifiable dataset built through the
coding of data guided by a structured ad-hoc observation
instrument).
Although interviews as a research method can sometimes
raise concerns due, for example, to doubts about sample
representativeness (Sandelowski, 1995; Onwuegbuzie, 2003),
this
is not the case in the example described. The issue of interviews
in
observational methodology studies of sport and physical activity
is very different, and poses more serious questions, as
illustrated
by the following example.
Let us now imagine that we are studying the fouls committed
by an athlete in a competition. If we did not modify our
approach,
we would be contrasting a visual record of what actually
happened with the athlete’s interpretation of what happened,
with
the additional risk that this interpretation could be tainted by
considerable cognitive baggage. If the purpose of the study is to
analyze the fouls committed by an athlete, what use is it for the
Frontiers in Psychology | www.frontiersin.org 4 December 2017
| Volume 8 | Article 2196
https://www.frontiersin.org/journals/psychology
https://www.frontiersin.org
https://www.frontiersin.org/journals/psychology#articles
Anguera et al. Observation in Sport and Physical Activity
Sciences
athlete to say that he or she did not commit the foul if we have
an image showing the contrary? The discrepancies between the
two realities could be considerable, both in volume and nature,
but that aside, we do not actually need the opinion of the
athlete,
because the answer to our research question lies in the analysis
of fragments of what actually happened. This issue becomes
even
more complicated if we decide to include quantitative data, such
as distances covered, number of steps taken, or heart rate, or if
we administer a personality test before and after the
competition,
because none of this information can shed light on our research
question or enrich our findings.
In our opinion, the ideal solution for situations like this
(which are very common) is to apply the successive steps
defined
within observational methodology. These include selecting
dimensions and subdimensions designed to answer the research
question, taking decisions on segmentation of the observable
date into units, proposing a design for each research objective,
building a purpose-designed observation instrument, creating a
computerized coded dataset that allows the data to be arranged
into matrices of codes, checking the reliability and variability
of
the data collected, and analyzing the behavioral patterns hidden
within the code matrices using robust analytical techniques for
categorical data. Systematic observation is the main procedure
used to collect data in event analysis (Happ et al., 2004) and
there
is ample experience with its use and evidence of its potential
(Anguera, 1979, 2003; Portell et al., 2015b).
The study of spontaneous behavior is characterized by
a richness of information that can only be captured by
video or sound recordings, without elicitation (Anguera and
Hernández-Mendo, 2016), and the possibilities offered in this
area have been greatly enhanced by recent technological
advances. Examples are (a) integration of data through
merging, connecting, and embedding strategies (Plano Clark
and Sanders, 2015); (b) integration of multisensor data
through data fusion (Liggins et al., 2017), which consists
of combining signal- and image-processing techniques with
pattern-recognition techniques and artificial intelligence to
create multimodal databases; (c) integration of heart rate
data captured during exercise with observational data on
physical activity through hidden Markov chains (Castañer et al.,
2017b); and (d) application of deep learning techniques, which
automatically extract multilevel characteristics that maximize
the
identification of predefined behavioral patterns (Ordóñez and
Roggen, 2016). The resulting information is also richer in terms
of veracity, as the data are not tainted by a personal opinion but
based on an objective recording of what happened.
A careful choice of observation units is a central component
of observational research (Anguera and Izquierdo, 2006). The
choice of units in the field of sport will be determined by the
research question and by the rules of the sport, each with its
nuances, and the units must be captured through the careful,
rigorous use of video cameras, which is not without its technical
complexities. In soccer, for example, a move may be a macro-
unit
(with the condition that only the team in possession of the ball
is
observed) but it can also be divided into smaller units
depending
on, for instance, how a given player establishes contact with the
ball or with different team mates or areas of the pitch.
Systematic observation differs from other methods in that the
observation instrument must be built ad-hoc—that is, it must be
purpose-designed in accordance with the theoretical framework
of the study. The main instrument used in studies of this type
combines a field format system and category systems tailored to
the research question (Anguera et al., 2007).
The field format (Sánchez-Algarra and Anguera, 2013)
is a multidimensional system. For each field format, it is
necessary to draw up a catalog of behaviors (a list of mutually
exclusive behaviors for each dimension) that is considered to
be permanently open; it is constructed using a decimal coding
system that allows the behaviors to be hierarchically arranged
according to the degree of molecularization required. The final
dataset acquires the form of a matrix of codes consisting of
columns containing the different dimensions/subdimensions and
rows consisting of the successive units into which the episode
observed has been segmented. The category system (Anguera,
2003) is unidimensional and requires a theoretical framework,
which, combined with empirical information on the situation
being observed, enables the construction of a series of
exhaustive,
mutually exclusive categories. Instruments that combine field
format and category systems aim to harness the strengths of
the two systems (flexibility in the first case and support from
a theoretical framework in the second) and compensate for
their weaknesses (inadequacy of the category system in dynamic
processes and multidimensional studies and weakness of the
field
format system in studies that lack a theoretical framework or in
which this framework has been rejected).
Numerous examples have been described in the literature,
particularly in recent years, and have been applied to a wide
range
of sporting contexts, including motor skill analysis (Castañer
et al., 2009), physical activity (Castañer et al., 2016b), middle-
and long-distance races (Aragón et al., 2015, 2017), basketball
(Fernández et al., 2009), soccer (Jonsson et al., 2006; Castañer
et al., 2016a, 2017a; Casal et al., 2017; Diana et al., 2017), judo
(Gutiérrez-Santiago et al., 2011), hockey (Hernández-Mendo
and Anguera, 2002), futsal (Lapresa et al., 2013b), and kinesics
(Castañer et al., 2013). Ad-hoc instruments have been shown
to be equally effective in amateur (Arana et al., 2013) and elite
(Barreira et al., 2014) sport. The growing use of combined
field-
format/category system instruments has undoubtedly has been
favored by the increase in observational studies in the field
of sport and physical activity. We believe, however, that it is
also attributable to the fact that observational methodology is
widely applicable and offers an optimal balance between rigor
and flexibility.
The number of software programs specifically designed
for observational studies has increased in recent years. Apart
from general-purpose programs, such as Microsoft Excel and
Access, researchers now have access to numerous open-access
programs that can be used to record, to display, and to
analyze data, as well as to perform quality checks. Our
research group has designed several freely accessible software
programs to support the scientific community (Hernández-
Mendo et al., 2014). Examples are LINCE (Gabin et al., 2012;
http://observesport.com), HOISAN (Hernández-Mendo et al.,
2012; http://www.menpas.com), MOTS (Castellano et al., 2008;
Frontiers in Psychology | www.frontiersin.org 5 December 2017
| Volume 8 | Article 2196
http://observesport.com
http://www.menpas.com
https://www.frontiersin.org/journals/psychology
https://www.frontiersin.org
https://www.frontiersin.org/journals/psychology#articles
Anguera et al. Observation in Sport and Physical Activity
Sciences
http://www.menpas.com), and SOCCEREYE (Barreira et al.,
2013). Another very useful freeware program that our group has
been systematically using for years to record observational data
and to perform lag sequential analysis is SDIS-GSEG (Bakeman
and Quera, 2011).
The concepts and technicalities of quantification (also
known as quantitizing; Tashakkori and Teddlie, 1998) and
data transformation are a recurrent theme in works written
by eminent figures in the field of mixed methods research
(Sandelowski, 2001; Creswell et al., 2003; Bazeley, 2009b;
Sandelowski et al., 2009). Quantification in observational
methodology is particularly robust, because apart from simple
frequency counts, it contemplates other essential primary
parameters, such as order and duration (Bakeman, 1978;
Anguera
et al., 2001; Bakeman and Quera, 2011), thereby providing the
researcher with the means to map the different components of
a behavior as it occurs. In observational methodology, the term
progressive order of inclusion refers to the fact that frequency
is
the parameter that provides the least information; order
provides
information on frequency and something else (i.e., sequence of
behaviors); and duration provides information on frequency and
order (by adding the number of time units for each occurrence
of
a behavior). This specific consideration of the order parameter
is
crucial for detecting hidden structures through the quantitative
analysis of relationships between different codes in
systematized
observational datasets.
Precisely because it contains information on order and
duration, the initial data set, which is derived from an extremely
rich qualitative component, can be analyzed using a wide
range of quantitative techniques, producing a set of quantitative
results that are then interpreted qualitatively, permitting
seamless integration. With observational methodology, we are
no
longer talking about complementing qualitative and quantitative
findings, but rather about integrating them. As stated by Fetters
(2016), in his article drawing comparisons between
developments
in mixed methods research and the transition from the horseless
carriage to the modern automobile, innovation is both needed
and will occur.
The wide scope of opportunities available for processing
data derived from observation supports the idea that purely
observational studies should be considered as mixed methods
research studies, even though they constitute a somewhat
special
case and do not follow traditional patterns. Although this is a
somewhat controversial topic, as Freshwater (2015, p. 296)
stated,
“disagreement and debate is fundamental to achieving
excellence
in scholarship.”
THE WAY FORWARD: OVERCOMING THE
SHORTCOMINGS OF INTEGRATION AND
SYMMETRY
We are at a critical time for the future of mixed methods
research and we believe that the time has come to stop and
to take stock, just as we do in our everyday lives, as we come
up against different obstacles and challenges. Considering the
relatively recent surge in mixed methods research articles
around
the globe, we believe it is methodologically “healthy” to, as
they say in Spain, “put our finger in the blister” and make a
humble but firm call for reflection on what we believe to be the
two major barriers to the successful implementation of mixed
methods research designs: the lack of integration and the lack
of symmetry.
The Barrier of Integration
Integration of qualitative and quantitative research approaches
is a central theme in the mixed methods research literature,
and the title of a recent editorial by Fetters and Freshwater
(2015b)−1 + 1 = 3—graphically showed that a whole is greater
than is the sum of the individual parts. Although it is
understandable that researchers from a given discipline
typically
will follow the traditions of their research communities, it is
necessary to bear in mind that the respective findings will
be mutually informative—that is, they will talk to each other
(O’Cathain et al., 2010).
Quantitative methods address questions such as causality,
generalizability, and magnitude of effects, whereas qualitative
methodologies are used to develop theories, to describe
occurrences, and to explore the contexts surrounding different
phenomena (Fetters and Freshwater, 2015b). Qualitative
data also can be used to design quantitative instruments
(Onwuegbuzie et al., 2010). Just like in an orchestra, each of
the components in a mixed methods research design has an
important role, but the sum of these components form a greater
whole. However, as Bazeley (2009b) pointed out in an
interesting
study that described how different qualitative and quantitative
methodologies could be positioned along a continuum, not all
types of data or analysis can be integrated.
Although numerous leading figures in the field of mixed
methods research have stressed the importance of integrating
qualitative and quantitative data (Creswell, 2003, 2015;
O’Cathain et al., 2010), a large number of researchers, not
surprisingly, still struggle to merge the two approaches and end
up publishing their results separately.
We believe that the failure to successfully integrate qualitative
and quantitative data is largely due to the nature of the data
involved (Bazeley, 2009b) and that this is where we need to
focus our efforts, through reflection, inquiry, and exploration
of solutions. This lack of data integration might also stem
from quantitative and qualitative research questions that are
addressed separately within a mixed methods research study (cf.
Plano Clark and Badiee, 2010). Qualitative and quantitative
data,
however, can be integrated using what is known as the weaving
approach, which involves presenting the respective findings
together according to a specific theme or concept.
Consequently,
we propose that researchers who encounter difficulties merging
qualitative and quantitative data in studies of sport and physical
activity contemplate an initial exploratory phase in which they
search for ways of weaving together their data, at least until a
suitable methodological solution is found.
The Barrier of Symmetry
Unlike other approaches in experimental studies, which from
an enactive framework (Lutz et al., 2002) show the difference
Frontiers in Psychology | www.frontiersin.org 6 December 2017
| Volume 8 | Article 2196
http://www.menpas.com
https://www.frontiersin.org/journals/psychology
https://www.frontiersin.org
https://www.frontiersin.org/journals/psychology#articles
Anguera et al. Observation in Sport and Physical Activity
Sciences
between first-person approaches (based on phenomonological
data) and third-person approaches (based on physiological
and behavioral data obtained objectively using a range of
instruments), enabling thus the problem of asymmetry
to be overcome, in observational studies of spontaneous
behavior in natural settings, where nothing is “artificial” or
“staged,” asymmetry acquires a different meaning, as described
below.
Mixed methods research studies typically involve the adoption
of either a qualitative-dominant or a quantitative-dominant
approach (Onwuegbuzie and Combs, 2010), but an additional
issue is that studies are frequently characterized by a lack of
symmetry between the two approaches. Mixed methods studies
typically focus more on qualitative than quantitative data and
accordingly miss the opportunity to explore the wealth of
information that a quantitative analysis of qualitative data can
provide. Although it is true that some researchers apply robust
statistical methods and even multiple techniques to analyze
quantitative data (Onwuegbuzie et al., 2007), they frequently
fail
to move beyond a descriptive analysis (Ross and Onwuegbuzie,
2014), and consequently miss out on the opportunity to explore
the richness of information within the qualitative component
(Bazeley, 2009a; Onwuegbuzie, 2016).
As a step toward achieving this qualitative-quantitative
symmetry, we agree with Happ et al. (2004) that it is
necessary to quantitize the qualitative data and qualitize the
quantitative data using different event analysis techniques,
such as, for example, segmenting episodes of behavior into
events or measuring duration of behaviors. O’Cathain et al.
(2010) also refer to quantitization and qualitization, but argue
that it is not sufficient simply to use the qualitative data
to inform the quantitative findings, stressing instead the
need to mix together the two types of data to create new
variables.
Onwuegbuzie et al. (2011) identified 58 types of quantitative
analyses, which they grouped into four categories according to
level of complexity: number of independent variables, number
of dependent variables, measurement scales for independent
variables (nominal, ordinal, interval, and ratio scales), and
measurements scale for dependent variables. Obviously, each
of these categories can be further broken down into additional
categories (Ross and Onwuegbuzie, 2014). What we are
proposing in this paper, and with specific reference to
research in the field of sport and physical activity, is
an approach that strengthens the analytical processing of
quantitative data derived from the qualitative component of the
study. The concept of independent and dependent variables,
almost omnipresent in experimental and quasi-experimental
studies, is not relevant to systematic observation, because
this involves observing spontaneous behaviors in natural
settings.
Techniques for analyzing quantitative data obtained from
qualitative research are generally complex. Anguera et al.
(2014) presented a list of the techniques used in sport and
physical activity research. In Table 2, we present an updated
version of this list, which also now includes techniques for
analyzing data from quantitative sources (Sanchez-Algarra,
2006).
Table 2 shows the wide range of possibilities that exist for
analyzing the qualitative and quantitative data that coexist in
observational studies in the field of sport and physical activity.
As the table demonstrates, however, what is novel about our
approach from a mixed methods perspective is the way in which
we integrate or mix the two types of data. Generally speaking,
“there are three ways in which mixing occurs: merging or
converging the two datasets by actually bringing them together,
connecting the two datasets by having one build on the other,
or embedding one data set within the other so that one type
of data provides a supportive role for the other data set”
(Creswell and Plano Clark, 2007, p. 7). For our proposal, we
chose the second form: connecting two databases by having
one build on the other. According to Sandelowski et al. (2009),
this connection can be achieved through transformation, i.e.,
by quantitizing qualitative data or by qualitizing quantitative
data. We use the sequentiality method, shown in the last row
in Table 2, which takes as its starting point the annotation
of the order of occurrence of all the behaviors included in
a given observational dataset. This sequentiality permits the
transformation of initially qualitative data into a format that can
be analyzed quantitatively and robustly, achieving thus
successful
integration.
None of the standard research designs conceptualized for
mixed methods research are applicable to the transformation
of qualitative data (derived from video or sound recordings
in natural settings, or from texts resulting from indirect
observation) into quantitative data for analysis using specific
quantitative techniques, such as variability analysis, comparison
of proportions, categorical variance, log-linear analysis, logit
analysis, lag sequential analysis, polar coordinate analysis, T-
pattern detection, and so forth. Perhaps the use of such
techniques will enable the weaving approach called for in
mixed methods research. Several data analysis techniques
that are specific to the study of sequences of behavior,
such as lag sequential analysis, polar coordinate analysis,
and T-pattern detection, have a particularly important role
in observational methodology due to the assignment of
parameters of frequency, order, and duration to the initial
qualitative data (Anguera et al., 2001; Blanco-Villaseñor et al.,
2003) and thereby providing the necessary conditions for
subsequent quantitative analysis using robust, non-standard,
statistical techniques that offer highly relevant structural
results.
As an epilog, we would like to stress that there is wide
consensus in the mixed methods research field on the value of
using merging, connecting, and embedding strategies to
integrate
qualitative and quantitative data (Plano Clark and Sanders,
2015).
In this article, we have focused on an approach for connecting
these two perspectives and shown that it is perfectly possible
to transform qualitative datasets featuring behaviors whose
order of occurrence has been recorded into matrices of code
that can subsequently be analyzed using powerful quantitative
techniques.
Frontiers in Psychology | www.frontiersin.org 7 December 2017
| Volume 8 | Article 2196
https://www.frontiersin.org/journals/psychology
https://www.frontiersin.org
https://www.frontiersin.org/journals/psychology#articles
Anguera et al. Observation in Sport and Physical Activity
Sciences
TABLE 2 | Quantitative analysis techniques for processing
qualitative and quantitative data in studies of sport and physical
activity.
Type of relationship Type of data Quantitative statistical
analysis
Descriptive statistics Measures of central tendency:
Mean
Median
Mode
Measures of dispersion:
Variance
Standard deviation
Coefficient of variation
Normal statistical analysis Quantitative data T-test (one
population)
T-test for comparing means between two groups with
independent data
T-test for comparing means between two groups with paired
data
F-test for equality of variances
Univariate analysis of variance (ANOVA):
One-way ANOVA
Two-way ANOVA (with interaction)
Association Relationship between two categorical variables
Yule’s coefficient (Yule’s Q)
Contingency coefficient C
Chi-square (χ2)
Relationship between several categorical variables Contingency
analysis
Log-linear analysis
Logit analysis
Logit analysis-causal
Logit analysis-Markov
Probit analysis
Logistic regression
Correspondence analysis
Relationship between ordinal variables Contingency tables
Log-linear analysis
Logit analysis
Correspondence analysis
Ballot analysis
Ratios Comparison of proportions
Quantitative data Pearson’s correlation coefficient
Simple linear regression
Multiple linear regression
Partial correlation
Covariance Relationship between a naturally dichotomous
variable and a continuous quantitative variable
Point-biserial correlation coefficient (rbp)
Relationship between an artificially dichotomized
variable and a continuous quantitative variable
Point-biserial correlation coefficient (rb)
Relationship between dichotomized variables Tetrachoric
correlation (rt)
Relationship between dichotomous variables Correlation ϕ
Relationship between ordinal variables Spearman correlation
coefficient (rS)
Kendall rank correlation coefficient
Kendall’s W (coefficient of concordance)
Quantitative data Product-moment Pearson correlation
Simple linear regression model
Multiple linear regression model
Partial correlation
(Continued)
Frontiers in Psychology | www.frontiersin.org 8 December 2017
| Volume 8 | Article 2196
https://www.frontiersin.org/journals/psychology
https://www.frontiersin.org
https://www.frontiersin.org/journals/psychology#articles
Anguera et al. Observation in Sport and Physical Activity
Sciences
TABLE 2 | Continued
Type of relationship Type of data Quantitative statistical
analysis
Multivariate analysis of variance
(MANOVA)
Quantitative data One-way MANOVA
Two-way MANOVA (with interaction)
Statistical distances and
dimension reduction
Quantitative data Principal component analysis
Calculation of number of principal components
Geometric interpretation
Qualitative data Principal coordinate analysis (multidimensional
scaling)
Algorithm for calculating principal coordinates
Discriminant analysis Quantitative data Main classification
algorithms: Discriminant analysis. Fisher linear
discriminant analysis and quadratic discriminant analysis:
Minimum or maximum method; Unweighted Pair-Groups
Method
Average (UPGMA) method. Cophenetic correlation.
Canonical correlation analysis Quantitative data Population
canonical correlation analysis
Euclidean distance and Mahalanobis distance
Sequentiality Ordered categorical data analysis Lag sequential
analysis
Polar coordinate analysis
T-pattern detection (temporal patterns)
Quantitative data Time series analysis
Spectral analysis
DISCUSSION
The scientific literature of the past 25 years has presented,
from varying and sometimes opposing standpoints, a wide
spectrum of theoretical positions and empirical findings in
relation to studies that are claimed to represent mixed methods
research studies (López-Fernández and Molina-Azorín, 2011).
Mixed methods research is growing in most disciplines—as
demonstrated by Onwuegbuzie and Corrigan (2016) via their
recent meta-prevalence rate study. And, in our opinion, the field
of sport and physical activity is a particularly fertile area in
which studies merging quantitative and qualitative approaches
have begun to flourish. These studies typically involve the
analysis
of behaviors and motor-related skills in a wide range of sports
and activities that are grounded in a theoretical framework,
can be performed at a professional or amateur level, offer big
learning/training opportunities due to their vast scope, and have
the potential for causing considerable impact in the scientific
community and media at large. They are, as such, particularly
deserving of attention. As shown by our review of the literature,
summarized in Table 1, the volume of mixed methods research
publications in ISI-indexed sports and physical activity journals
varies widely from one journal to the next. Perhaps, as Fetters
(2016) suggests via his analogy of the horseless carriage, we
were
unaware that the many decades of tinkering with mixed methods
would spawn a period of accelerated development. We should
also, however, bear in mind the saying “do not put vintage wine
into new wineskins lest it sour.” That stated, although these
“wineskins” are new, they will have benefited from the
experience
gradually accumulated in multiple substantive areas over the
past
two decades.
As the guiding principle of this paper was to show the
5ALos Angeles is known for its smog, but air quality has impro.docx

More Related Content

Similar to 5ALos Angeles is known for its smog, but air quality has impro.docx

Icth2015 hk monday_6_jul
Icth2015 hk monday_6_julIcth2015 hk monday_6_jul
Icth2015 hk monday_6_julHaneen Khreis
 
Particulate matter module
Particulate matter moduleParticulate matter module
Particulate matter moduleSalem Karrab
 
Particulate matter, air quality and climate
Particulate matter, air quality and climateParticulate matter, air quality and climate
Particulate matter, air quality and climateYahsé Challa
 
Ambient air pollution_and_population_hea (1)
Ambient air pollution_and_population_hea (1)Ambient air pollution_and_population_hea (1)
Ambient air pollution_and_population_hea (1)cpinchel
 
Human exposure to ultrafine particles and its importance by samrat gurung
Human exposure to ultrafine particles and its importance  by samrat gurungHuman exposure to ultrafine particles and its importance  by samrat gurung
Human exposure to ultrafine particles and its importance by samrat gurungSamrat Gurung
 
Particulate Matter Module
Particulate Matter ModuleParticulate Matter Module
Particulate Matter ModuleRohanking6
 
Particulate_Matter_Module.ppt
Particulate_Matter_Module.pptParticulate_Matter_Module.ppt
Particulate_Matter_Module.pptNESTCameraMLINK
 
Particulate_Matter_Module.ppt
Particulate_Matter_Module.pptParticulate_Matter_Module.ppt
Particulate_Matter_Module.pptUjasPandya1
 
Particulate_Matter_Module.ppt
Particulate_Matter_Module.pptParticulate_Matter_Module.ppt
Particulate_Matter_Module.pptMuhammad Amien
 
Particulate_MatterB1.ppt
Particulate_MatterB1.pptParticulate_MatterB1.ppt
Particulate_MatterB1.pptLoveGodbole
 
Particulate_Matter_Module.ppt
Particulate_Matter_Module.pptParticulate_Matter_Module.ppt
Particulate_Matter_Module.pptMadhuri Tapadiya
 
Particulate matter module
Particulate matter moduleParticulate matter module
Particulate matter modulessuserfd60c4
 
Particulate_Matter_Module.ppt
Particulate_Matter_Module.pptParticulate_Matter_Module.ppt
Particulate_Matter_Module.pptssuser3c3606
 
ATHLETES’ EXPOSURE TO AIR POLLUTION DURING WORLD ATHLETICS WORLD RELAYS: A PI...
ATHLETES’ EXPOSURE TO AIR POLLUTION DURING WORLD ATHLETICS WORLD RELAYS: A PI...ATHLETES’ EXPOSURE TO AIR POLLUTION DURING WORLD ATHLETICS WORLD RELAYS: A PI...
ATHLETES’ EXPOSURE TO AIR POLLUTION DURING WORLD ATHLETICS WORLD RELAYS: A PI...Mikel Iceta Hernández
 
Exposure to ambient air pollution-does it affect semen quality and the level ...
Exposure to ambient air pollution-does it affect semen quality and the level ...Exposure to ambient air pollution-does it affect semen quality and the level ...
Exposure to ambient air pollution-does it affect semen quality and the level ...Vernando8
 
Case studies in improving urban air quality
Case studies in improving urban air qualityCase studies in improving urban air quality
Case studies in improving urban air qualityngocjos
 

Similar to 5ALos Angeles is known for its smog, but air quality has impro.docx (20)

Health Effects Due To Environmental Pollution To Population
Health Effects Due To Environmental Pollution To Population Health Effects Due To Environmental Pollution To Population
Health Effects Due To Environmental Pollution To Population
 
s11356-018-1822-8.pdf
s11356-018-1822-8.pdfs11356-018-1822-8.pdf
s11356-018-1822-8.pdf
 
Does traffic related air pollution cause childhood asthma
Does traffic related air pollution cause childhood asthmaDoes traffic related air pollution cause childhood asthma
Does traffic related air pollution cause childhood asthma
 
Icth2015 hk monday_6_jul
Icth2015 hk monday_6_julIcth2015 hk monday_6_jul
Icth2015 hk monday_6_jul
 
Particulate matter module
Particulate matter moduleParticulate matter module
Particulate matter module
 
Particulate matter, air quality and climate
Particulate matter, air quality and climateParticulate matter, air quality and climate
Particulate matter, air quality and climate
 
Final Backgrounder
Final BackgrounderFinal Backgrounder
Final Backgrounder
 
Ambient air pollution_and_population_hea (1)
Ambient air pollution_and_population_hea (1)Ambient air pollution_and_population_hea (1)
Ambient air pollution_and_population_hea (1)
 
Human exposure to ultrafine particles and its importance by samrat gurung
Human exposure to ultrafine particles and its importance  by samrat gurungHuman exposure to ultrafine particles and its importance  by samrat gurung
Human exposure to ultrafine particles and its importance by samrat gurung
 
Particulate Matter Module
Particulate Matter ModuleParticulate Matter Module
Particulate Matter Module
 
Particulate_Matter_Module.ppt
Particulate_Matter_Module.pptParticulate_Matter_Module.ppt
Particulate_Matter_Module.ppt
 
Particulate_Matter_Module.ppt
Particulate_Matter_Module.pptParticulate_Matter_Module.ppt
Particulate_Matter_Module.ppt
 
Particulate_Matter_Module.ppt
Particulate_Matter_Module.pptParticulate_Matter_Module.ppt
Particulate_Matter_Module.ppt
 
Particulate_MatterB1.ppt
Particulate_MatterB1.pptParticulate_MatterB1.ppt
Particulate_MatterB1.ppt
 
Particulate_Matter_Module.ppt
Particulate_Matter_Module.pptParticulate_Matter_Module.ppt
Particulate_Matter_Module.ppt
 
Particulate matter module
Particulate matter moduleParticulate matter module
Particulate matter module
 
Particulate_Matter_Module.ppt
Particulate_Matter_Module.pptParticulate_Matter_Module.ppt
Particulate_Matter_Module.ppt
 
ATHLETES’ EXPOSURE TO AIR POLLUTION DURING WORLD ATHLETICS WORLD RELAYS: A PI...
ATHLETES’ EXPOSURE TO AIR POLLUTION DURING WORLD ATHLETICS WORLD RELAYS: A PI...ATHLETES’ EXPOSURE TO AIR POLLUTION DURING WORLD ATHLETICS WORLD RELAYS: A PI...
ATHLETES’ EXPOSURE TO AIR POLLUTION DURING WORLD ATHLETICS WORLD RELAYS: A PI...
 
Exposure to ambient air pollution-does it affect semen quality and the level ...
Exposure to ambient air pollution-does it affect semen quality and the level ...Exposure to ambient air pollution-does it affect semen quality and the level ...
Exposure to ambient air pollution-does it affect semen quality and the level ...
 
Case studies in improving urban air quality
Case studies in improving urban air qualityCase studies in improving urban air quality
Case studies in improving urban air quality
 

More from fredharris32

A report writingAt least 5 pagesTitle pageExecutive Su.docx
A report writingAt least 5 pagesTitle pageExecutive Su.docxA report writingAt least 5 pagesTitle pageExecutive Su.docx
A report writingAt least 5 pagesTitle pageExecutive Su.docxfredharris32
 
A reflection of how your life has changedevolved as a result of the.docx
A reflection of how your life has changedevolved as a result of the.docxA reflection of how your life has changedevolved as a result of the.docx
A reflection of how your life has changedevolved as a result of the.docxfredharris32
 
A Princeton University study argues that the preferences of average.docx
A Princeton University study argues that the preferences of average.docxA Princeton University study argues that the preferences of average.docx
A Princeton University study argues that the preferences of average.docxfredharris32
 
A rapidly growing small firm does not have access to sufficient exte.docx
A rapidly growing small firm does not have access to sufficient exte.docxA rapidly growing small firm does not have access to sufficient exte.docx
A rapidly growing small firm does not have access to sufficient exte.docxfredharris32
 
A psychiatrist bills for 10 hours of psychotherapy and medication ch.docx
A psychiatrist bills for 10 hours of psychotherapy and medication ch.docxA psychiatrist bills for 10 hours of psychotherapy and medication ch.docx
A psychiatrist bills for 10 hours of psychotherapy and medication ch.docxfredharris32
 
A project to put on a major international sporting competition has t.docx
A project to put on a major international sporting competition has t.docxA project to put on a major international sporting competition has t.docx
A project to put on a major international sporting competition has t.docxfredharris32
 
A professional services company wants to globalize by offering s.docx
A professional services company wants to globalize by offering s.docxA professional services company wants to globalize by offering s.docx
A professional services company wants to globalize by offering s.docxfredharris32
 
A presentation( PowerPoint) on the novel, Disgrace by J . M. Coetzee.docx
A presentation( PowerPoint) on the novel, Disgrace by J . M. Coetzee.docxA presentation( PowerPoint) on the novel, Disgrace by J . M. Coetzee.docx
A presentation( PowerPoint) on the novel, Disgrace by J . M. Coetzee.docxfredharris32
 
a presentatiion on how the over dependence of IOT AI and robotics di.docx
a presentatiion on how the over dependence of IOT AI and robotics di.docxa presentatiion on how the over dependence of IOT AI and robotics di.docx
a presentatiion on how the over dependence of IOT AI and robotics di.docxfredharris32
 
A P P L I C A T I O N S A N D I M P L E M E N T A T I O Nh.docx
A P P L I C A T I O N S A N D I M P L E M E N T A T I O Nh.docxA P P L I C A T I O N S A N D I M P L E M E N T A T I O Nh.docx
A P P L I C A T I O N S A N D I M P L E M E N T A T I O Nh.docxfredharris32
 
A nursing care plan (NCP) is a formal process that includes .docx
A nursing care plan (NCP) is a formal process that includes .docxA nursing care plan (NCP) is a formal process that includes .docx
A nursing care plan (NCP) is a formal process that includes .docxfredharris32
 
A nurse educator is preparing an orientation on culture and the wo.docx
A nurse educator is preparing an orientation on culture and the wo.docxA nurse educator is preparing an orientation on culture and the wo.docx
A nurse educator is preparing an orientation on culture and the wo.docxfredharris32
 
A NOVEL TEACHER EVALUATION MODEL 1 Branching Paths A Nove.docx
A NOVEL TEACHER EVALUATION MODEL 1 Branching Paths A Nove.docxA NOVEL TEACHER EVALUATION MODEL 1 Branching Paths A Nove.docx
A NOVEL TEACHER EVALUATION MODEL 1 Branching Paths A Nove.docxfredharris32
 
A Look at the Marburg Fever OutbreaksThis week we will exami.docx
A Look at the Marburg Fever OutbreaksThis week we will exami.docxA Look at the Marburg Fever OutbreaksThis week we will exami.docx
A Look at the Marburg Fever OutbreaksThis week we will exami.docxfredharris32
 
A network consisting of M cities and M-1 roads connecting them is gi.docx
A network consisting of M cities and M-1 roads connecting them is gi.docxA network consisting of M cities and M-1 roads connecting them is gi.docx
A network consisting of M cities and M-1 roads connecting them is gi.docxfredharris32
 
A minimum 20-page (not including cover page, abstract, table of cont.docx
A minimum 20-page (not including cover page, abstract, table of cont.docxA minimum 20-page (not including cover page, abstract, table of cont.docx
A minimum 20-page (not including cover page, abstract, table of cont.docxfredharris32
 
A major component of being a teacher is the collaboration with t.docx
A major component of being a teacher is the collaboration with t.docxA major component of being a teacher is the collaboration with t.docx
A major component of being a teacher is the collaboration with t.docxfredharris32
 
a mad professor slips a secret tablet in your food that makes you gr.docx
a mad professor slips a secret tablet in your food that makes you gr.docxa mad professor slips a secret tablet in your food that makes you gr.docx
a mad professor slips a secret tablet in your food that makes you gr.docxfredharris32
 
A New Mindset for   Leading Change [WLO 1][CLO 6]Through.docx
A New Mindset for   Leading Change [WLO 1][CLO 6]Through.docxA New Mindset for   Leading Change [WLO 1][CLO 6]Through.docx
A New Mindset for   Leading Change [WLO 1][CLO 6]Through.docxfredharris32
 
A N A M E R I C A N H I S T O R YG I V E M EL I B.docx
A N  A M E R I C A N  H I S T O R YG I V E  M EL I B.docxA N  A M E R I C A N  H I S T O R YG I V E  M EL I B.docx
A N A M E R I C A N H I S T O R YG I V E M EL I B.docxfredharris32
 

More from fredharris32 (20)

A report writingAt least 5 pagesTitle pageExecutive Su.docx
A report writingAt least 5 pagesTitle pageExecutive Su.docxA report writingAt least 5 pagesTitle pageExecutive Su.docx
A report writingAt least 5 pagesTitle pageExecutive Su.docx
 
A reflection of how your life has changedevolved as a result of the.docx
A reflection of how your life has changedevolved as a result of the.docxA reflection of how your life has changedevolved as a result of the.docx
A reflection of how your life has changedevolved as a result of the.docx
 
A Princeton University study argues that the preferences of average.docx
A Princeton University study argues that the preferences of average.docxA Princeton University study argues that the preferences of average.docx
A Princeton University study argues that the preferences of average.docx
 
A rapidly growing small firm does not have access to sufficient exte.docx
A rapidly growing small firm does not have access to sufficient exte.docxA rapidly growing small firm does not have access to sufficient exte.docx
A rapidly growing small firm does not have access to sufficient exte.docx
 
A psychiatrist bills for 10 hours of psychotherapy and medication ch.docx
A psychiatrist bills for 10 hours of psychotherapy and medication ch.docxA psychiatrist bills for 10 hours of psychotherapy and medication ch.docx
A psychiatrist bills for 10 hours of psychotherapy and medication ch.docx
 
A project to put on a major international sporting competition has t.docx
A project to put on a major international sporting competition has t.docxA project to put on a major international sporting competition has t.docx
A project to put on a major international sporting competition has t.docx
 
A professional services company wants to globalize by offering s.docx
A professional services company wants to globalize by offering s.docxA professional services company wants to globalize by offering s.docx
A professional services company wants to globalize by offering s.docx
 
A presentation( PowerPoint) on the novel, Disgrace by J . M. Coetzee.docx
A presentation( PowerPoint) on the novel, Disgrace by J . M. Coetzee.docxA presentation( PowerPoint) on the novel, Disgrace by J . M. Coetzee.docx
A presentation( PowerPoint) on the novel, Disgrace by J . M. Coetzee.docx
 
a presentatiion on how the over dependence of IOT AI and robotics di.docx
a presentatiion on how the over dependence of IOT AI and robotics di.docxa presentatiion on how the over dependence of IOT AI and robotics di.docx
a presentatiion on how the over dependence of IOT AI and robotics di.docx
 
A P P L I C A T I O N S A N D I M P L E M E N T A T I O Nh.docx
A P P L I C A T I O N S A N D I M P L E M E N T A T I O Nh.docxA P P L I C A T I O N S A N D I M P L E M E N T A T I O Nh.docx
A P P L I C A T I O N S A N D I M P L E M E N T A T I O Nh.docx
 
A nursing care plan (NCP) is a formal process that includes .docx
A nursing care plan (NCP) is a formal process that includes .docxA nursing care plan (NCP) is a formal process that includes .docx
A nursing care plan (NCP) is a formal process that includes .docx
 
A nurse educator is preparing an orientation on culture and the wo.docx
A nurse educator is preparing an orientation on culture and the wo.docxA nurse educator is preparing an orientation on culture and the wo.docx
A nurse educator is preparing an orientation on culture and the wo.docx
 
A NOVEL TEACHER EVALUATION MODEL 1 Branching Paths A Nove.docx
A NOVEL TEACHER EVALUATION MODEL 1 Branching Paths A Nove.docxA NOVEL TEACHER EVALUATION MODEL 1 Branching Paths A Nove.docx
A NOVEL TEACHER EVALUATION MODEL 1 Branching Paths A Nove.docx
 
A Look at the Marburg Fever OutbreaksThis week we will exami.docx
A Look at the Marburg Fever OutbreaksThis week we will exami.docxA Look at the Marburg Fever OutbreaksThis week we will exami.docx
A Look at the Marburg Fever OutbreaksThis week we will exami.docx
 
A network consisting of M cities and M-1 roads connecting them is gi.docx
A network consisting of M cities and M-1 roads connecting them is gi.docxA network consisting of M cities and M-1 roads connecting them is gi.docx
A network consisting of M cities and M-1 roads connecting them is gi.docx
 
A minimum 20-page (not including cover page, abstract, table of cont.docx
A minimum 20-page (not including cover page, abstract, table of cont.docxA minimum 20-page (not including cover page, abstract, table of cont.docx
A minimum 20-page (not including cover page, abstract, table of cont.docx
 
A major component of being a teacher is the collaboration with t.docx
A major component of being a teacher is the collaboration with t.docxA major component of being a teacher is the collaboration with t.docx
A major component of being a teacher is the collaboration with t.docx
 
a mad professor slips a secret tablet in your food that makes you gr.docx
a mad professor slips a secret tablet in your food that makes you gr.docxa mad professor slips a secret tablet in your food that makes you gr.docx
a mad professor slips a secret tablet in your food that makes you gr.docx
 
A New Mindset for   Leading Change [WLO 1][CLO 6]Through.docx
A New Mindset for   Leading Change [WLO 1][CLO 6]Through.docxA New Mindset for   Leading Change [WLO 1][CLO 6]Through.docx
A New Mindset for   Leading Change [WLO 1][CLO 6]Through.docx
 
A N A M E R I C A N H I S T O R YG I V E M EL I B.docx
A N  A M E R I C A N  H I S T O R YG I V E  M EL I B.docxA N  A M E R I C A N  H I S T O R YG I V E  M EL I B.docx
A N A M E R I C A N H I S T O R YG I V E M EL I B.docx
 

Recently uploaded

Q4-W6-Restating Informational Text Grade 3
Q4-W6-Restating Informational Text Grade 3Q4-W6-Restating Informational Text Grade 3
Q4-W6-Restating Informational Text Grade 3JemimahLaneBuaron
 
Beyond the EU: DORA and NIS 2 Directive's Global Impact
Beyond the EU: DORA and NIS 2 Directive's Global ImpactBeyond the EU: DORA and NIS 2 Directive's Global Impact
Beyond the EU: DORA and NIS 2 Directive's Global ImpactPECB
 
Introduction to Nonprofit Accounting: The Basics
Introduction to Nonprofit Accounting: The BasicsIntroduction to Nonprofit Accounting: The Basics
Introduction to Nonprofit Accounting: The BasicsTechSoup
 
Interactive Powerpoint_How to Master effective communication
Interactive Powerpoint_How to Master effective communicationInteractive Powerpoint_How to Master effective communication
Interactive Powerpoint_How to Master effective communicationnomboosow
 
Unit-IV- Pharma. Marketing Channels.pptx
Unit-IV- Pharma. Marketing Channels.pptxUnit-IV- Pharma. Marketing Channels.pptx
Unit-IV- Pharma. Marketing Channels.pptxVishalSingh1417
 
Class 11th Physics NEET formula sheet pdf
Class 11th Physics NEET formula sheet pdfClass 11th Physics NEET formula sheet pdf
Class 11th Physics NEET formula sheet pdfAyushMahapatra5
 
Accessible design: Minimum effort, maximum impact
Accessible design: Minimum effort, maximum impactAccessible design: Minimum effort, maximum impact
Accessible design: Minimum effort, maximum impactdawncurless
 
Key note speaker Neum_Admir Softic_ENG.pdf
Key note speaker Neum_Admir Softic_ENG.pdfKey note speaker Neum_Admir Softic_ENG.pdf
Key note speaker Neum_Admir Softic_ENG.pdfAdmir Softic
 
Arihant handbook biology for class 11 .pdf
Arihant handbook biology for class 11 .pdfArihant handbook biology for class 11 .pdf
Arihant handbook biology for class 11 .pdfchloefrazer622
 
social pharmacy d-pharm 1st year by Pragati K. Mahajan
social pharmacy d-pharm 1st year by Pragati K. Mahajansocial pharmacy d-pharm 1st year by Pragati K. Mahajan
social pharmacy d-pharm 1st year by Pragati K. Mahajanpragatimahajan3
 
Sanyam Choudhary Chemistry practical.pdf
Sanyam Choudhary Chemistry practical.pdfSanyam Choudhary Chemistry practical.pdf
Sanyam Choudhary Chemistry practical.pdfsanyamsingh5019
 
1029-Danh muc Sach Giao Khoa khoi 6.pdf
1029-Danh muc Sach Giao Khoa khoi  6.pdf1029-Danh muc Sach Giao Khoa khoi  6.pdf
1029-Danh muc Sach Giao Khoa khoi 6.pdfQucHHunhnh
 
Disha NEET Physics Guide for classes 11 and 12.pdf
Disha NEET Physics Guide for classes 11 and 12.pdfDisha NEET Physics Guide for classes 11 and 12.pdf
Disha NEET Physics Guide for classes 11 and 12.pdfchloefrazer622
 
Advanced Views - Calendar View in Odoo 17
Advanced Views - Calendar View in Odoo 17Advanced Views - Calendar View in Odoo 17
Advanced Views - Calendar View in Odoo 17Celine George
 
Web & Social Media Analytics Previous Year Question Paper.pdf
Web & Social Media Analytics Previous Year Question Paper.pdfWeb & Social Media Analytics Previous Year Question Paper.pdf
Web & Social Media Analytics Previous Year Question Paper.pdfJayanti Pande
 
Ecosystem Interactions Class Discussion Presentation in Blue Green Lined Styl...
Ecosystem Interactions Class Discussion Presentation in Blue Green Lined Styl...Ecosystem Interactions Class Discussion Presentation in Blue Green Lined Styl...
Ecosystem Interactions Class Discussion Presentation in Blue Green Lined Styl...fonyou31
 
Holdier Curriculum Vitae (April 2024).pdf
Holdier Curriculum Vitae (April 2024).pdfHoldier Curriculum Vitae (April 2024).pdf
Holdier Curriculum Vitae (April 2024).pdfagholdier
 
IGNOU MSCCFT and PGDCFT Exam Question Pattern: MCFT003 Counselling and Family...
IGNOU MSCCFT and PGDCFT Exam Question Pattern: MCFT003 Counselling and Family...IGNOU MSCCFT and PGDCFT Exam Question Pattern: MCFT003 Counselling and Family...
IGNOU MSCCFT and PGDCFT Exam Question Pattern: MCFT003 Counselling and Family...PsychoTech Services
 

Recently uploaded (20)

Q4-W6-Restating Informational Text Grade 3
Q4-W6-Restating Informational Text Grade 3Q4-W6-Restating Informational Text Grade 3
Q4-W6-Restating Informational Text Grade 3
 
Beyond the EU: DORA and NIS 2 Directive's Global Impact
Beyond the EU: DORA and NIS 2 Directive's Global ImpactBeyond the EU: DORA and NIS 2 Directive's Global Impact
Beyond the EU: DORA and NIS 2 Directive's Global Impact
 
Introduction to Nonprofit Accounting: The Basics
Introduction to Nonprofit Accounting: The BasicsIntroduction to Nonprofit Accounting: The Basics
Introduction to Nonprofit Accounting: The Basics
 
Interactive Powerpoint_How to Master effective communication
Interactive Powerpoint_How to Master effective communicationInteractive Powerpoint_How to Master effective communication
Interactive Powerpoint_How to Master effective communication
 
Unit-IV- Pharma. Marketing Channels.pptx
Unit-IV- Pharma. Marketing Channels.pptxUnit-IV- Pharma. Marketing Channels.pptx
Unit-IV- Pharma. Marketing Channels.pptx
 
Class 11th Physics NEET formula sheet pdf
Class 11th Physics NEET formula sheet pdfClass 11th Physics NEET formula sheet pdf
Class 11th Physics NEET formula sheet pdf
 
Accessible design: Minimum effort, maximum impact
Accessible design: Minimum effort, maximum impactAccessible design: Minimum effort, maximum impact
Accessible design: Minimum effort, maximum impact
 
Key note speaker Neum_Admir Softic_ENG.pdf
Key note speaker Neum_Admir Softic_ENG.pdfKey note speaker Neum_Admir Softic_ENG.pdf
Key note speaker Neum_Admir Softic_ENG.pdf
 
Código Creativo y Arte de Software | Unidad 1
Código Creativo y Arte de Software | Unidad 1Código Creativo y Arte de Software | Unidad 1
Código Creativo y Arte de Software | Unidad 1
 
Arihant handbook biology for class 11 .pdf
Arihant handbook biology for class 11 .pdfArihant handbook biology for class 11 .pdf
Arihant handbook biology for class 11 .pdf
 
social pharmacy d-pharm 1st year by Pragati K. Mahajan
social pharmacy d-pharm 1st year by Pragati K. Mahajansocial pharmacy d-pharm 1st year by Pragati K. Mahajan
social pharmacy d-pharm 1st year by Pragati K. Mahajan
 
Sanyam Choudhary Chemistry practical.pdf
Sanyam Choudhary Chemistry practical.pdfSanyam Choudhary Chemistry practical.pdf
Sanyam Choudhary Chemistry practical.pdf
 
1029-Danh muc Sach Giao Khoa khoi 6.pdf
1029-Danh muc Sach Giao Khoa khoi  6.pdf1029-Danh muc Sach Giao Khoa khoi  6.pdf
1029-Danh muc Sach Giao Khoa khoi 6.pdf
 
Disha NEET Physics Guide for classes 11 and 12.pdf
Disha NEET Physics Guide for classes 11 and 12.pdfDisha NEET Physics Guide for classes 11 and 12.pdf
Disha NEET Physics Guide for classes 11 and 12.pdf
 
INDIA QUIZ 2024 RLAC DELHI UNIVERSITY.pptx
INDIA QUIZ 2024 RLAC DELHI UNIVERSITY.pptxINDIA QUIZ 2024 RLAC DELHI UNIVERSITY.pptx
INDIA QUIZ 2024 RLAC DELHI UNIVERSITY.pptx
 
Advanced Views - Calendar View in Odoo 17
Advanced Views - Calendar View in Odoo 17Advanced Views - Calendar View in Odoo 17
Advanced Views - Calendar View in Odoo 17
 
Web & Social Media Analytics Previous Year Question Paper.pdf
Web & Social Media Analytics Previous Year Question Paper.pdfWeb & Social Media Analytics Previous Year Question Paper.pdf
Web & Social Media Analytics Previous Year Question Paper.pdf
 
Ecosystem Interactions Class Discussion Presentation in Blue Green Lined Styl...
Ecosystem Interactions Class Discussion Presentation in Blue Green Lined Styl...Ecosystem Interactions Class Discussion Presentation in Blue Green Lined Styl...
Ecosystem Interactions Class Discussion Presentation in Blue Green Lined Styl...
 
Holdier Curriculum Vitae (April 2024).pdf
Holdier Curriculum Vitae (April 2024).pdfHoldier Curriculum Vitae (April 2024).pdf
Holdier Curriculum Vitae (April 2024).pdf
 
IGNOU MSCCFT and PGDCFT Exam Question Pattern: MCFT003 Counselling and Family...
IGNOU MSCCFT and PGDCFT Exam Question Pattern: MCFT003 Counselling and Family...IGNOU MSCCFT and PGDCFT Exam Question Pattern: MCFT003 Counselling and Family...
IGNOU MSCCFT and PGDCFT Exam Question Pattern: MCFT003 Counselling and Family...
 

5ALos Angeles is known for its smog, but air quality has impro.docx

  • 1. 5A Los Angeles is known for its smog, but air quality has improved since the 1990’s and so have children’s lungs. The percent of children with lung defects has decreased from 8 out of 100 in 1998 to 3.5 out of 100 in 2011 and is applauded as an environmental success story (N Engl J Med 2015; 372:905- 913). For this forum, you are going to find, read and report on a scientific, peer-reviewed research article. The topic is air pollution’s effect on exercise and sports. For example, air pollution was a big concern for the Olympics held in Beijing, China and Rio, Brazil. What impact does it have on athletic performance and health? You are to find a scientific, peer-reviewed research article. The best place is the library or PubMed. Do not report on a peer- reviewed review paper on the topic. Remember, a review paper summarizes several original research papers. You can use a review to help you find a scientific study. Also, a research study paper usually has the following sections: abstract, introduction, methods, results, conclusions, figures and tables. A review paper does not have these sections. In your initial Forum post: · list your selected article · provide the reference for your chosen article · describe the study and the results · state what the study concludes · evaluate the article. Do you think the study made appropriate conclusions from its data? Was the study designed correctly to address the hypothesis? · Finally, provide your opinion on the matter. Be sure to justify your position. Rundell, Kenneth William. “Effect of Air Pollution on Athlete Health and Performance.” British Journal of Sports Medicine
  • 2. 46.6 (2012): 407–412. Web. Gryka, A et al. “Global Warming: Is Weight Loss a Solution ?” International Journal of Obesity 36.3 (2012): 474–476. Web. Raherison, C, and Filleul, L. “Asthma in Exercising Children Exposed to Ozone.” The Lancet 360.9330 (2002): 411–411. Web. 5b This week we will have two topics in this forum. You will be assigned one topic an then you are expected to respond to both topics in your follow-up posts. If your last name falls between these letters than your topic is: · A-M: Topic 1, Qualitative, Quantitative and Mixed Methods Studies Topic 1: There are several different types of research data. We divide these into qualitative, quantitative, and mixed methods. For this forum, find one example of the study type you are
  • 3. assigned. Tell the class the following: · Complete reference of the paper · The kind of study · Why you feel it is that type of research The study type you are assigned is based on the first letter of your last name. Letter C ( Qualitative) Study Type First Letter of Your Last Name Qualitative A-D Quantitative E-H Mixed Methods I-M Topic 2: There are many different types of study designs. Find a study design that is one of these: case-controlled studies, cohort study, randomized controlled trials, meta-analysis, or case study. Tell the class the following: feel it is that type of research Anguera, M Teresa et al. “The Specificity of Observational Studies in Physical Activity and Sports Sciences: Moving
  • 4. Forward in Mixed Methods Research and Proposals for Achieving Quantitative and Qualitative Symmetry.” Frontiers in psychology 8 (2017): 2196–2196. Web. Lee, Sheng Yen. “Analysis of Relationship Marketing Factors for Sports Centers with Mixed Methods Research.” Asia Pacific Journal of Marketing and Logistics 30.1 (2018): 182–197. Web. Review Br J Sports Med 2012;46:407–412. doi:10.1136/bjsports-2011- 090823 407 ABSTRACT Unfavourable effects on the respiratory and the cardio- vascular systems from short-term and long-term inhalation of air pollution are well documented. Exposure
  • 5. to freshly generated mixed combustion emissions such as those observed in proximity to roadways with high volumes of traffi c and those from ice-resurfacing equipment are of particular concern. This is because there is a greater toxicity from freshly generated whole exhaust than from its component parts. The particles released from emissions are considered to cause oxidative damage and infl ammation in the airways and the vascular system, and may be related to decreased exercise performance. However, few studies have examined this aspect. Several papers describe deleterious effects on health from chronic and acute air
  • 6. pollution exposure. However, there has been no research into the effects of long-term exposure to air pollution on athletic performance and a paucity of studies that describe the effects of acute exposure on exercise performance. The current knowledge of exercising in the high-pollution environment and the consequences that it may have on athlete performance are reviewed. Evidence supports unfavourable effects from short- term and long-term inhalation of air pollution to the respiratory and the cardiovascular systems.1–10 Combustion-related pollutants such as nitrogen and sulphur oxides, the ammonium ion, organic aerosols, particulate matter (PM) and ozone are of concern. Inhaled PM can be causal to oxidative stress-related airway and vascular injury. Although there is ample evidence of short-term and long-term exposure affecting the respiratory and the cardio- vascular systems, little data are available demon-
  • 7. strating the effects of air pollution inhalation on athlete performance.10–12 During athlete training and competition, lung deposition of emission- related pollutants is high because of the increased ventilation during exercise,13 14 and inhalation of emission pollutants has been shown to cause the release of infl ammatory mediators from airway cells.15 16 Furthermore, the asthmatic response is worsened by high emission pollution.17 This study describes combustion-related pollutants that are of concern to the athlete, examines adverse health effects of inhaling airborne pollution during exer- cise and presents current evidence that suggests that athletic performance is compromised by inha- lation of emission-related aerosols during exercise. CATEGORIES OF PARTICULATE MATTER Exposure to freshly generated mixed combustion emissions such as those observed in proximity to high volumes of traffi c is of particular concern since evidence supports a greater toxicity from the freshly generated whole exhaust than from its component parts.15 Further, PM toxicity has been shown to be related to particle surface area, num-
  • 8. ber count and particle charge.18 Airborne PM is categorised by aerodynamic diameter and includes the primary categories of coarse, fi ne and ultrafi ne particles. Particles larger than 10 μm are not considered harmful to airways since they are primarily fi ltered at the nasopha- ryngeal region. Coarse particles (PM10) include those between 2.5 and 10 μm in diameter, fi ne particles (PM2.5) are particles smaller than 2.5 μm in diameter and ultrafi ne particles include those less than 0.1 μm diameter.19 The establishment of a separate category for particles less than 2.5 μm is based on research demonstrating that these smaller particles are more toxic because of their deeper penetration within the airways of the lung. PM less than 1 μm in diameter (PM1) are recorded in many studies, primarily because of portable equipment limitations. This size range typically includes particles in the 0.05 to 1 μm in diameter and is a suitable representation of freshly gener- ated particles. Although ultrafi ne PM (PM0.1), are not yet recognised by the US Environmental Protection Agency (EPA), they are considered to be the most harmful.4 13 14 18 20 Ultrafi ne par-
  • 9. ticle concentrations are high in freshly generated exhaust and can penetrate deep within the lung, but rapidly decrease in number count over time by agglomeration and dispersion (fi gure 1).21 PM from freshly generated exhaust emissions are likely to be the most toxic because they are high- est in number count and surface area and are in the particle size range of 50 to 100 nm (or about 1/1000 the diameter of a human hair) (fi gure 2). Fractional deposition of these 50 to 100 nm particles occurs in the alveolar region where exchange with the circulation may occur. Although coarse and fi ne particles are monitored by the EPA, most toxicol- ogy research has investigated ultrafi ne particles (PM0.1) and fi eld research has primarily measured PM1. An increased deposition fraction (fraction of inhaled particles remaining in the lungs after inha- lation) of PM during exercise has been identifi ed, with the largest deposition fraction noted for ultra- fi ne particles. For example, the fractional deposi- tion13 of PM0.1 is increased 4.5-fold during mild (38 l/min) exercise (fi gure 3).14 For PM2.5, it has been estimated that 9% is deposited in the lungs with 6% reaching the alveolar region.22 Exercise appears
  • 10. to increase the deleterious effects of PM inhalation by deposition, while damaged airway epithelium Correspondence to Kenneth William Rundell, Pharmaxis Inc, Medical Affairs, One East Uwchlan Ave, Suite 405, Exton, Pennsylvania 19341, USA; [email protected] Received 1 December 2011 Accepted 11 December 2011 Published Online First 20 January 2012 Effect of air pollution on athlete health and performance Kenneth William Rundell 07_bjsports-2011-090823.indd 40707_bjsports-2011- 090823.indd 407 4/4/2012 4:24:00 PM4/4/2012 4:24:00 PM Review
  • 11. Br J Sports Med 2012;46:407–412. doi:10.1136/bjsports-2011- 090823408 from mechanical stress of high ventilation may enhance par- ticle infi ltration to the circulatory system. PM toxicology The precise toxicological mechanism(s) of inhaled PM has not been established; however, oxidative stress from exposure is likely involved. It is thought that inhalation of emission pollut- ants causes a release of infl ammatory mediators from airway cells that then enter the circulatory system, causing increased systemic oxidative stress. A decrease in lung antioxidants from in vitro carbon black exposure has been identifi ed and suggests that the epithelial lining fl uid-PM interface may represent an important initial PM detoxifying step.23 This could be critical to the exercising athlete as it is known that there is transient loss of airway surface liquid from high ventilation of dry air, mak- ing airway cells more vulnerable to effects of air pollutants. An acute twofold increase in lung antioxidants of rats exposed to diesel exhaust PM has been identifi ed,24 suggesting a protective role against PM-induced oxidative stress for lung antioxidants.
  • 12. As a consequence to exercise in high emission pollutants, a 44% decrease in total nitrate and a 40% increase in malondi- aldehyde in exhaled breath condensate were found, support- ing formation of the powerful oxidant, peroxynitrite9 from the reaction of nitric oxide (NO) and superoxide. Alternatively, NO reacts with glutathione in the lung to form a potent airway bronchodilator, S-nitrosoglutathione (GSNO).25–27 Studies have shown that reduced GSNO in the asthmatic airways could support increased leukotriene (LT) production, while high levels could inhibit LT production.28 Since a pre- dominantly LT-mediated bronchoconstriction after exercise in high PM has been shown,29 and marked glutathione depletion (to ~20% of pre-exposure levels)24 occurs in lung epithelial lin- ing fl uid after particle exposure, GSNO depletion may be, in part, responsible for PM-induced LT production. If present in training and competition environments, freshly generated particles are of specifi c concern to athletes, and are likely to be related to the high prevalence of airway disease among certain athletic populations. The prevalence of exer- cise-induced bronchoconstriction (EIB), asthma and low rest- ing lung function is high for athletes who train and compete in a high PM-emission environments – far exceeding that of the non-athlete and the low-pollutant-exposed athlete. Pollutants
  • 13. from auto and truck emissions, high emissions from fossil-fu- el-powered ice-rink resurfacers and ski-waxing fumes all nega- tively affect the pulmonary and cardiovascular systems. Potential consequences of inhaling pollutants during exer- cise include decreased lung function, increased exacerbations of asthma/EIB, decreased diffusion capacity, pulmonary hypertension, cardiovascular effects and decreased perfor- mance. McCreanor et al17 demonstrated the effect of a 2-h walk while breathing high-PM/high-ozone air compared with low-PM/low-ozone air on asthmatic airways. There was a concurrent signifi cant decrease in forced vital capacity (FVC) and forced expiratory volume in 1 s (FEV1) from the high-PM/ high-ozone exposure exercise, while lung function remained unchanged from walking in low-PM/low-ozone air (fi gure 4). An almost sixfold increase in sputum myeloperoxidase after the high-PM walk was also observed, suggesting neutrophilic infl ammation. The high levels of PM1 observed at athletic fi elds and play- grounds in close proximity to major highways (fi gure 1) can affect pulmonary and vascular systems of healthy athletes. Only 30 min exposure to high-PM (>60 000 particles/cm3)/ high-ozone (106 to 300 ppb) ambient air during exercise
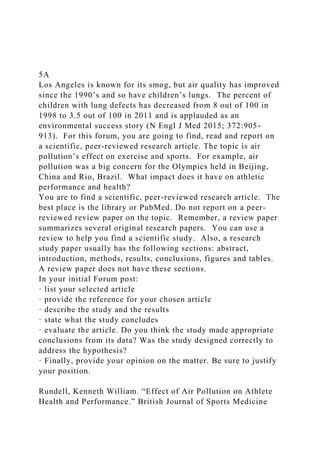
  • 14. Figure 1 Sixty-two days of particle counts on an athletic fi eld within 50 m of a high-traffi c road. The x-axis is particle counts of particles <1 µm in diameter, those emitted from auto and truck emissions. Note that a rather rapid decay in number count is related to the distance from the source. Redrawn.21 Figure 2 Size distribution in number count of freshly generated emission particles. Note the largest number count is in the 50– 60-nm size range. Figure 3 Total particle deposition after 1-h rest and exercise while breathing 25 g/m3 ultrafi ne carbon black particulate matter. Redrawn.14 07_bjsports-2011-090823.indd 40807_bjsports-2011- 090823.indd 408 4/4/2012 4:24:00 PM4/4/2012 4:24:00 PM Review
  • 15. Br J Sports Med 2012;46:407–412. doi:10.1136/bjsports-2011- 090823 409 20-min of exercise in freshly generated four-cycle exhaust (PM0.1>300 000 particles • cm −3, CO<5 ppm). ATHLETE PM EXPOSURE Ice-rink air is notoriously high in emission pollutants gener- ated from combustion-powered ice resurfacers.31 There have been numerous cases of NO2 and CO poisoning in ice rinks from ice-resurfacer exhaust emissions. Along with high NO2 and CO, high particle counts from fossil-fuelled ice resurfacers have been found.31 In one study, particle counts from rinks resurfaced with electric-powered resurfacers and those resur- faced with fossil-fuel-powered machines were compared.31 The particle counts in rinks using electric-powered resurfac- ers were not different to the particle counts of the proximal ambient air. Those rinks that were resurfaced by fossil-fuelled machines, however, had particle counts ~30 times greater than causes a small but signifi cant decrease in lung function in non- asthmatics (fi gure 5).9
  • 16. Inhalation of air pollution also has negative effects on the vascular system. Thirty minutes of exercise in high-PM air resulted in a basal vasoconstriction of the brachial artery, disrupted normal vascular endothelial function, decreased fl ow-mediated dilatation response and a 55% decrease in re oxygenation of the muscle microcirculation.8 Arteriole dila- tation was reported to be impaired after pulmonary exposure to particles and myeloperoxidase was found on adhering neu- trophils on the vascular endothelial wall.30 It was proposed that this may affect the infl uence of NO on vascular tone and that the decreased tissue perfusion of the microvascula- ture from particle inhalation may compromise muscle func- tion. Cutrufello et al10 noted an increase in pulmonary artery pressure as well as disrupted fl ow-mediated dilatation after Figure 4 Lung function of asthmatic subjects during and after a 2-hour walk in either low or high freshly generated diesel emissions. Redrawn.17 07_bjsports-2011-090823.indd 40907_bjsports-2011- 090823.indd 409 4/4/2012 4:24:01 PM4/4/2012 4:24:01 PM
  • 17. Review Br J Sports Med 2012;46:407–412. doi:10.1136/bjsports-2011- 090823410 FEV1, with little change in the FEV1/FVC ratio, is characteristic of early asthma development. For the Nordic and alpine skier, ski-waxing fumes from daily hot waxing provide a major contribution to exposure. Many of today’s ski waxes are fl uorinated and have been shown to have a negative effect on lung function.36 When applied to skis, a hot iron is used; termed ‘hot waxing’. Hot waxing results in ultrafi ne fl uorine particles being released into the air in concentrations 25-fold higher than prewaxing. Animal studies have shown that these fl uorine particles are quite toxic.37 Although exposure does not occur during exer- cise, it does occur on a daily basis beginning early in the skiers career, when lungs are susceptible to damage. This repeated exposure in combination with airway damage from high ven- tilation of cold dry air during competition and training may contribute to the airway dysfunction observed in Nordic ski- ers. Of course, the elite skier spends little time in the wax
  • 18. room, but young developing skiers do, since they wax their own skis until reaching the elite level. Consequently, there are many years of exposure to the developing lung on the path to becoming an elite-level skier. ATHLETE PERFORMANCE AND PM Inhalation of high levels of combustion-derived PM during exercise has been shown to result in reduced exercise perfor- mance during short-term maximal-intensity cycle ergometry.10 12 A single 6-min exercise bout in high PM failed to reduce exercise performance; however, a second 6-min of exercise in high PM 3 days after the fi rst resulted in decreased exercise performance. This observation supports a delayed infl am- matory effect from the initial exercise.12 In a separate study, decreased work accumulation was observed in a high-inten- sity 6-min cycle ergometer ride that immediately followed a 20-min high-PM exposure ride at 60% of estimated maxi- mal heart rate,10 suggesting that a rapid response can occur within a single 20-min exposure. In this study, low-PM (L) and high-PM groups (H) were randomised, but L and H pairs were exercised 1 day apart, to evaluate 24-h effect of exposure. Unlike the previous study,12 these results showed decreases in performance in both high-PM rides. This was thought to occur because the 20-min prework accumulation ride allowed time for a systemic infl ammatory response to occur, whereas the
  • 19. earlier study12 did not incorporate that pretime trial 20-min ride. The performance decreases from exercise in high emis- sion-generated PM air observed in those studies were about 5%12 and 3%, respectively (fi gure 7).10 The implications of these studies to the athlete competing in a high-air-pollution environment suggest that even a 20-min warm-up in high air pollution will have an impact on subsequent performance. Further, only one 6-min bout of exercise in high pollution may have a carryover effect that will decrease the performance in exercise 3 days later. Blunted fl ow-mediated dilatation from exercise in freshly generated four-cycle emission aerosols has been observed ( fi gure 8A).10 12 Signifi cant increases in pulmonary artery pres- sure after high-pollution exercise were also noted (fi gure 8B).10 Vascular function was correlated with exercise performance and accounted for as much as 24.4% of the decline in exercise performance. The <5% performance decrements are quite sig- nifi cant to the competing athlete. For example, all but the last place fi nisher in the 3000-m steeplechase at the 2008 Olympics were separated by less than 5%. These studies provide evi- dence that high-PM conditions are likely to affect athletic
  • 20. Figure 6 Measurements of PM1 at 10 ice rinks demonstrate signifi cant increases in particulate matter (PM1) after rinks were resurfaced by fossil-fuelled machines. Rinks using electric- powered machines showed no increase in PM1. Redrawn. 6 Figure 5 Signifi cant change in lung function (forced expiratory volume in 1 s (FEV1) and FEF25–75) of non-asthmatic subjects after 30-min of high-particulate matter (PM1) exercise was identifi ed. No change in lung function was noted from low-PM1 exposure exercise (p=0.0005 for FEV1 and p=0.002 for FEF25–75). Redrawn. 9 proximal ambient air (fi gure 6). As a result of this study, the Vancouver 2010 Olympic Games used electric-powered ice resurfacers to ensure acceptable air quality at all 2010 Olympic ice rinks.
  • 21. Recent papers examining ice-rink air quality31 and the relationship to EIB have associated the high prevalence of airway dysfunction in skating athletes to inhalation of PM1. 6 7 The 20% to 43% prevalence of EIB reported in fi gure skat- ers, hockey players and short-track-speed skaters32–34 is much higher than the estimated 10% asthma prevalence in the US and the reported prevalence for summer Olympic Games, ath- letes.35 Repeated ventilation of cold/dry air during sport train- ing and competition, combined with high levels of PM1, may enhance the expression of or directly cause EIB and airway damage. Long-term exposure can have signifi cant effects on resting airway function.6 7 Signifi cant decrease in FVC, FEV1 and FEF25–75 over a 3-year period of daily training in an ice rink with high PM1 from fossil-fuelled resurfacers in female hockey players has been identifi ed.6 The decline in FVC and 07_bjsports-2011-090823.indd 41007_bjsports-2011- 090823.indd 410 4/4/2012 4:24:03 PM4/4/2012 4:24:03 PM Review
  • 22. Br J Sports Med 2012;46:407–412. doi:10.1136/bjsports-2011- 090823 411 CONCLUSION Acute exposure to mixed exhaust aerosols during exercise can cause decreases in lung and vascular function in healthy and asthmatic subjects. Chronic exposure to mixed exhaust aerosols during exercise may result in decreased lung function and may promote vascular dysfunction, which appear to be related to increased airway and systemic oxidative stress. The physiological effects of high-intensity exercise in high levels of mixed exhaust aerosols support the observed compromised performance. Competing interests None. Provenance and peer review Commissioned; internally peer reviewed REFERENCES 1. Brook RD, Brook JR, Urch B, et al. Inhalation of fi ne particulate air pollution
  • 23. and ozone causes acute arterial vasoconstriction in healthy adults. Circulation 2002;105:1534–6. 2. Frampton MW. Does inhalation of ultrafi ne particles cause pulmonary vascular effects in humans? Inhal Toxicol 2007;19 Suppl 1:75–9. 3. Gauderman WJ, Vora H, McConnell R, et al. Effect of exposure to traffi c on lung development from 10 to 18 years of age: a cohort study. Lancet 2007;369:571–7. 4. Oberdörster G, Ferin J, Gelein R, et al. Role of the alveolar macrophage in lung injury: studies with ultrafi ne particles. Environ Health Perspect 1992;97:193–9. 5. Pietropaoli AP, Frampton MW, Hyde RW, et al. Pulmonary function, diffusing capacity, and infl ammation in healthy and asthmatic subjects exposed to ultrafi ne particles. Inhal Toxicol 2004;16 Suppl 1:59–72.
  • 24. competition. In a recent study which examined the times of the top three fi nishers in seven US marathons over the course of 8 to 28 years, performance decrements were associated with acute PM10 exposure among women but not men. 11 These fi nd- ings may suggest an even greater vulnerability among females and should be considered when making exercise recommenda- tions to this population. The response to PM0.1 inhalation 24 h after exposure in healthy humans demonstrated signifi cant increase in diastolic blood pressure, reduced heart rate variability and signifi cant impaired vasodilatation of the brachial artery.8 Likewise, near infrared spectroscopy demonstrated a decrease in the reoxy- genation slope after cuff ischaemia, suggesting a constrictive response in the microcirculation that supports a physiologically signifi cant decrease in blood fl ow that could affect exercise performance.8 The vascular dysfunction associated with PM inhalation suggests reasonable means by which PM inhalation may result in a cardiovascular incident due to the increased load on the heart. However, this added stress on the heart is not
  • 25. likely to result in a cardiovascular incident in the healthy pop- ulation, but may affect cardiac output and thus performance. Interestingly, just as LT receptor antagonists have been useful in the treatment of asthma, montelukast has been found to attenuate the vascular dysfunction associated with the bra- chial artery after PM inhalation.38 This protection against the vascular dysfunction associated with PM inhalation could potentially improve exercise performance in high-PM conditions. Figure 7 Short-term exercise performance as work accumulated in a 6-min all-out cycle ergometer ride in low-particulate matter (PM1) and high PM1. Note the signifi cant difference in performance in high PM1. Data were taken from two separate studies.10 12 Figure 8 (A, B) Pre-exercise and postexercise fl ow-mediated dilatation (FMD) of the brachial artery for four trials of 30-min cycle ergometry in low-particulate matter (PM) and high-PM-emission air. FMD was signifi cantly less for high-PM versus low-PM trials (p<0.05). Pre-exercise and postexercise pulmonary artery
  • 26. pressure was signifi cantly greater in high PM versus low PM (p<0.005). Redrawn.10 07_bjsports-2011-090823.indd 41107_bjsports-2011- 090823.indd 411 4/4/2012 4:24:03 PM4/4/2012 4:24:03 PM Review Br J Sports Med 2012;46:407–412. doi:10.1136/bjsports-2011- 090823412 23. Zielinski H, Mudway IS, Bérubé KA, et al. Modeling the interactions of particulates with epithelial lining fl uid antioxidants. Am J Physiol 1999;277:L719–26. 24. Al-Humadi NH, Siegel PD, Lewis DM, et al. Alteration of intracellular cysteine and glutathione levels in alveolar macrophages and lymphocytes by diesel
  • 27. exhaust particle exposure. Environ Health Perspect 2002;110:349–53. 25. Gaston B, Reilly J, Drazen JM, et al. Endogenous nitrogen oxides and bronchodilator S-nitrosothiols in human airways. Proc Natl Acad Sci USA 1993;90:10957–61. 26. Henderson EM, Gaston B. SNOR and wheeze: the asthma enzyme? Trends Mol Med 2005;11:481–4. 27. Que LG, Liu L, Yan Y, et al. Protection from experimental asthma by an endogenous bronchodilator. Science 2005;308:1618–21. 28. Zaman K, Hanigan MH, Smith A, et al. Endogenous S- nitrosoglutathione modifi es 5-lipoxygenase expression in airway epithelial cells. Am J Respir Cell Mol Biol 2006;34:387–93.
  • 28. 29. Rundell K W, Spiering BA, Baumann JM, et al. Bronchoconstriction provoked by exercise in a high-particulate-matter environment is attenuated by montelukast. Inhal Toxicol 2005;17:99–105. 30. Nurkiewicz TR, Porter DW, Barger M, et al. Systemic microvascular dysfunction and infl ammation after pulmonary particulate matter exposure. Environ Health Perspect 2006;114:412–19. 31. Rundell K W. High levels of airborne ultrafi ne and fi ne particulate matter in indoor ice arenas. Inhal Toxicol 2003;15:237–50. 32. Mannix ET, Farber MO, Palange P, et al. Exercise-induced asthma in fi gure skaters. Chest 1996;109:312–15. 33. Provost-Craig MA, Arbour KS, Sestili DC, et al. The incidence of exercise-
  • 29. induced bronchospasm in competitive fi gure skaters. J Asthma 1996;33:67–71. 34. Wilber RL, Rundell KW, Szmedra L, et al. Incidence of exercise-induced bronchospasm in Olympic winter sport athletes. Med Sci Sports Exerc 2000;32:732–7. 35. Weiler JM, Layton T, Hunt M. Asthma in United States Olympic athletes who participated in the 1996 Summer Games. J Allergy Clin Immunol 1998;102:722–6. 36. Hoffman MD, Clifford PS, Varkey B. Acute effects of ski waxing on pulmonary function. Med Sci Sports Exerc 1997;29:1379–82. 37. Oberdorster G, Gelein RM, Ferin J, et al. Association of particulate air pollution and acute mortality: involvement of ultrafi ne particles? Inhal Toxicol 1995;7:111–24.
  • 30. 38. Rundell K W, Steigerwald MD, Fisk MZ. Montelukast prevents vascular endothelial dysfunction from internal combustion exhaust inhalation during exercise. Inhal Toxicol 2010;22:754–9. 6. Rundell K W. Pulmonary function decay in women ice hockey players: is there a relationship to ice rink air quality? Inhal Toxicol 2004;16:117– 23. 7. Rundell K W, Spiering BA, Evans TM, et al. Baseline lung function, exercise- induced bronchoconstriction, and asthma-like symptoms in elite women ice hockey players. Med Sci Sports Exerc 2004;36:405–10. 8. Rundell K W, Hoffman JR, Caviston R, et al. Inhalation of ultrafi ne and fi ne particulate matter disrupts systemic vascular function. Inhal Toxicol
  • 31. 2007;19:133–40. 9. Rundell K W, Slee JB, Caviston R, et al. Decreased lung function after inhalation of ultrafi ne and fi ne particulate matter during exercise is related to decreased total nitrate in exhaled breath condensate. Inhal Toxicol 2008;20:1–9. 10. Cutrufello PT, Rundell KW, Smoliga JM, et al. Inhaled whole exhaust and its effect on exercise performance and vascular function. Inhal Toxicol 2011;23:658–67. 11. Marr LC, Ely MR. Effect of air pollution on marathon running performance. Med Sci Sports Exerc 2010;42:585–91. 12. Rundell K W, Caviston R. Ultrafi ne and fi ne particulate matter inhalation decreases exercise performance in healthy subjects. J Strength Cond Res
  • 32. 2008;22:2–5. 13. Chalupa DC, Morrow PE, Oberdörster G, et al. Ultrafi ne particle deposition in subjects with asthma. Environ Health Perspect 2004;112:879– 82. 14. Daigle CC, Chalupa DC, Gibb FR, et al. Ultrafi ne particle deposition in humans during rest and exercise. Inhal Toxicol 2003;15:539–52. 15. Campen MJ, Lund AK, Doyle-Eisele ML, et al. A comparison of vascular effects from complex and individual air pollutants indicates a role for monoxide gases and volatile hydrocarbons. Environ Health Perspect 2010;118:921– 7. 16. Larsson BM, Sehlstedt M, Grunewald J, et al. Road tunnel air pollution induces bronchoalveolar infl ammation in healthy subjects. Eur Respir J 2007;29:699–705. 17. McCreanor J, Cullinan P, Nieuwenhuijsen MJ, et al.
  • 33. Respiratory effects of exposure to diesel traffi c in persons with asthma. N Engl J Med 2007;357:2348–58. 18. Ferin J, Oberdörster G, Penney DP. Pulmonary retention of ultrafi ne and fi ne particles in rats. Am J Respir Cell Mol Biol 1992;6:535–42. 19. EPA. Particulate Matter. http://www.epa.gov/pm/index.html (accessed 1 September 2011). 20. Li N, Sioutas C, Cho A, et al. Ultrafi ne particulate pollutants induce oxidative stress and mitochondrial damage. Environ Health Perspect 2003;111:455–60. 21. Rundell K W, Caviston R, Hollenbach AM, et al. Vehicular air pollution, playgrounds, and youth athletic fi elds. Inhal Toxicol 2006;18:541–7. 22. Venkataraman C, Kao AS. Comparison of particle lung
  • 34. doses from the fi ne and coarse fractions of urban PM-10 aerosols. Inhal Toxicol 1999;11:151–69. 07_bjsports-2011-090823.indd 41207_bjsports-2011- 090823.indd 412 4/4/2012 4:24:05 PM4/4/2012 4:24:05 PM SHORT COMMUNICATION Global warming: is weight loss a solution? A Gryka, J Broom and C Rolland Centre for Obesity Research and Epidemiology, Faculty of Health and Social Care, Robert Gordon University, Aberdeen, UK The current climate change has been most likely caused by the increased greenhouse gas emissions. We have looked at the major greenhouse gas, carbon dioxide (CO2), and estimated the reduction in the CO2 emissions that would occur with the theoretical global weight loss. The calculations were based on our previous weight loss study, investigating the effects of a
  • 35. low-carbohydrate diet on body weight, body composition and resting metabolic rate of obese volunteers with type 2 diabetes. At 6 months, we observed decreases in weight, fat mass, fat free mass and CO2 production. We estimated that a 10 kg weight loss of all obese and overweight people would result in a decrease of 49.560 Mt of CO2 per year, which would equal to 0.2% of the CO2 emitted globally in 2007. This reduction could help meet the CO2 emission reduction targets and unquestionably would be of a great benefit to the global health. International Journal of Obesity (2012) 36, 474–476; doi:10.1038/ijo.2011.151; published online 26 July 2011 Keywords: global warming; carbon dioxide; weight loss Introduction Climate change resulting from the mean rise in temperature over the last 100 years has been widely discussed.1 It has been accepted by the majority of scientists that the change is being caused by the anthropogenic increase in greenhouse gas
  • 36. emissions. Greenhouse gases in the atmosphere impair the earth’s cooling processes, which results in the global rise in temperature.1 The major greenhouse gas is carbon dioxide (CO2), which mostly comes from burning of fossil fuels (gas, oil, coal and other solid fuels). Other sources of CO2 emissions include iron and steel production, cement manufacture, solid waste combustion or petrochemical production. In 2007, burning of fossil fuels and cement manufacture caused emission of 30 649.36 Mt CO2 globally. 2 Across the world, fossil fuels are combusted to provide energy to generate electricity, for transport, business, agriculture and industry. If the current emissions are not reduced, the global temperature
  • 37. may rise by 2–7 1C by the end of the century, depending on the models used.3 This in turn may cause the extinction of many species, irreversible changes in the ecosystems and environmental disasters like storms, wildfires, droughts or floods. Such prognoses bring governments to set targets for the reduction of CO2 production and support the search for alternative energy sources. Humans, apart from indirectly producing CO2 through the use of fossil fuels and the industry, also produce CO2 during respiration. Consequently, global CO2 emissions depend on the size of the population. In addition, due to the fact that CO2 production is proportionate to body mass, heavier individuals produce more (based on our data, for
  • 38. every kg of body mass lost, resting metabolic rate (RMR) dropped by about 18 kcal per day and there was a 1% reduction in CO2 produced). The post-industrial changes to human lifestyle and diet have resulted in an obesity epidemic. Although the knowledge of obesity mechanisms is quickly expanding and novel obesity treatments are being developed, the situation on a world population level has not improved. With the countless unsuccessful efforts to tackle the obesity problem, it is more and more evident that the global modification of today’s lifestyles and environ- ments may be the only possible solution to the obesity epidemic.
  • 39. In light of the growing literature on the link between obesity, type 2 diabetes (T2DM), coronary artery diseases and climate change,4–8 we thought it would be interesting to discuss the effect of the global reduction of body mass, in particular of those individuals who are obese and overweight on worldwide CO2 emissions. It is clear that an omnipresent weight loss of all obese and overweight population is as improbable in the short term as global warming is inevitable if no action is taken. However, it is essential to model the effect of population weight loss on CO2 emissions. We have assumed a 10 kg weight loss, based on our observations as well as other studies using a low carbohydrate diet for a 6-month period.9
  • 40. Received 17 December 2010; revised 2 June 2011; accepted 24 June 2011; published online 26 July 2011 Correspondence: Dr C Rolland, Centre for Obesity Research and Epidemiology, Faculty of Health and Social Care, Robert Gordon University, St Andrew Street, Aberdeen, AB25 1HG UK. E-mail: [email protected] International Journal of Obesity (2012) 36, 474– 476 & 2012 Macmillan Publishers Limited All rights reserved 0307- 0565/12 www.nature.com/ijo http://dx.doi.org/10.1038/ijo.2011.151 mailto:[email protected] http://www.nature.com/ijo
  • 41. Methods The calculations in the current paper are based on an observed decrease of resting metabolic rate that occurred with weight loss in our recent study. The intervention involved 6 months on a low-carbohydrate, high-protein diet and included 25 obese volunteers (13 females, 12 males) with poorly controlled (glycated haemoglobin (HBA)1c47.5%) T2DM (ISRCTN20400186). CO2 production and body com- position were assessed at baseline and 6 months. The CO2 production was measured using the Quark RMR (Cosmed, Rome, Italy). Body composition was measured by air- displacement plethysmography (Bod Pod, Life Measurement Inc., Concord, CA, USA). The majority of the variables were not normally distributed; hence, the Wilcoxon signed-rank
  • 42. test was used to investigate the 6-month changes in weight, fat mass (FM), fat-free mass (FFM) and CO2 production. Analyses were performed with SPSS, version 17.0 (SPSS Inc., Chicago, IL, USA). Results and calculations The dietary composition of participants on a low-carbohy- drate/high-protein diet is outlined in Table 1. As expected, the total energy of the diet was significantly lower during the study than at baseline. According to our recommendations, the total amount of carbohydrate, both as grams per day and as a percent of daily total energy, was lower during the study than at baseline. Additionally, the amount of protein
  • 43. increased from 22% to about 30% of total energy levels, but did not change when expressed in grams per day. After 6 months of the weight loss programme, we observed a decrease in weight, FM, FFM and CO2 production (Table 2). The 6-month change in CO2 production was positively correlated with the changes in weight (r¼0.506; P¼0.0.12) and FM (r¼0.517; P¼0.011). The majority of weight lost was attributed to a decrease in FFM (Table 2), reflecting the higher protein content of the diet, which was about 30% of energy intake (Table 1). Weight loss achieved by implement- ing a normal- or a low-protein diet (that is, 10–15% of energy), could perhaps induce a higher loss of FFM than a high-protein diet. Consequently, such a diet would cause an even bigger drop in RMR and CO2 production, but would not
  • 44. be beneficial to the health of the individual losing weight. On the basis of the current data, for every 1 kg of body mass lost, the CO2 production would decrease 3.2 ml min �1. Therefore, an individual who lost 10 kg would produce 32 ml of CO2 less every minute. This would equal to 168 12 l (33.04 kg) of CO2 less in a year, compared with what would be produced without weight loss. In 2008, the global number of obese and overweight adults over 20 years old was 1.5 billion.10 If all those individuals lost 10 kg and sustained it for a year, the reduction in CO2 emissions would be 49.56 Mt CO2 per year. This would equate to 0.2% of CO2 emitted globally in 2007 by burning of fossil fuels and the
  • 45. manufacture of cement.2 Analogously, a 5-kg weight loss of all overweight and obese people would reduce global CO2 emissions by only 0.1%. Discussion Our calculations have shown that a 10-kg weight loss of all overweight and obese people would translate into a 0.2% Table 1 Changes in diet composition during the low- carbohydrate/ high-protein weight loss programme (n¼25) Baseline 6 months Change P-valuea Energy Kcal 1845±74 1194±21 �594±600 0.001 Carbohydrate
  • 46. g per day 164±69 50±25 �108±74.1 o0.001 % Total energy 41±9 22±11 �17.8±12.0 o0.001 Protein g per day 87±33 79±28 �5.3±32.2 0.882 % Total energy 22±7 30±8 7.9±7.5 o0.001 Fat g per day 80±44 68±20 �16.4±37.1 0.573 % Total energy 38.5 50.0 10.0±13.9 0.015 Values are expressed as mean±s.d. aSignificance level of the difference between baseline and 6 months, Wilcoxon signed-rank test. Table 2 Changes in weight, fat mass, fat-free mass, resting metabolic rate and CO2 production, during the low-carbohydrate/high-protein weight loss programme (n¼25)
  • 47. Baseline 6 months Change P-valuea Weight (kg) Males (n¼12) 117.7±19.5 108.0±20.9 �9.7±6.4 0.001 Females (n¼13) 104.6±22.2 94.2±22.1 �10.4±7.8 o0.001 Total 110.9±21.6 100.8±22.2 �10.1±7.0 o0.001 FM (kg) Males 50.3±13.0 41.1±12.9 �9.2±5.2 o0.001 Females 54.1±17.6 45.7±19.8 �8.8±7.8 0.001 Total 52.4±15.7 43.4±16.5 �9.0±6.5 o0.001 FFM (kg) Males 67.3±11.8 67.0±12.0 �0.3±1.7 0.266 Females 50.5±7.4 49.3±7.3 �1.6±1.4 o0.001 Total 59.0±12.8 58.1±13.3 �0.9±1.7 0.001 RMR (kcal per day) Males 2267±451 2033±420 �234±181 0.001 Females 1845±428 1572±345 �274±306 0.002 Total 2048±81 1793±442 �254±250 o0.001
  • 48. CO2 production (ml min �1) Males 258±56 220±45 �37±33 0.001 Females 201±47 173±42 �27±37 0.013 Total 226±58 195±50 �31±34 o0.001 Abbreviations: FFM, fat-free mass; FM, fat mass; RMR, resting metabolic rate. Values are expressed as mean±s.d. aSignificance level of the difference between baseline and 6 months, Wilcoxon signed ranks test. Global warming and weight loss A Gryka et al 475 International Journal of Obesity reduction in the global CO2 emissions. This percentage
  • 49. seems small; however, we have looked at personal produc- tion only. Had we accounted for additional reductions in CO2 emissions that would likely accompany weight loss, for example decreases in transport costs, and smaller amounts of food consumed as suggested by Edwards and Roberts,11 the total estimated decreases in CO2 production would have been greater. It could also be argued that the decrease in CO2 production, which accompanies weight loss, would mimic the benefits of decreasing global population. The theoretical global weight loss would also be of great health benefit; halving the risks of developing T2DM and obesity-related cancers, improving glycemic control in those with T2DM, and finally improving blood pressure and lipid
  • 50. profiles.12 Such changes would bring the significant reduc- tions of healthcare costs and also improvements in general quality of life. The targets for CO2 emissions, as specified in the Kyoto Protocol Reference Manual, vary for different countries and regions of the world. The UK Low Carbon Transition Plan suggests lowering the emissions by 18% from the 2008 levels, or 95.9 Mt CO2 per year, by 2020. 13 A 10-kg weight loss of all overweight and obese in the UK would account for over 1% of the CO2 emission reduction target by 2020. 14–16 This estimation was only possible when a number of
  • 51. assumptions were made. First, we assumed that weight loss in overweight people would result in the same change in FM and CO2 production as in the obese. Second, we assumed that obese and overweight, but otherwise healthy people, would show the same change in CO2 production with weight loss, as did obese people with T2DM. Finally, it has been shown that people with T2DM have higher RMR than those without,17 and therefore, our calculations may be slightly overestimated. However, if significant loss of FFM occurred with weight loss (as may be the case with normal- or low- protein diets), the decrease in RMR could have been higher, in which case the current estimations would underestimate it. Present calculations were not designed to accurately
  • 52. reflect potential impact of global weight loss on climate disruption, but to signal an opportunity for addressing individual, global and environmental benefits of weight loss. Health and climate change issues seem to be closely related in the perspective of our future. We agree with Wilkinson et al.,18 who stated that policies to reduce carbon emissions and climate change will improve health and well- being of the people. The opposite should also be true; tackling lifestyle-related health problems should have a positive effect on the environment. Universal moderate weight loss of the overweight and obese would result in an equivocal influence on the world carbon emissions with
  • 53. possible effects on climate disruption. Nevertheless, this relatively small amount could help to meet the CO2 emission reduction targets and unarguably would be of great benefit to the human’s health. Moreover, the shift from seeing weight loss as beneficial for an individual’s health to also being beneficial for the planet may change attitudes toward healthy lifestyle. If such benefits were persuasive to govern- ments across the world, a significant impact on global warming might be achieved as a consequence. Conflict of interest The authors declare no conflict of interest. Acknowledgements We thank A Stewart for reading of the manuscript and
  • 54. critical comments. The study of low-carbohydrate diet was supported by the Go Lower Company. References 1 HM Government. Climate change. HM Government, 2009, http:// www.direct.gov.uk/en/Environmentandgreenerliving/Thewider environment/Climatechange/index.htm. 2 The World Bank. World Development Indicators. CO2 emissions (kt) (Online). The World Bank: Washington, DC, 2011. Available at http://data.worldbank.org (Last updated 4 October 2010). 3 Met Office. Climate change F your essential guide. Report No.: 09/0050. Met Office: Exeter, Devon, UK, 2009. 4 Faergeman O. Climate change and preventive medicine. Eur J Cardiovasc Prev Rehabil 2007; 14: 726–729. 5 Shea KM. Climate change: public health crisis or opportunity.
  • 55. J Public Health Manag Pract 2008; 14: 415–417. 6 Delpeuch F, Maire B, Monnier E, Holdsworth M. Globesity. A Planet Out of Control? 2009. Earthscan: London. 7 Mawle A. Climate change, human health, and unsustainable development. J Public Health Policy 2010; 31: 272–277. 8 Egger G, Swinburn B. Planet Obesity. We Are Eating Ourselves and The Planet to Death 2010. Allen & Unwin: Crows Nest. 9 Hession M, Rolland C, Kulkarni U, Wise A, Broom J. Systematic review of randomized controlled trials of low-carbohydrate vs low-fat/low-calorie diets in the management of obesity and its comorbidities. Obes Rev 2009; 10: 36–50. 10 World Health Organization. Obesity and Overweight. Fact sheet No. 311. WHO: Geneva, 2011. Available at http://www.who.int/ mediacentre/factsheets/fs311/en/index.html. 11 Edwards P, Roberts I. Population adiposity and climate change.
  • 56. Int J Epidemiol 2009; 38: 1137–1140. 12 Turner H, Wass J. Oxford Handbook of Endocrinology and Diabetes. Oxford University Press: Oxford, 2002. 13 HM Government. The UK Low Carbon Transition Plan. National Strategy for Climate and Energy. HM Government, The Stationery Office: Norwich, 2009. 14 Office for National Statistics. News Release: UK Population Approaches 62 Million. Crown Copyright: Newport, 2010. 15 The Scottish Government. Scottish Health Survey 2008. The Scottish Government: Edinburgh, 2009. 16 The NHS Information Centre. Health Survey for England 2008 Volume 1: Physical Activity and Fitness. The NHS Information Centre: Leeds, 2009. 17 Bitz C, Toubro S, Larsen TM, Harder H, Rennie KL, Jebb SA et al.
  • 57. Increased 24-h energy expenditure in type 2 diabetes. Diab Care 2004; 27: 2416–2421. 18 Wilkinson RG, Pickett KE, De Vogli R. Equality, sustainability, and quality of life. BMJ 2010; 341: c5816. Global warming and weight loss A Gryka et al 476 International Journal of Obesity http://www.direct.gov.uk/en/Environmentandgreenerliving/The widerenvironment/Climatechange/index.htm http://www.direct.gov.uk/en/Environmentandgreenerliving/The widerenvironment/Climatechange/index.htm http://www.direct.gov.uk/en/Environmentandgreenerliving/The widerenvironment/Climatechange/index.htm http://data.worldbank.org http://www.who.int/mediacentre/factsheets/fs311/en/index.html http://www.who.int/mediacentre/factsheets/fs311/en/index.html
  • 58. Reproduced with permission of the copyright owner. Further reproduction prohibited without permission. c.ijo2011151a.pdfGlobal warming: is weight loss a solutionquestIntroductionMethodsResults and calculationsDiscussionTable 1 Changes in diet composition during the low-carbohydrate/high-protein weight loss programme (n=25)Table 2 Changes in weight, fat mass, fat-free mass, resting metabolic rate and CO2 production, during the low-carbohydrate/high-protein weight loss programme (n=25)Conflict of interestAcknowledgementsReferences HYPOTHESIS AND THEORY published: 19 December 2017 doi: 10.3389/fpsyg.2017.02196 Frontiers in Psychology | www.frontiersin.org 1 December 2017 | Volume 8 | Article 2196 Edited by: Sergio Machado,
  • 59. Salgado de Oliveira University, Brazil Reviewed by: Ludovic Seifert, Université de Rouen, France Itay Basevitch, Anglia Ruskin University, United Kingdom *Correspondence: M. Teresa Anguera [email protected] Specialty section: This article was submitted to Movement Science and Sport
  • 60. Psychology, a section of the journal Frontiers in Psychology Received: 01 September 2017 Accepted: 04 December 2017 Published: 19 December 2017 Citation: Anguera MT, Camerino O, Castañer M, Sánchez-Algarra P and Onwuegbuzie AJ (2017) The Specificity of Observational Studies in Physical Activity and Sports Sciences: Moving Forward in Mixed Methods
  • 61. Research and Proposals for Achieving Quantitative and Qualitative Symmetry. Front. Psychol. 8:2196. doi: 10.3389/fpsyg.2017.02196 The Specificity of Observational Studies in Physical Activity and Sports Sciences: Moving Forward in Mixed Methods Research and Proposals for Achieving Quantitative and Qualitative Symmetry M. Teresa Anguera1*, Oleguer Camerino2, Marta Castañer2, Pedro Sánchez-Algarra3 and Anthony J. Onwuegbuzie4, 5 1 Faculty of Psychology, Institute of Neurosciences, University of Barcelona, Barcelona, Spain, 2 INEFC (National Institute of Physical Education of Catalonia), IRBLLEIDA (Lleida Institute for Biomedical Research Dr. Pifarré Foundation), University of
  • 62. Lleida, Lleida, Spain, 3 Department of Statistics, Faculty of Biology, University of Barcelona, Barcelona, Spain, 4 Department of Educational Leadership and Counseling, Sam Houston State University, Huntsville, TX, United States, 5 Faculty of Education, University of Johannesburg, Johannesburg, South Africa Mixed methods studies are been increasingly applied to a diversity of fields. In this paper, we discuss the growing use—and enormous potential—of mixed methods research in the field of sport and physical activity. A second aim is to contribute to strengthening the characteristics of mixed methods research by showing how systematic observation offers rigor within a flexible framework that can be applied to a wide range
  • 63. of situations. Observational methodology is characterized by high scientific rigor and flexibility throughout its different stages and allows the objective study of spontaneous behavior in natural settings, with no external influence. Mixed methods researchers need to take bold yet thoughtful decisions regarding both substantive and procedural issues. We present three fundamental and complementary ideas to guide researchers in this respect: we show why studies of sport and physical activity that use a mixed methods research approach should be included in the field of mixed methods research, we highlight the numerous possibilities offered by observational methodology in this field
  • 64. through the transformation of descriptive data into quantifiable code matrices, and we discuss possible solutions for achieving true integration of qualitative and quantitative findings. Keywords: systematic observation, qualitative recording transformation, qualitative-quantitative integration, qualitative-quantitative symmetry, sport and physical activity sciences Diverse substantive areas have increasingly found their way into the expanding epistemological and methodological arsenal applied in mixed methods research in recent years (Ivankova and Kawamura, 2010). Mixed methods studies have been defined by several authors as studies aiming to integrate qualitative and quantitative elements. Johnson et al. (2007, p. 123), after analyzing 19 definitions provided by experts in the field, proposed the following definition: “Mixed methods research is the type of research in which a researcher or team of
  • 65. researchers combines elements https://www.frontiersin.org/journals/psychology https://www.frontiersin.org/journals/psychology#editorial-board https://www.frontiersin.org/journals/psychology#editorial-board https://www.frontiersin.org/journals/psychology#editorial-board https://www.frontiersin.org/journals/psychology#editorial-board https://doi.org/10.3389/fpsyg.2017.02196 http://crossmark.crossref.org/dialog/?doi=10.3389/fpsyg.2017.0 2196&domain=pdf&date_stamp=2017-12-19 https://www.frontiersin.org/journals/psychology https://www.frontiersin.org https://www.frontiersin.org/journals/psychology#articles https://creativecommons.org/licenses/by/4.0/ mailto:[email protected] https://doi.org/10.3389/fpsyg.2017.02196 https://www.frontiersin.org/articles/10.3389/fpsyg.2017.02196/f ull http://loop.frontiersin.org/people/213753/overview http://loop.frontiersin.org/people/350236/overview http://loop.frontiersin.org/people/329641/overview http://loop.frontiersin.org/people/505754/overview Anguera et al. Observation in Sport and Physical Activity
  • 66. Sciences of qualitative and quantitative research approaches (e.g., use of qualitative and quantitative viewpoints, data collection, analysis, inference techniques) for the broad purposes of breadth and depth of understanding and corroboration.” Empirical studies undertaken in the field of sport and physical activity have traditionally largely overlooked the methodological— and epistemological—opportunities offered by mixed methods research designs, but a growing number of studies in the field of sport and physical activity have shown the enormous potential that these designs offer for studying behaviors related to individual performance (Camerino et al., 2012c; Iglesias and Anguera, 2012), team performance (Camerino et al., 2012b,c,d,e), use of laterality and motor skills (Castañer et al., 2012), and use of sports facilities by children (Pérez-López et al., 2016), to name but a few examples. Settings of this type contain an enormous conceptual richness to be explored and methodologically captured, and we believe that the time has come to build on lessons learned and continue to move forward. Although observation and other sources of data have been
  • 67. given some attention in the mixed methods research literature, few researchers have applied true observational research methods. Systematic observation is a scientific procedure for analyzing perceivable behaviors that occur spontaneously in a natural setting (Bakeman and Gottman, 1997; Anguera, 2003). In recent years, however, there has been a surge in the number of empirical studies involving the application of mixed methods research designs rooted in systematic observation in the field of sport and physical activity (Camerino et al., 2012a; Anguera et al., 2014). For this reason we believe that it is time to reconsider studies that apply systematic observation through a mixed method design in sport and physical activity. Examples include shots in soccer (Maneiro et al., 2017), handball (Freitas et al., 2010), or basketball (Fernández et al., 2009), corner kicks and throw-ins (Casal et al., 2015), symmetry of actions and reactions in fencing (Tarragó et al., 2017), maneuvers in synchronized swimming (Rodríguez-Zamora et al., 2014), errors in judo (Gutierrez-Santiago et al., 2013), pace during track events (Aragón et al., 2017), influence of ball size on children’s performance in basketball (Lapresa et al., 2013a), use of gestures and signals by coaches and physical education teachers (Castañer et al., 2013), and compliance with rules and regulations, which themselves serve as a reference framework. The key to
  • 68. accurately capturing these realities lies in the application of an observational methodology that consists of the following successive stages: construction of an ad-hoc observation instrument, computerized recording and coding of behaviors observed, data quality control, and quantitative analysis of resulting datasets using adequate techniques for obtaining structured categorical data (in particular, lag sequential analysis, polar coordinate analysis, and T-pattern detection). Each of these techniques is governed by methodological rigor and scientific logic (Portell et al., 2015a). Many studies portrayed as representing mixed methods research studies are constrained by diverse methodological shortcomings. However, in our opinion, there are two major ones: inadequate integration of qualitative and quantitative data and a lack of symmetry between the two approaches. Greater symmetry between quantitative and qualitative approaches is methodologically desirable given the need to merge both perspectives, although there are obviously situations in which a greater emphasis on one approach or another is preferable (Sandelowski et al., 2009). There are two distinct approaches to asymmetry within the theoretical
  • 69. framework. The first is a phenomenological approach, or more specifically, an “enactive or radical-embodiment” approach to the neuroscience of consciousness (Thompson and Varela, 2001; Lutz et al., 2002). This approach involves integrating first- person (phenomenological) data with neuroimaging data in order to explore the mutual constraints between these two types of data described in a different manner. The phenomenological approach is used in cluster trials where physiological data are obtained from participants in experimental situations. The second approach, traditionally viewed as more complex, is the successful mixing of qualitative and quantitative elements. We believe that the complexity of this approach lies in the nature of the data involved and it requires robust solutions to strike a balance between the qualitative and quantitative elements. Researchers of systematic observation in the field of sport and physical exercise fundamentally draw their data from what could be considered exemplary sources, namely video or sound recordings of behaviors (i.e., direct observation; Anguera, 2003) and narratives from in-depth interviews (i.e., indirect observation; Morales-Sánchez et al., 2014; Anguera et al., 2017). Less frequently, they use elicited responses (i.e., responses to
  • 70. structured or semi-structured interviews –Arias and Anguera, 2017- or questionnaires), simulated data (Manolov and Losada, 2017), and physiological data (Zurutuza et al., 2017). Our aim in this article, then, is to provide guidance on how to resolve two of the main shortcomings that undermine mixed methods research in the field of sport and physical activity—integration and symmetry of qualitative and quantitative data—and to show how these solutions could be extrapolated to other fields. In the following sections, we discuss three fundamental concepts with the aim of contributing to the ongoing dialog in mixed methods research and helping this field to advance. SPORT AND PHYSICAL ACTIVITY AS A NEW SUBSTANTIVE AREA IN MIXED METHODS RESEARCH In the late 1990s, Biddle (1997) found very little diversity in research methods used in empirical studies in two of the most prestigious sport and physical activity journals he chose to study—The Journal of Sport and Exercise Psychology (JSEP), a leading research journal in the field, and The International Journal of Sport Psychology (IJSP), which was the first journal in this field. Most of the quantitative research was based on regression techniques and discriminant analysis, while most of the qualitative research drew on interviews and content
  • 71. analysis. During the same period, Morris (1999) reported that observational and case studies accounted for just 2% of scientific production in this field between 1979 and 1998. In a study published shortly afterwards, Biddle et al. (2001) presented a detailed analysis of the methods used in both Frontiers in Psychology | www.frontiersin.org 2 December 2017 | Volume 8 | Article 2196 https://www.frontiersin.org/journals/psychology https://www.frontiersin.org https://www.frontiersin.org/journals/psychology#articles Anguera et al. Observation in Sport and Physical Activity Sciences quantitative and qualitative sport and exercise psychology research, with a focus on discriminant analysis, hierarchical regression, stepwise statistical procedures (although it should be noted that stepwise procedures have been debunked by numerous statisticians; cf. Thompson, 1995; Onwuegbuzie and Daniel, 2003), and meta-analysis in the area of quantitative
  • 72. research and thematic analysis (mostly interviews) in the area of qualitative research. Biddle et al. (2001) words were particularly enlightening: The extent to which such diverse approaches could or should be integrated is a matter for the reader to decide. Some have stated that qualitative and quantitative approaches reflect fundamentally different paradigms, such as when people refer to qualitative vs. quantitative methods. Although there are obvious differences in the two approaches, there are many cases when the two are combined. (p. 778) As we will discuss in the last section, one of the main shortcomings of studies that involve an attempt to combine the two approaches is the failure to successfully integrate qualitative and quantitative data. This is consistent with Bazeley’s (2010) conclusion that “there are surprisingly few published studies reporting results from projects which make more than very elementary use of the capacity to integrate data and analyses using computers” (p. 434). True integration in applied studies is not easy task, but the aim of this paper is to show how a novel methodological approach grounded within systematic
  • 73. observation can help to overcome some of the challenges involved. Based on our experience and work, we can now confidently state that the “multifaceted” perspective (Tashakkori and Teddlie, 2010, p. 274) offered by a mixed methods research approach (Johnson et al., 2007) is now widely present in the field of sport and physical activity (van der Roest et al., 2015). An optimal approach would be to take a wide-angle perspective while resisting the temptation to pose an overly broad research question, with the ultimate aim of making future research more effective. To gain a better perspective on the use of mixed methods research in sports and physical activity studies worldwide, we conducted what Alise and Teddlie (2010) refer to as prevalence rate studies, which represents “a line of inquiry into research methods in the social/behavioral sciences [referring to the proportion of articles using a particular methodological approach]” (p. 104), which is undertaken by assessing (a) the prevalence rates of MM [mixed methods] in those fields and (b) the degree to which disciplines are still dominated by the traditional postpositivist QUAN [quantitative] approaches” (p. 107). Specifically, we performed a literature search of ISI-
  • 74. indexed journals in the Web of Science and the ISI Web of Knowledge (Journal Citation Reports) to determine the number of articles applying a mixed methods research approach in this field. We placed no restrictions on language, year, or geographic location. Table 1 presents a list of the journals analyzed, together with their JCR impact factor and the number of articles that used mixed methods research approaches. They key search term used was mixed methods and we did not place any limits on publication dates, although our results show that the majority of articles retrieved were published after the year 2000. Our findings show that, compared with the situation described by Biddle (1997) and Morris (1999), a considerable number of ISI-indexed journals now publish mixed methods research studies. We have included all studies that, based on their keywords, can be considered mixed methods studies from the time the mixed methods movement emerged. The results from the last 15 years highlight the growing number of mixed methods studies published in the field of sport and physical activity. These studies include a considerable
  • 75. number of conceptual and methodological papers on different aspects of mixed methods, which have undoubtedly contributed to the growth of applied empirical studies in this area. Indeed, the 203 mixed methods research articles identified among this set of 67 journals yielded a mean of 3.03 mixed methods research articles (SD = 4.98). This represents an important advance, not only because of the increase in studies of this type, but also because it shows that prestigious peer-reviewed journals are now publishing these studies. INCLUSION OF PURELY OBSERVATIONAL SPORTS AND PHYSICAL ACTIVITY STUDIES IN THE FIELD OF MIXED METHODS RESEARCH Studies in the field of sport and physical activity frequently address immediate research concerns that require a scientific answer to questions related to multiple aspects of learning, training, and performance. Such realities are multifaceted in any field, but we are referring to the specific—and possibly unique— case of studies in which the primary and often the only goal is to capture what is actually happening, with no regard for the
  • 76. administration of standardized tests or the opinions or feelings of the agents involved. Studies in the field of sport and physical activity provide numerous examples of such cases, which, due to their singularity, we believe deserve special consideration (Castañer et al., 2013). Let us imagine, for example, that we are interested in studying the suitability of a certain tactic in an elite individual or team competition (e.g., a judo or soccer match). A fitting research design would be systematically to observe the athlete’s behavior (systematic direct observation) and to conduct an in-depth interview with the athlete and/or his or her trainer after the event (indirect observation). Logically, the responses given by the athlete or trainer might be different to the information portrayed by the video recording (referred by Greene et al., 1989; as initiation, which involves discovering paradoxes and contradictions that emerge when findings from the two analytical strands are compared), because opinions regarding performance can understandably vary and can be elaborated on in an interview situation. To meet the goal of our study, we would need to merge the quantitative and qualitative findings by comparing the results
  • 77. of the interview (presuming that these are purely qualitative) with the information captured in the video recordings (as annotation of the behaviors observed in the successive images analyzed Frontiers in Psychology | www.frontiersin.org 3 December 2017 | Volume 8 | Article 2196 https://www.frontiersin.org/journals/psychology https://www.frontiersin.org https://www.frontiersin.org/journals/psychology#articles Anguera et al. Observation in Sport and Physical Activity Sciences TABLE 1 | Publication of mixed methods research studies in ISI-Indexed sports and physical activity journals. Journal JCR Impact factor Number of Mixed methods
  • 78. articles, no. Adapted Physical Activity Quarterly 1.324 2 American Journal of Sports Medicine 4.362 2 British Journal of Sports Medicine 5.025 4 Clinical Journal of Sport Medicine 2.268 2 Current Sports Medicine Reports 1.552 0 European Journal of Sport Science 1.550 2 European Physical Education Review 0.673 12 European Review of Aging and Physical Activity 0.676 0 Exercise and Sport Sciences Reviews 4.252 0 Gait and Posture 2.752 0
  • 79. Human Movement Science 1.598 0 Health Education Research 1.574 16 International Journal of the History of Sport 0.258 0 International Journal of Performance Analysis in Sport 0.798 1 International Journal of Sport Nutrition and Exercise Metabolism 2.442 0 International Journal of Sport Finance 0.385 0 International Journal of Sport Psychology 0.485 3 International Journal of Sports Medicine 2.065 0
  • 80. International Journal of Sports Physiology and Performance 2.662 1 International Journal of Sports Science and Coaching 0.480 0 International Review for the Sociology of Sport 0.953 1 International Review of Sport and Exercise Psychology 4.526 0 Isokinetics and Exercise Science 0.488 0
  • 81. Journal of Aging and Physical Activity 1.966 5 Journal of Applied Biomechanics 0.984 0 Journal of Applied Sport Psychology 1.062 3 Journal of Athletic Training 2.017 7 Journal of Biomechanics 2.751 0 Journal of Electromyography and Kinesiology 1.647 0 Journal of Exercise Science and Fitness 0.333 1 Journal of Human Kinetics 1.029 0 Journal of Motor Behavior 1.418 0 Journal of Physical Activity and Health 2.090 8
  • 82. Journal of Science and Medicine in Sport 3.194 3 Journal of Sports Science and Medicine 1.025 3 Journal of Sports Sciences 2.246 5 Journal of Teaching in Physical Education 1.021 7 Journal of Science and Medicine in Sport 3.194 3 Journal of Sport and Exercise Psychology 2.185 12 Journal of Sport and Social Issues 0.571 0 Journal of Sport Management 0.718 7 Journal of Sport Rehabilitation 1.276 2 (Continued) TABLE 1 | Continued Journal JCR Impact factor Number of Mixed methods
  • 83. articles, no. Journal of Sports Medicine and Physical Fitness 0.972 0 Journal of Sports Science and Medicine 1.025 3 Journal of Teaching in Physical Education 1.021 7 Journal of Strength and Conditioning Research 2.075 4 Kinesiology 0.585 1 Medicine and Science in Sports and Exercise
  • 84. 3.983 5 Medicina dello Sport 0.235 0 Motor Control 1.233 0 Pediatric Exercise Science 1.452 0 Perceptual and Motor Skills 0.546 1 Physical Education and Sport Pedagogy 0.811 6 Physical Therapy in Sport 1.653 0 Proceedings of the Institution of Mechanical Engineers Part P-Journal of Sports Engineering and Technology 0.885 0 Psychology of Sport and Exercise 1.896 7 Quality and quantity 0.720 32
  • 85. Quest 1.017 1 Research in Sports Medicine 1.704 0 Research Quarterly for Exercise and Sport 1.566 9 Revista Internacional de Medicina y Ciencias de la Actividad Fisica y del Deporte 0.146 0 Revista de Psicología del Deporte 0.487 5 Scandinavian Journal of Medicine and Science in Sports 2.896 4 Sociology of Sport Journal 0.750 0
  • 86. Sport Education and Society 1.288 5 Sports Biomechanics 1.154 0 Sports Medicine 5.038 1 Total Number of Articles − 203 produces a systematized, quantifiable dataset built through the coding of data guided by a structured ad-hoc observation instrument). Although interviews as a research method can sometimes raise concerns due, for example, to doubts about sample representativeness (Sandelowski, 1995; Onwuegbuzie, 2003), this is not the case in the example described. The issue of interviews in observational methodology studies of sport and physical activity is very different, and poses more serious questions, as illustrated by the following example. Let us now imagine that we are studying the fouls committed by an athlete in a competition. If we did not modify our
  • 87. approach, we would be contrasting a visual record of what actually happened with the athlete’s interpretation of what happened, with the additional risk that this interpretation could be tainted by considerable cognitive baggage. If the purpose of the study is to analyze the fouls committed by an athlete, what use is it for the Frontiers in Psychology | www.frontiersin.org 4 December 2017 | Volume 8 | Article 2196 https://www.frontiersin.org/journals/psychology https://www.frontiersin.org https://www.frontiersin.org/journals/psychology#articles Anguera et al. Observation in Sport and Physical Activity Sciences athlete to say that he or she did not commit the foul if we have an image showing the contrary? The discrepancies between the two realities could be considerable, both in volume and nature, but that aside, we do not actually need the opinion of the athlete, because the answer to our research question lies in the analysis
  • 88. of fragments of what actually happened. This issue becomes even more complicated if we decide to include quantitative data, such as distances covered, number of steps taken, or heart rate, or if we administer a personality test before and after the competition, because none of this information can shed light on our research question or enrich our findings. In our opinion, the ideal solution for situations like this (which are very common) is to apply the successive steps defined within observational methodology. These include selecting dimensions and subdimensions designed to answer the research question, taking decisions on segmentation of the observable date into units, proposing a design for each research objective, building a purpose-designed observation instrument, creating a computerized coded dataset that allows the data to be arranged into matrices of codes, checking the reliability and variability of the data collected, and analyzing the behavioral patterns hidden within the code matrices using robust analytical techniques for categorical data. Systematic observation is the main procedure used to collect data in event analysis (Happ et al., 2004) and there
  • 89. is ample experience with its use and evidence of its potential (Anguera, 1979, 2003; Portell et al., 2015b). The study of spontaneous behavior is characterized by a richness of information that can only be captured by video or sound recordings, without elicitation (Anguera and Hernández-Mendo, 2016), and the possibilities offered in this area have been greatly enhanced by recent technological advances. Examples are (a) integration of data through merging, connecting, and embedding strategies (Plano Clark and Sanders, 2015); (b) integration of multisensor data through data fusion (Liggins et al., 2017), which consists of combining signal- and image-processing techniques with pattern-recognition techniques and artificial intelligence to create multimodal databases; (c) integration of heart rate data captured during exercise with observational data on physical activity through hidden Markov chains (Castañer et al., 2017b); and (d) application of deep learning techniques, which automatically extract multilevel characteristics that maximize the identification of predefined behavioral patterns (Ordóñez and Roggen, 2016). The resulting information is also richer in terms of veracity, as the data are not tainted by a personal opinion but based on an objective recording of what happened.
  • 90. A careful choice of observation units is a central component of observational research (Anguera and Izquierdo, 2006). The choice of units in the field of sport will be determined by the research question and by the rules of the sport, each with its nuances, and the units must be captured through the careful, rigorous use of video cameras, which is not without its technical complexities. In soccer, for example, a move may be a macro- unit (with the condition that only the team in possession of the ball is observed) but it can also be divided into smaller units depending on, for instance, how a given player establishes contact with the ball or with different team mates or areas of the pitch. Systematic observation differs from other methods in that the observation instrument must be built ad-hoc—that is, it must be purpose-designed in accordance with the theoretical framework of the study. The main instrument used in studies of this type combines a field format system and category systems tailored to the research question (Anguera et al., 2007). The field format (Sánchez-Algarra and Anguera, 2013) is a multidimensional system. For each field format, it is necessary to draw up a catalog of behaviors (a list of mutually
  • 91. exclusive behaviors for each dimension) that is considered to be permanently open; it is constructed using a decimal coding system that allows the behaviors to be hierarchically arranged according to the degree of molecularization required. The final dataset acquires the form of a matrix of codes consisting of columns containing the different dimensions/subdimensions and rows consisting of the successive units into which the episode observed has been segmented. The category system (Anguera, 2003) is unidimensional and requires a theoretical framework, which, combined with empirical information on the situation being observed, enables the construction of a series of exhaustive, mutually exclusive categories. Instruments that combine field format and category systems aim to harness the strengths of the two systems (flexibility in the first case and support from a theoretical framework in the second) and compensate for their weaknesses (inadequacy of the category system in dynamic processes and multidimensional studies and weakness of the field format system in studies that lack a theoretical framework or in which this framework has been rejected). Numerous examples have been described in the literature, particularly in recent years, and have been applied to a wide range
  • 92. of sporting contexts, including motor skill analysis (Castañer et al., 2009), physical activity (Castañer et al., 2016b), middle- and long-distance races (Aragón et al., 2015, 2017), basketball (Fernández et al., 2009), soccer (Jonsson et al., 2006; Castañer et al., 2016a, 2017a; Casal et al., 2017; Diana et al., 2017), judo (Gutiérrez-Santiago et al., 2011), hockey (Hernández-Mendo and Anguera, 2002), futsal (Lapresa et al., 2013b), and kinesics (Castañer et al., 2013). Ad-hoc instruments have been shown to be equally effective in amateur (Arana et al., 2013) and elite (Barreira et al., 2014) sport. The growing use of combined field- format/category system instruments has undoubtedly has been favored by the increase in observational studies in the field of sport and physical activity. We believe, however, that it is also attributable to the fact that observational methodology is widely applicable and offers an optimal balance between rigor and flexibility. The number of software programs specifically designed for observational studies has increased in recent years. Apart from general-purpose programs, such as Microsoft Excel and Access, researchers now have access to numerous open-access programs that can be used to record, to display, and to analyze data, as well as to perform quality checks. Our research group has designed several freely accessible software
  • 93. programs to support the scientific community (Hernández- Mendo et al., 2014). Examples are LINCE (Gabin et al., 2012; http://observesport.com), HOISAN (Hernández-Mendo et al., 2012; http://www.menpas.com), MOTS (Castellano et al., 2008; Frontiers in Psychology | www.frontiersin.org 5 December 2017 | Volume 8 | Article 2196 http://observesport.com http://www.menpas.com https://www.frontiersin.org/journals/psychology https://www.frontiersin.org https://www.frontiersin.org/journals/psychology#articles Anguera et al. Observation in Sport and Physical Activity Sciences http://www.menpas.com), and SOCCEREYE (Barreira et al., 2013). Another very useful freeware program that our group has been systematically using for years to record observational data and to perform lag sequential analysis is SDIS-GSEG (Bakeman and Quera, 2011). The concepts and technicalities of quantification (also
  • 94. known as quantitizing; Tashakkori and Teddlie, 1998) and data transformation are a recurrent theme in works written by eminent figures in the field of mixed methods research (Sandelowski, 2001; Creswell et al., 2003; Bazeley, 2009b; Sandelowski et al., 2009). Quantification in observational methodology is particularly robust, because apart from simple frequency counts, it contemplates other essential primary parameters, such as order and duration (Bakeman, 1978; Anguera et al., 2001; Bakeman and Quera, 2011), thereby providing the researcher with the means to map the different components of a behavior as it occurs. In observational methodology, the term progressive order of inclusion refers to the fact that frequency is the parameter that provides the least information; order provides information on frequency and something else (i.e., sequence of behaviors); and duration provides information on frequency and order (by adding the number of time units for each occurrence of a behavior). This specific consideration of the order parameter is crucial for detecting hidden structures through the quantitative analysis of relationships between different codes in systematized
  • 95. observational datasets. Precisely because it contains information on order and duration, the initial data set, which is derived from an extremely rich qualitative component, can be analyzed using a wide range of quantitative techniques, producing a set of quantitative results that are then interpreted qualitatively, permitting seamless integration. With observational methodology, we are no longer talking about complementing qualitative and quantitative findings, but rather about integrating them. As stated by Fetters (2016), in his article drawing comparisons between developments in mixed methods research and the transition from the horseless carriage to the modern automobile, innovation is both needed and will occur. The wide scope of opportunities available for processing data derived from observation supports the idea that purely observational studies should be considered as mixed methods research studies, even though they constitute a somewhat special case and do not follow traditional patterns. Although this is a somewhat controversial topic, as Freshwater (2015, p. 296) stated,
  • 96. “disagreement and debate is fundamental to achieving excellence in scholarship.” THE WAY FORWARD: OVERCOMING THE SHORTCOMINGS OF INTEGRATION AND SYMMETRY We are at a critical time for the future of mixed methods research and we believe that the time has come to stop and to take stock, just as we do in our everyday lives, as we come up against different obstacles and challenges. Considering the relatively recent surge in mixed methods research articles around the globe, we believe it is methodologically “healthy” to, as they say in Spain, “put our finger in the blister” and make a humble but firm call for reflection on what we believe to be the two major barriers to the successful implementation of mixed methods research designs: the lack of integration and the lack of symmetry. The Barrier of Integration Integration of qualitative and quantitative research approaches is a central theme in the mixed methods research literature,
  • 97. and the title of a recent editorial by Fetters and Freshwater (2015b)−1 + 1 = 3—graphically showed that a whole is greater than is the sum of the individual parts. Although it is understandable that researchers from a given discipline typically will follow the traditions of their research communities, it is necessary to bear in mind that the respective findings will be mutually informative—that is, they will talk to each other (O’Cathain et al., 2010). Quantitative methods address questions such as causality, generalizability, and magnitude of effects, whereas qualitative methodologies are used to develop theories, to describe occurrences, and to explore the contexts surrounding different phenomena (Fetters and Freshwater, 2015b). Qualitative data also can be used to design quantitative instruments (Onwuegbuzie et al., 2010). Just like in an orchestra, each of the components in a mixed methods research design has an important role, but the sum of these components form a greater whole. However, as Bazeley (2009b) pointed out in an interesting study that described how different qualitative and quantitative methodologies could be positioned along a continuum, not all types of data or analysis can be integrated.
  • 98. Although numerous leading figures in the field of mixed methods research have stressed the importance of integrating qualitative and quantitative data (Creswell, 2003, 2015; O’Cathain et al., 2010), a large number of researchers, not surprisingly, still struggle to merge the two approaches and end up publishing their results separately. We believe that the failure to successfully integrate qualitative and quantitative data is largely due to the nature of the data involved (Bazeley, 2009b) and that this is where we need to focus our efforts, through reflection, inquiry, and exploration of solutions. This lack of data integration might also stem from quantitative and qualitative research questions that are addressed separately within a mixed methods research study (cf. Plano Clark and Badiee, 2010). Qualitative and quantitative data, however, can be integrated using what is known as the weaving approach, which involves presenting the respective findings together according to a specific theme or concept. Consequently, we propose that researchers who encounter difficulties merging qualitative and quantitative data in studies of sport and physical activity contemplate an initial exploratory phase in which they search for ways of weaving together their data, at least until a suitable methodological solution is found.
  • 99. The Barrier of Symmetry Unlike other approaches in experimental studies, which from an enactive framework (Lutz et al., 2002) show the difference Frontiers in Psychology | www.frontiersin.org 6 December 2017 | Volume 8 | Article 2196 http://www.menpas.com https://www.frontiersin.org/journals/psychology https://www.frontiersin.org https://www.frontiersin.org/journals/psychology#articles Anguera et al. Observation in Sport and Physical Activity Sciences between first-person approaches (based on phenomonological data) and third-person approaches (based on physiological and behavioral data obtained objectively using a range of instruments), enabling thus the problem of asymmetry to be overcome, in observational studies of spontaneous behavior in natural settings, where nothing is “artificial” or “staged,” asymmetry acquires a different meaning, as described below.
  • 100. Mixed methods research studies typically involve the adoption of either a qualitative-dominant or a quantitative-dominant approach (Onwuegbuzie and Combs, 2010), but an additional issue is that studies are frequently characterized by a lack of symmetry between the two approaches. Mixed methods studies typically focus more on qualitative than quantitative data and accordingly miss the opportunity to explore the wealth of information that a quantitative analysis of qualitative data can provide. Although it is true that some researchers apply robust statistical methods and even multiple techniques to analyze quantitative data (Onwuegbuzie et al., 2007), they frequently fail to move beyond a descriptive analysis (Ross and Onwuegbuzie, 2014), and consequently miss out on the opportunity to explore the richness of information within the qualitative component (Bazeley, 2009a; Onwuegbuzie, 2016). As a step toward achieving this qualitative-quantitative symmetry, we agree with Happ et al. (2004) that it is necessary to quantitize the qualitative data and qualitize the quantitative data using different event analysis techniques, such as, for example, segmenting episodes of behavior into events or measuring duration of behaviors. O’Cathain et al. (2010) also refer to quantitization and qualitization, but argue
  • 101. that it is not sufficient simply to use the qualitative data to inform the quantitative findings, stressing instead the need to mix together the two types of data to create new variables. Onwuegbuzie et al. (2011) identified 58 types of quantitative analyses, which they grouped into four categories according to level of complexity: number of independent variables, number of dependent variables, measurement scales for independent variables (nominal, ordinal, interval, and ratio scales), and measurements scale for dependent variables. Obviously, each of these categories can be further broken down into additional categories (Ross and Onwuegbuzie, 2014). What we are proposing in this paper, and with specific reference to research in the field of sport and physical activity, is an approach that strengthens the analytical processing of quantitative data derived from the qualitative component of the study. The concept of independent and dependent variables, almost omnipresent in experimental and quasi-experimental studies, is not relevant to systematic observation, because this involves observing spontaneous behaviors in natural settings. Techniques for analyzing quantitative data obtained from qualitative research are generally complex. Anguera et al.
  • 102. (2014) presented a list of the techniques used in sport and physical activity research. In Table 2, we present an updated version of this list, which also now includes techniques for analyzing data from quantitative sources (Sanchez-Algarra, 2006). Table 2 shows the wide range of possibilities that exist for analyzing the qualitative and quantitative data that coexist in observational studies in the field of sport and physical activity. As the table demonstrates, however, what is novel about our approach from a mixed methods perspective is the way in which we integrate or mix the two types of data. Generally speaking, “there are three ways in which mixing occurs: merging or converging the two datasets by actually bringing them together, connecting the two datasets by having one build on the other, or embedding one data set within the other so that one type of data provides a supportive role for the other data set” (Creswell and Plano Clark, 2007, p. 7). For our proposal, we chose the second form: connecting two databases by having one build on the other. According to Sandelowski et al. (2009), this connection can be achieved through transformation, i.e., by quantitizing qualitative data or by qualitizing quantitative data. We use the sequentiality method, shown in the last row in Table 2, which takes as its starting point the annotation
  • 103. of the order of occurrence of all the behaviors included in a given observational dataset. This sequentiality permits the transformation of initially qualitative data into a format that can be analyzed quantitatively and robustly, achieving thus successful integration. None of the standard research designs conceptualized for mixed methods research are applicable to the transformation of qualitative data (derived from video or sound recordings in natural settings, or from texts resulting from indirect observation) into quantitative data for analysis using specific quantitative techniques, such as variability analysis, comparison of proportions, categorical variance, log-linear analysis, logit analysis, lag sequential analysis, polar coordinate analysis, T- pattern detection, and so forth. Perhaps the use of such techniques will enable the weaving approach called for in mixed methods research. Several data analysis techniques that are specific to the study of sequences of behavior, such as lag sequential analysis, polar coordinate analysis, and T-pattern detection, have a particularly important role in observational methodology due to the assignment of parameters of frequency, order, and duration to the initial qualitative data (Anguera et al., 2001; Blanco-Villaseñor et al., 2003) and thereby providing the necessary conditions for
  • 104. subsequent quantitative analysis using robust, non-standard, statistical techniques that offer highly relevant structural results. As an epilog, we would like to stress that there is wide consensus in the mixed methods research field on the value of using merging, connecting, and embedding strategies to integrate qualitative and quantitative data (Plano Clark and Sanders, 2015). In this article, we have focused on an approach for connecting these two perspectives and shown that it is perfectly possible to transform qualitative datasets featuring behaviors whose order of occurrence has been recorded into matrices of code that can subsequently be analyzed using powerful quantitative techniques. Frontiers in Psychology | www.frontiersin.org 7 December 2017 | Volume 8 | Article 2196 https://www.frontiersin.org/journals/psychology https://www.frontiersin.org https://www.frontiersin.org/journals/psychology#articles
  • 105. Anguera et al. Observation in Sport and Physical Activity Sciences TABLE 2 | Quantitative analysis techniques for processing qualitative and quantitative data in studies of sport and physical activity. Type of relationship Type of data Quantitative statistical analysis Descriptive statistics Measures of central tendency: Mean Median Mode Measures of dispersion: Variance Standard deviation Coefficient of variation
  • 106. Normal statistical analysis Quantitative data T-test (one population) T-test for comparing means between two groups with independent data T-test for comparing means between two groups with paired data F-test for equality of variances Univariate analysis of variance (ANOVA): One-way ANOVA Two-way ANOVA (with interaction) Association Relationship between two categorical variables Yule’s coefficient (Yule’s Q) Contingency coefficient C Chi-square (χ2)
  • 107. Relationship between several categorical variables Contingency analysis Log-linear analysis Logit analysis Logit analysis-causal Logit analysis-Markov Probit analysis Logistic regression Correspondence analysis Relationship between ordinal variables Contingency tables Log-linear analysis Logit analysis Correspondence analysis
  • 108. Ballot analysis Ratios Comparison of proportions Quantitative data Pearson’s correlation coefficient Simple linear regression Multiple linear regression Partial correlation Covariance Relationship between a naturally dichotomous variable and a continuous quantitative variable Point-biserial correlation coefficient (rbp) Relationship between an artificially dichotomized variable and a continuous quantitative variable Point-biserial correlation coefficient (rb)
  • 109. Relationship between dichotomized variables Tetrachoric correlation (rt) Relationship between dichotomous variables Correlation ϕ Relationship between ordinal variables Spearman correlation coefficient (rS) Kendall rank correlation coefficient Kendall’s W (coefficient of concordance) Quantitative data Product-moment Pearson correlation Simple linear regression model Multiple linear regression model Partial correlation (Continued) Frontiers in Psychology | www.frontiersin.org 8 December 2017 | Volume 8 | Article 2196
  • 110. https://www.frontiersin.org/journals/psychology https://www.frontiersin.org https://www.frontiersin.org/journals/psychology#articles Anguera et al. Observation in Sport and Physical Activity Sciences TABLE 2 | Continued Type of relationship Type of data Quantitative statistical analysis Multivariate analysis of variance (MANOVA) Quantitative data One-way MANOVA Two-way MANOVA (with interaction) Statistical distances and dimension reduction
  • 111. Quantitative data Principal component analysis Calculation of number of principal components Geometric interpretation Qualitative data Principal coordinate analysis (multidimensional scaling) Algorithm for calculating principal coordinates Discriminant analysis Quantitative data Main classification algorithms: Discriminant analysis. Fisher linear discriminant analysis and quadratic discriminant analysis: Minimum or maximum method; Unweighted Pair-Groups Method Average (UPGMA) method. Cophenetic correlation. Canonical correlation analysis Quantitative data Population canonical correlation analysis Euclidean distance and Mahalanobis distance
  • 112. Sequentiality Ordered categorical data analysis Lag sequential analysis Polar coordinate analysis T-pattern detection (temporal patterns) Quantitative data Time series analysis Spectral analysis DISCUSSION The scientific literature of the past 25 years has presented, from varying and sometimes opposing standpoints, a wide spectrum of theoretical positions and empirical findings in relation to studies that are claimed to represent mixed methods research studies (López-Fernández and Molina-Azorín, 2011). Mixed methods research is growing in most disciplines—as demonstrated by Onwuegbuzie and Corrigan (2016) via their recent meta-prevalence rate study. And, in our opinion, the field of sport and physical activity is a particularly fertile area in which studies merging quantitative and qualitative approaches have begun to flourish. These studies typically involve the
  • 113. analysis of behaviors and motor-related skills in a wide range of sports and activities that are grounded in a theoretical framework, can be performed at a professional or amateur level, offer big learning/training opportunities due to their vast scope, and have the potential for causing considerable impact in the scientific community and media at large. They are, as such, particularly deserving of attention. As shown by our review of the literature, summarized in Table 1, the volume of mixed methods research publications in ISI-indexed sports and physical activity journals varies widely from one journal to the next. Perhaps, as Fetters (2016) suggests via his analogy of the horseless carriage, we were unaware that the many decades of tinkering with mixed methods would spawn a period of accelerated development. We should also, however, bear in mind the saying “do not put vintage wine into new wineskins lest it sour.” That stated, although these “wineskins” are new, they will have benefited from the experience gradually accumulated in multiple substantive areas over the past two decades. As the guiding principle of this paper was to show the