SlideShare a Scribd company logo
1 of 8
Download to read offline
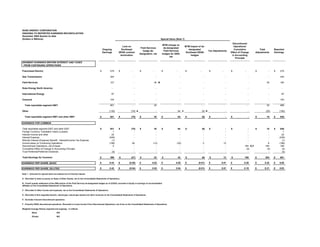
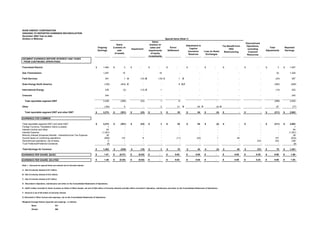
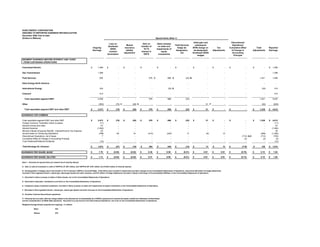
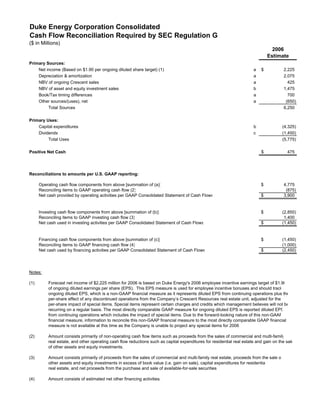
Duke Energy Corporation
Non-GAAP Reconciliation for SEC Regulation G


2006 Earnings per Share (“EPS”) Incentive Target Measure

The slides and prepared remarks for the February 1, 2006 Earnings Conference
Call include a discussion of the Company's 2006 EPS incentive target of $1.90
and the minimum payout level of $1.75. This EPS measure is used for employee
incentive bonuses and should track ongoing diluted EPS, which is a non-GAAP
financial measure as it represents diluted EPS from continuing operations plus
the per-share effect of any discontinued operations from the Company’s
Crescent Resources real estate unit, adjusted for the per-share impact of special
items. Special items represent certain charges and credits which management
believes will not be recurring on a regular basis. The most directly comparable
GAAP measure for ongoing diluted EPS is reported diluted EPS from continuing
operations which includes the impact of special items. Due to the forward-
looking nature of this non-GAAP financial measure, information to reconcile this
non-GAAP financial measure to the most directly comparable GAAP financial
measure is not available at this time as the Company is unable to project any
special items for 2006.

2006 and Beyond Ongoing Segment EBIT and Related Growth Percentages

The Company’s slides and prepared remarks for the February 1, 2006 Earnings
Conference Call include a discussion of forecasted ongoing EBIT for 2006 for
certain segments, including a discussion of ongoing equity earnings for Field
Services, Other, and ongoing EBIT contributions for Cinergy’s operations post
merger, in addition to, for certain segments, a discussion of a forecasted ongoing
segment EBIT growth rates, which are based on historical and forecasted
ongoing segment EBIT. Ongoing segment or Other EBIT, and related growth
rates, are non-GAAP financial measures as they represent reported segment or
Other EBIT adjusted for “special items,” which represent certain charges and
credits which management believes will not be recurring on a regular basis. The
most directly comparable GAAP measure for ongoing segment or Other EBIT is
reported segment or Other EBIT, which represents EBIT from continuing
operations, including any “special items.” Due to the forward-looking nature of
forecasted ongoing segment or Other EBIT and related growth rates, for future
periods, information to reconcile these non-GAAP financial measures to the most
directly comparable GAAP financial measures is not available at this time as the
Company is unable to project any “special items” for any future periods.
2006 Segment EBIT from Continuing and Discontinued Operations for Crescent

The Company’s slides and prepared remarks for the February 1, 2006 Earnings
Conference Call include a discussion of Crescent Resources’ segment EBIT from
continuing and discontinued operations for 2006. As the Company’s segment
GAAP measure is EBIT from continuing operations, the combination of segment
EBIT from continuing and discontinued operations represents a non-GAAP
financial measure. The most directly comparable GAAP measure for Crescent’s
segment EBIT from continuing and discontinued operations is reported segment
EBIT from continuing operations. Information to reconcile this non-GAAP
financial measure to the most directly comparable GAAP financial measure is not
available at this time as the Company is unable to forecast those Crescent
operations, if any, which will be discontinued operations during 2006.

Post-2007 Ongoing Diluted EPS Growth

The Company’s prepared remarks for the February 1, 2006 Earnings Conference
Call include a discussion of the expected range of growth in ongoing diluted EPS
after 2007. These percentages are based on anticipated ongoing diluted EPS
amounts for future periods. This ongoing diluted EPS measure is a non-GAAP
financial measure as it represents diluted EPS from continuing operations plus
the per-share effects of any discontinued operations from the Company’s
Crescent Resources real estate unit, adjusted for the impact of special items.
Special items represent certain charges and credits which management believes
will not be recurring on a regular basis. Management believes that the
presentation of ongoing diluted EPS provides useful information to investors, as it
allows them to more accurately compare the Company’s ongoing performance
across all periods. The most directly comparable GAAP measure for ongoing
diluted EPS is reported diluted EPS from continuing operations which includes
the impact of special items. Due to the forward-looking nature of ongoing diluted
EPS for future periods, information to reconcile such non-GAAP financial
measure to the most directly comparable GAAP financial measure
is not available at this time as the Company is unable to forecast any special
items for future periods.

FFO Interest Coverage

The Company's slides and script for the February 1, 2006 Earnings Conference
Call include a discussion of expected FFO Interest Coverage Ratios for 2006,
which is a non-GAAP financial measure. Funds from Operations (numerator) is
defined as net cash provided by operating activities on a GAAP basis.
Adjustments to the GAAP number primarily include changes in working capital
and adjustments for off-credit entities. Cash interest paid (numerator) and
interest expense (denominator) on a GAAP basis are adjusted for interest paid
on off-credit entity debt and capitalized interest, which includes AFUDC interest.
Duke Energy Corporation
                             Field Services Pro-Forma Segment Earnings
                                         Reg G Reconciliation


(Amounts in millions)                                             Year-Ended
                                                                  12/31/2005

DEFS LLC Net Income (100%) - Year Ended 12/31/2005                $      2,166

Less Special Items:
    Gain on sale of TEPPCO                                               (1,134)

Pro-Forma DEFS LLC Net Income (100%) - Year Ended 12/31/2005             1,032

Duke Energy ownership %                                                    50%

Pro-Forma Equity Earnings                                                  516

Adjustment for 2005 hedge impacts                                         (238)

Pro-Forma Pretax Earnings Impact, Net of Hedging                  $        278


                                                                  Year-Ended
                                                                  12/31/2006

Projected 2006 DEFS Equity Earnings (50%)                         $        500

Pro-Forma Pretax Earnings Impact, Net of Hedging                          (278)

Net Increase                                                      $        222     (approximately $220 million)
DUKE ENERGY CORPORATION
ONGOING TO REPORTED EARNINGS RECONCILIATION
December 2004 Quarter-to-date
(Dollars in Millions)                                                                                                 Special Items (Note 1)

                                                                                                                  Gains (losses)                                             Discontinued
                                                                                                    Gains                             Adjustment
                                                                                                                  on sales and                                                Operations,
                                                                                 Ongoing         (Losses) on                                                                                         Total           Reported
                                                                                                                                      to Captive            Loss on
                                                                                                                   impairments                                                 excluding
                                                                                 Earnings             sale                                                                                        Adjustments        Earnings
                                                                                                                                       Insurance             Asset
                                                                                                                     of equity                                                 Crescent
                                                                                                   of assets                           Reserves            Exchanges
                                                                                                                   investments                                                Resources
SEGMENT EARNINGS BEFORE INTEREST AND TAXES
 FROM CONTINUING OPERATIONS

Franchised Electric                                                          $         252       $      -         $         -         $        -           $     -           $        -           $         -    $        252

Gas Transmission                                                                       328                  4                11                        -                 -                    -           15              343

Field Services                                                                         124                   -                   -                     -                 -                    -             -             124

Duke Energy North America                                                               (41)            (30) A                   -                     -                 -                    -           (30)             (71)

International Energy                                                                     64                 (3)                  -                     -                 -                    -            (3)             61

Crescent                                                                                 50                  -                   -                     -                 -                    -             -              50

   Total reportable segment EBIT                                                       777              (29)                 11                    -                 -                    -               (18)            759

Other                                                                                   (80)                 -                  (1)             64 B                 (4) C                    -           59               (21)

   Total reportable segment EBIT and other EBIT                              $         697       $      (29)      $          10       $         64         $         (4)     $                -   $       41     $        738

EARNINGS FOR COMMON

Total reportable segment EBIT and other EBIT                                 $         697       $      (29)      $          10       $         64         $         (4)     $         -          $        41    $         738
Foreign Currency Translation Gains (Losses)                                              1                -                   -                  -                    -                -                    -                1
Interest Income and other                                                               18                -                   -                  -                    -                -                    -               18
Interest Expense                                                                      (297)               -                   -                  -                    -                -                    -             (297)
Minority Interest (Expense) Benefit - Interest/Income Tax Expense                       11                -                   -                  -                    -                -                    -               11
Income taxes on continuing operations                                                 (154)              10                  (3)               (22)                   1                -                  (14)            (168)
Discontinued operations, net of taxes                                                    1                -                   -                  -                    -               54                   54               55
Trust Preferred/Preferred Dividends                                                     (2)               -                   -                  -                    -                -                    -               (2)

Total Earnings for Common                                                    $         275       $      (19)      $             7     $         42         $         (3)     $        54          $       81     $        356

                                                                             $         0.29      $     (0.02)     $         0.01      $        0.04        $         -       $       0.06         $      0.09    $        0.38
EARNINGS PER SHARE, BASIC

                                                                             $         0.28      $     (0.02)     $         0.01      $        0.04        $         -       $       0.05         $      0.08    $        0.36
EARNINGS PER SHARE, DILUTED

Note 1 - Amounts for special items are entered net of minority interest

A - Net of minority interest of $20 million.

B - Recorded in Operation, maintenance and other on the Consolidated Statements of Operations.

C - Recorded in Other income and expenses, net on the Consolidated Statements of Operations.

Weighted Average Shares (reported and ongoing) - in millions

           Basic                        947

           Diluted                      983
DUKE ENERGY CORPORATION
ONGOING TO REPORTED EARNINGS RECONCILIATION
December 2005 Quarter-to-date
(Dollars in Millions)                                                                                                                                        Special Items (Note 1)
                                                                                                                                                                                                                                          Discontinued
                                                                                                                                                               MTM change on
                                                                                                              Loss on                                                                   MTM impact of de-                                  Operations/
                                                                                                                                      Field Services            de-designated
                                                                                           Ongoing           Southeast                                                                     designated                                      Cumulative              Total       Reported
                                                                                                                                        hedge de-               Field Services                                   Tax Adjustments
                                                                                           Earnings        DENA contract                                                                 Southeast DENA                                 Effect of Change        Adjustments    Earnings
                                                                                                                                     designation, net          hedges for 2005,
                                                                                                            termination                                                                      hedges                                      in Accounting
                                                                                                                                                                      net
                                                                                                                                                                                                                                            Principle
SEGMENT EARNINGS BEFORE INTEREST AND TAXES
 FROM CONTINUING OPERATIONS

Franchised Electric                                                                    $          279      $             -           $            -          $              -           $            -           $          -           $           -           $         -    $   279

Gas Transmission                                                                                  344                            -                     -                            -                        -                      -                       -             -        344

Field Services                                                                                    127                            -                    35 B                          -                        -                      -                       -           35         162

Duke Energy North America                                                                           -                            -                     -                            -                        -                      -                       -             -          -

International Energy                                                                               97                            -                     -                            -                        -                      -                       -             -         97

Crescent                                                                                          104                            -                     -                            -                        -                      -                       -             -        104

  Total reportable segment EBIT                                                                   951                        -                        35                        -                        -                      -                       -               35         986

Other                                                                                            (130)                   (75) A                        -                        64 C                     (9) D                      -                       -           (20)       (150)

  Total reportable segment EBIT and other EBIT                                         $          821      $             (75)        $                35     $                  64      $                (9)     $                  -   $                   -   $       15     $   836

EARNINGS FOR COMMON

Total reportable segment EBIT and other EBIT                                           $          821      $             (75)        $             35        $               64         $                (9)     $               -      $             -     $           15     $    836
Foreign Currency Translation Gains (Losses)                                                          1                     -                        -                         -                           -                      -                    -                  -            1
Interest Income and other                                                                          22                      -                        -                         -                           -                      -                    -                  -           22
Interest Expense                                                                                 (249)                     -                        -                         -                           -                      -                    -                  -         (249)
Minority Interest (Expense) Benefit - Interest/Income Tax Expense                                  (1)                     -                        -                         -                           -                      -                    -                  -           (1)
Income taxes on Continuing Operations                                                            (196)                    28                      (13)                      (22)                          3                     12                    -                  8         (188)
Discontinued Operations, net of taxes                                                                5                     -                        -                         -                           -                      -                  184 E,F            184          189
Cumulative Effect of Change in Accounting Principle                                                -                       -                        -                         -                           -                      -                   (4)                (4)          (4)
Trust Preferred/Preferred Dividends                                                                (5)                     -                        -                         -                           -                      -                    -                  -           (5)

Total Earnings for Common                                                             $           398       $            (47)        $                22       $                42      $                (6)     $              12      $           180         $      203     $   601

                                                                                      $          0.43      $           (0.05)        $           0.02        $             0.05         $          (0.01)        $         0.01         $          0.20         $      0.22    $   0.65
EARNINGS PER SHARE, BASIC

                                                                                      $          0.42      $           (0.04)        $           0.02        $             0.04         $          (0.01)        $         0.01         $          0.19         $      0.21    $   0.63
EARNINGS PER SHARE, DILUTED

Note 1 - Amounts for special items are entered net of minority interest

A - Recorded in Gains (Losses) on Sales of Other Assets, net on the Consolidated Statements of Operations.

B - Fourth quarter settlement of the 2005 portion of the Field Services de-designated hedges as of 2/22/05, recorded in Equity in earnings of unconsolidated
affiliates on the Consolidated Statements of Operations.

C - Recorded in Other income and expenses, net on the Consolidated Statements of Operations.

D - Recorded in Non-regulated electric, natural gas, natural gas liquids and other revenues on the Consolidated Statements of Operations.

E - Excludes Crescent discontinued operations.

F - Primarily DENA discontinued operations. Recorded in (Loss) Income From Discontinued Operations, net of tax on the Consolidated Statements of Operations.

Weighted Average Shares (reported and ongoing) - in millions

           Basic                      928

           Diluted                    962
DUKE ENERGY CORPORATION
ONGOING TO REPORTED EARNINGS RECONCILIATION
December 2004 Year-to-date
(Dollars in Millions)                                                                                                                                                   Special Items (Note 1)
                                                                                                                                                     Gains
                                                                                                                                                                                                                                                                     Discontinued
                                                                                                           Gains                                  (losses) on                                  Adjustment to                             Tax Benefit from             Operations,
                                                                                        Ongoing         (Losses) on                                                         Enron                                                                                                             Total       Reported
                                                                                                                                                   sales and                                      Captive
                                                                                                                             Impairment                                                                                                       DEA                      excluding
                                                                                        Earnings            sale                                                          Settlement                                                                                                       Adjustments    Earnings
                                                                                                                                                 impairments                                    Insurance           Loss on Asset         Restructuring                Crescent
                                                                                                         of assets                                  of equity                                    Reserves            Exchanges                                        Resources
                                                                                                                                                 investments
SEGMENT EARNINGS BEFORE INTEREST AND TAXES
 FROM CONTINUING OPERATIONS

Franchised Electric                                                                 $        1,464      $           3       $           -        $          -            $        -            $        -           $        -           $           -           $             -           $         3    $   1,467

Gas Transmission                                                                             1,297                 16                       -                16                        -                        -                    -                       -                         -           32         1,329

Field Services                                                                                 391                  1A                  (10) B              (16) C                    1    D                    -                    -                       -                         -           (24)         367

Duke Energy North America                                                                     (190)              (403) E                    -                       -                 8 D,F                     -                    -                       -                         -          (395)        (585)

International Energy                                                                           236                  (2)                 (13) D                      1                  -                        -                    -                       -                         -           (14)         222

Crescent                                                                                       240                   -                      -                       -                  -                        -                    -                       -                         -             -          240

   Total reportable segment EBIT                                                             3,438               (385)                  (23)                        1                 9                     -                    -                       -                         -              (398)       3,040

Other                                                                                         (164)                 4                       -                       2              21      D             64 D                    (4) G                       -                         -           87            (77)

   Total reportable segment EBIT and other EBIT                                     $        3,274      $        (381)      $           (23)     $                  3    $         30          $         64         $            (4)     $                   -   $                     -   $      (311)   $   2,963

EARNINGS FOR COMMON

Total reportable segment EBIT and other EBIT                                        $        3,274      $        (381)      $           (23)     $                  3    $         30          $         64         $            (4)     $             -         $              -          $      (311)   $    2,963
Foreign Currency Translation Gains (Losses)                                                      1                  -                     -                         -               -                     -                       -                    -                        -                    -             1
Interest Income and other                                                                       64                  -                     -                         -               -                     -                       -                    -                        -                    -            64
Interest Expense                                                                            (1,281)                 -                     -                         -               -                     -                       -                    -                        -                    -        (1,281)
Minority Interest (Expense) Benefit - Interest/Income Tax Expense                               38                  -                     -                         -               -                     -                       -                    -                        -                    -            38
Income taxes on continuing operations                                                         (690)               133                     8                         -             (11)                  (22)                      1                   48                        -                  157          (533)
Discontinued operations, net of taxes                                                            5                  -                     -                         -               -                     -                       -                    -                      233                  233           238
Trust Preferred/Preferred Dividends                                                             (9)                 -                     -                         -               -                     -                       -                    -                        -                    -            (9)

Total Earnings for Common                                                           $        1,402       $       (248)       $          (15)     $                  3    $         19          $         42         $            (3)     $            48         $            233          $       79     $   1,481

                                                                                    $         1.51      $      (0.27)       $        (0.02)      $              -        $       0.02          $       0.05         $         -          $          0.05         $           0.25          $      0.08    $    1.59
EARNINGS PER SHARE, BASIC

                                                                                    $         1.46      $      (0.25)       $        (0.02)      $              -        $       0.02          $       0.04         $         -          $          0.05         $           0.24          $      0.08    $    1.54
EARNINGS PER SHARE, DILUTED

Note 1 - Amounts for special items are entered net of minority interest

A - Net of minority interest of $1 million.

B - Net of minority interest of $12 million.

C - Net of minority interest of $7 million.

D - Recorded in Operation, maintenance and other on the Consolidated Statements of Operations.

E - $(397) million recorded in Gains (Losses) on Sales of Other Assets, net (net of $25 million of minority interest) and $(6) million recorded in Operation, maintenance and other on the Consolidated Statements of Operations.

F - Amount is net of $5 million of minority interest.

G -Recorded in Other income and expenses, net on the Consolidated Statements of Operations.

Weighted Average Shares (reported and ongoing) - in millions
           Basic                        931

           Diluted                      966
DUKE ENERGY CORPORATION
ONGOING TO REPORTED EARNINGS RECONCILIATION
December 2005 Year-to-date
(Dollars in Millions)                                                                                                                                                 Special Items (Note 1)

                                                                                                                                                                                                                 Initial gain and                           Discontinued
                                                                                                            Loss on                                   Gain on           Gains (losses)
                                                                                                                                 Mutual                                                    Field Services          subsequent                                Operations/
                                                                                                           Southeast                                transfer of         on sales and
                                                                                         Ongoing                               insurance                                                     hedge de-          MTM change on              Tax            Cumulative Effect       Total       Reported
                                                                                                             DENA                                      19.7%           impairments of
                                                                                         Earnings                                liability                                                  designation,          de-designated        Adjustments          of Change in       Adjustments    Earnings
                                                                                                            contract                                interest in             equity
                                                                                                                              adjustment                                                         net            Southeast DENA                               Accounting
                                                                                                          termination                                  DEFS              investments
                                                                                                                                                                                                                      hedges                                  Principle

SEGMENT EARNINGS BEFORE INTEREST AND TAXES
 FROM CONTINUING OPERATIONS

Franchised Electric                                                                  $        1,495      $             -      $              -      $             -    $             -     $             -      $                -     $              -   $               -    $         -    $   1,495

Gas Transmission                                                                              1,388                    -                     -                    -                  -                   -                       -                    -                   -              -        1,388

Field Services                                                                                  505                    -                     -               576 C                888 A                (23) B                    -                    -                   -          1,441        1,946

Duke Energy North America                                                                         -                    -                     -                    -                  -                   -                       -                    -                   -              -            -

International Energy                                                                            334                    -                     -                    -               (20) E                 -                       -                    -                   -            (20)         314

Crescent                                                                                        314                    -                     -                    -                  -                   -                       -                    -                   -              -          314

  Total reportable segment EBIT                                                               4,036                    -                     -               576                  868                  (23)                      -                    -                   -          1,421        5,457

Other                                                                                          (563)                (75) C                 (28) D                 -                  -                   -                     21 F                   -                   -            (82)        (645)

  Total reportable segment EBIT and other EBIT                                       $        3,473      $          (75)      $            (28)     $        576       $          868      $           (23)     $              21      $              -   $               -    $     1,339    $   4,812

EARNINGS FOR COMMON

Total reportable segment EBIT and other EBIT                                         $        3,473      $          (75)      $            (28)     $        576       $          868      $           (23)     $              21      $              -   $              -      $    1,339    $    4,812
Foreign Currency Translation Gains (Losses)                                                     (11)                  -                      -                 -                    -                    -                      -                     -                  -               -           (11)
Interest Income and other                                                                        57                   -                      -                 -                    -                    -                      -                     -                  -               -            57
Interest Expense                                                                             (1,062)                  -                      -                 -                    -                    -                      -                     -                  -               -        (1,062)
Minority Interest (Expense) Benefit - Interest/Income Tax Expense                                20                   -                      -                 -                    -                    -                      -                     -                  -               -            20
Income taxes on Continuing Operations                                                          (798)                 28                     10              (213)                (323)                   9                     (8)                   12                  -            (485)       (1,283)
Discontinued Operations, net of taxes                                                              7                  -                      -                 -                    -                    -                      -                     -               (712) G,H       (712)         (705)
Cumulative Effect of Change in Accounting Principle                                              -                    -                      -                 -                    -                    -                      -                     -                 (4)             (4)           (4)
Trust Preferred/Preferred Dividends                                                             (12)                  -                      -                 -                    -                    -                      -                     -                  -               -           (12)

Total Earnings for Common                                                            $        1,674      $          (47)     $             (18)     $        363        $         545      $           (14)     $              13       $            12   $           (716)     $     138     $   1,812

                                                                                     $         1.79      $        (0.05)     $         (0.02)       $       0.39       $         0.58      $        (0.01)      $           0.01       $         0.01     $          (0.76)    $      0.15    $    1.94
EARNINGS PER SHARE, BASIC

                                                                                     $         1.73      $        (0.04)     $         (0.02)       $       0.37       $         0.56      $        (0.01)      $           0.01       $         0.01     $          (0.73)    $      0.15    $    1.88
EARNINGS PER SHARE, DILUTED

Note 1 - Amounts for special items are entered net of minority interest

A - Gain on sale of investment in units of TEPPCO LP, $97 million, and TEPPCO GP, $791 million net of $343 million of minority interest.

B - De-designation of hedges due to the transfer of 19.7% interest in DEFS to ConocoPhillips. $125 million loss recorded in Impairment and other charges on the Consolidated Statements of Operations, reduced by $29 million of hedge settlements
recorded in Non-regulated electric, natural gas, natural gas liquids and other revenues, and $73 million of hedge settlements recorded in Equity in Earnings of Unconsolidated Affiliates on the Consolidated Statements of Operations.

C - Recorded in Gains (Losses) on Sales of Other Assets, net on the Consolidated Statements of Operations.

D - Recorded in Operation, maintenance and other on the Consolidated Statements of Operations.

E - Campeche equity investment impairment, recorded in Gains (Losses) on sales and impairments of equity investments on the Consolidated Statements of Operations.

F - Recorded in Non-regulated electric, natural gas, natural gas liquids and other revenues on the Consolidated Statements of Operations.

G - Excludes Crescent discontinued operations.

H - Primarily the non-cash, after-tax charge related to the planned exit of substantially all of DENA's physical and commercial assets outside the midwestern United States
and the reclassification of DENA 2005 operations. Recorded in (Loss) Income From Discontinued Operations, net of tax on the Consolidated Statements of Operations.

Weighted Average Shares (reported and ongoing) - in millions

              Basic                      934

              Diluted                    970
Duke Energy Corporation Consolidated
Cash Flow Reconciliation Required by SEC Regulation G
($ in Millions)
                                                                                                                                 2006
                                                                                                                               Estimate
Primary Sources:
    Net income (Based on $1.90 per ongoing diluted share target) (1)                                                   a   $           2,225
    Depreciation & amortization                                                                                        a               2,075
    NBV of ongoing Crescent sales                                                                                      a                 425
    NBV of asset and equity investment sales                                                                           b               1,475
    Book/Tax timing differences                                                                                        a                 700
    Other sources/(uses), net                                                                                          a                (650)
         Total Sources                                                                                                                 6,250

Primary Uses:
    Capital expenditures                                                                                               b               (4,325)
    Dividends                                                                                                          c               (1,450)
         Total Uses                                                                                                                    (5,775)

Positive Net Cash                                                                                                          $             475


Reconciliations to amounts per U.S. GAAP reporting:

      Operating cash flow components from above [summation of (a)]                                                         $           4,775
      Reconciling items to GAAP operating cash flow (2)                                                                                 (875)
      Net cash provided by operating activities per GAAP Consolidated Statement of Cash Flows                              $           3,900


      Investing cash flow components from above [summation of (b)]                                                         $           (2,850)
      Reconciling items to GAAP investing cash flow (3)                                                                                 1,400
      Net cash used in investing activities per GAAP Consolidated Statement of Cash Flows                                  $           (1,450)


      Financing cash flow components from above [summation of (c)]                                                         $           (1,450)
      Reconciling items to GAAP financing cash flow (4)                                                                                (1,000)
      Net cash used by financing activities per GAAP Consolidated Statement of Cash Flows                                  $           (2,450)


Notes:

(1)       Forecast net income of $2,225 million for 2006 is based on Duke Energy's 2006 employee incentive earnings target of $1.90
          of ongoing diluted earnings per share (EPS). This EPS measure is used for employee incentive bonuses and should track
          ongoing diluted EPS, which is a non-GAAP financial measure as it represents diluted EPS from continuing operations plus the
          per-share effect of any discontinued operations from the Company’s Crescent Resources real estate unit, adjusted for the
          per-share impact of special items. Special items represent certain charges and credits which management believes will not be
          recurring on a regular basis. The most directly comparable GAAP measure for ongoing diluted EPS is reported diluted EPS
          from continuing operations which includes the impact of special items. Due to the forward-looking nature of this non-GAAP
          financial measure, information to reconcile this non-GAAP financial measure to the most directly comparable GAAP financial
          measure is not available at this time as the Company is unable to project any special items for 2006

(2)       Amount consists primarily of non-operating cash flow items such as proceeds from the sales of commercial and multi-family
          real estate, and other operating cash flow reductions such as capital expenditures for residential real estate and gain on the sale
          of other assets and equity investments.

(3)       Amount consists primarily of proceeds from the sales of commercial and multi-family real estate, proceeds from the sale of
          other assets and equity investments in excess of book value (i.e. gain on sale), capital expenditures for residentia
          real estate, and net proceeds from the purchase and sale of available-for-sale securities

(4)       Amount consists of estimated net other financing activities.

More Related Content

What's hot

RYDERFINAL R2Q05
RYDERFINAL R2Q05RYDERFINAL R2Q05
RYDERFINAL R2Q05finance44
 
duke energy 2Q 07_RegG
duke energy 2Q 07_RegGduke energy 2Q 07_RegG
duke energy 2Q 07_RegGfinance21
 
public serviceenterprise group media.corporate
public serviceenterprise group media.corporatepublic serviceenterprise group media.corporate
public serviceenterprise group media.corporatefinance20
 
duke energy 11/02/07_RegG
duke energy 11/02/07_RegGduke energy 11/02/07_RegG
duke energy 11/02/07_RegGfinance21
 
Electrolux Consolidated results 2011
Electrolux Consolidated results 2011Electrolux Consolidated results 2011
Electrolux Consolidated results 2011Electrolux Group
 
gmac Robert Hull, GMAC Chief Financial Officer GMAC LLC 2008 First Quarter Fi...
gmac Robert Hull, GMAC Chief Financial Officer GMAC LLC 2008 First Quarter Fi...gmac Robert Hull, GMAC Chief Financial Officer GMAC LLC 2008 First Quarter Fi...
gmac Robert Hull, GMAC Chief Financial Officer GMAC LLC 2008 First Quarter Fi...finance8
 
Duke Energy 1Q/05_Slides
Duke Energy 1Q/05_SlidesDuke Energy 1Q/05_Slides
Duke Energy 1Q/05_Slidesfinance21
 
tech data Fiscal 2009 First-Quarter Results
tech data  Fiscal 2009 First-Quarter Resultstech data  Fiscal 2009 First-Quarter Results
tech data Fiscal 2009 First-Quarter Resultsfinance11
 

What's hot (9)

RYDERFINAL R2Q05
RYDERFINAL R2Q05RYDERFINAL R2Q05
RYDERFINAL R2Q05
 
duke energy 2Q 07_RegG
duke energy 2Q 07_RegGduke energy 2Q 07_RegG
duke energy 2Q 07_RegG
 
public serviceenterprise group media.corporate
public serviceenterprise group media.corporatepublic serviceenterprise group media.corporate
public serviceenterprise group media.corporate
 
duke energy 11/02/07_RegG
duke energy 11/02/07_RegGduke energy 11/02/07_RegG
duke energy 11/02/07_RegG
 
Electrolux Consolidated results 2011
Electrolux Consolidated results 2011Electrolux Consolidated results 2011
Electrolux Consolidated results 2011
 
gmac Robert Hull, GMAC Chief Financial Officer GMAC LLC 2008 First Quarter Fi...
gmac Robert Hull, GMAC Chief Financial Officer GMAC LLC 2008 First Quarter Fi...gmac Robert Hull, GMAC Chief Financial Officer GMAC LLC 2008 First Quarter Fi...
gmac Robert Hull, GMAC Chief Financial Officer GMAC LLC 2008 First Quarter Fi...
 
Duke Energy 1Q/05_Slides
Duke Energy 1Q/05_SlidesDuke Energy 1Q/05_Slides
Duke Energy 1Q/05_Slides
 
tech data Fiscal 2009 First-Quarter Results
tech data  Fiscal 2009 First-Quarter Resultstech data  Fiscal 2009 First-Quarter Results
tech data Fiscal 2009 First-Quarter Results
 
rmk_091304c
rmk_091304crmk_091304c
rmk_091304c
 

Viewers also liked

Duke Energy DEC_3Q04_Earnings_Reg_G_Recon
Duke Energy DEC_3Q04_Earnings_Reg_G_ReconDuke Energy DEC_3Q04_Earnings_Reg_G_Recon
Duke Energy DEC_3Q04_Earnings_Reg_G_Reconfinance21
 
Cummins_Investor_Conference_SEP_18-07
Cummins_Investor_Conference_SEP_18-07Cummins_Investor_Conference_SEP_18-07
Cummins_Investor_Conference_SEP_18-07finance21
 
cmi_07/03/06
cmi_07/03/06cmi_07/03/06
cmi_07/03/06finance21
 
Duke Energy 07/30/03
 Duke Energy 07/30/03 Duke Energy 07/30/03
Duke Energy 07/30/03finance21
 
Duke-Energy 2005_Stat
Duke-Energy 2005_StatDuke-Energy 2005_Stat
Duke-Energy 2005_Statfinance21
 
Duke Energy 08/03/05_Transcript
Duke Energy 08/03/05_TranscriptDuke Energy 08/03/05_Transcript
Duke Energy 08/03/05_Transcriptfinance21
 
2006_DukeEnergy10KA
 2006_DukeEnergy10KA 2006_DukeEnergy10KA
2006_DukeEnergy10KAfinance21
 
Duke Energy 3Q 05_Slides2
Duke Energy 3Q 05_Slides2Duke Energy 3Q 05_Slides2
Duke Energy 3Q 05_Slides2finance21
 
Duke Energy DEC_2Q2004_ER
Duke Energy DEC_2Q2004_ERDuke Energy DEC_2Q2004_ER
Duke Energy DEC_2Q2004_ERfinance21
 
05/01/06_Slides
05/01/06_Slides05/01/06_Slides
05/01/06_Slidesfinance21
 
Duke-Energy 2006_Stat_Book_07-12-07
Duke-Energy 2006_Stat_Book_07-12-07Duke-Energy 2006_Stat_Book_07-12-07
Duke-Energy 2006_Stat_Book_07-12-07finance21
 
textron annual report 1998
textron  annual report 1998textron  annual report 1998
textron annual report 1998finance21
 
cummins 2002arb
cummins  2002arbcummins  2002arb
cummins 2002arbfinance21
 
DEC_3Q04_Earmings_Review_Slides
DEC_3Q04_Earmings_Review_SlidesDEC_3Q04_Earmings_Review_Slides
DEC_3Q04_Earmings_Review_Slidesfinance21
 
Cummins_06/09/12
Cummins_06/09/12Cummins_06/09/12
Cummins_06/09/12finance21
 
4Q/06_Slides
4Q/06_Slides4Q/06_Slides
4Q/06_Slidesfinance21
 
duke energy 2Q/07_Earnings_Call_Transcript_-_Final
duke energy 2Q/07_Earnings_Call_Transcript_-_Finalduke energy 2Q/07_Earnings_Call_Transcript_-_Final
duke energy 2Q/07_Earnings_Call_Transcript_-_Finalfinance21
 
edison international 2004_joint proxy
edison international 2004_joint proxy edison international 2004_joint proxy
edison international 2004_joint proxy finance21
 
duke energy 2Q/07_Slides
duke energy 2Q/07_Slidesduke energy 2Q/07_Slides
duke energy 2Q/07_Slidesfinance21
 

Viewers also liked (20)

Duke Energy DEC_3Q04_Earnings_Reg_G_Recon
Duke Energy DEC_3Q04_Earnings_Reg_G_ReconDuke Energy DEC_3Q04_Earnings_Reg_G_Recon
Duke Energy DEC_3Q04_Earnings_Reg_G_Recon
 
Cummins_Investor_Conference_SEP_18-07
Cummins_Investor_Conference_SEP_18-07Cummins_Investor_Conference_SEP_18-07
Cummins_Investor_Conference_SEP_18-07
 
cmi_07/03/06
cmi_07/03/06cmi_07/03/06
cmi_07/03/06
 
Duke Energy 07/30/03
 Duke Energy 07/30/03 Duke Energy 07/30/03
Duke Energy 07/30/03
 
Duke-Energy 2005_Stat
Duke-Energy 2005_StatDuke-Energy 2005_Stat
Duke-Energy 2005_Stat
 
Duke Energy 08/03/05_Transcript
Duke Energy 08/03/05_TranscriptDuke Energy 08/03/05_Transcript
Duke Energy 08/03/05_Transcript
 
2006_DukeEnergy10KA
 2006_DukeEnergy10KA 2006_DukeEnergy10KA
2006_DukeEnergy10KA
 
Duke Energy 3Q 05_Slides2
Duke Energy 3Q 05_Slides2Duke Energy 3Q 05_Slides2
Duke Energy 3Q 05_Slides2
 
Duke Energy DEC_2Q2004_ER
Duke Energy DEC_2Q2004_ERDuke Energy DEC_2Q2004_ER
Duke Energy DEC_2Q2004_ER
 
05/01/06_Slides
05/01/06_Slides05/01/06_Slides
05/01/06_Slides
 
Duke-Energy 2006_Stat_Book_07-12-07
Duke-Energy 2006_Stat_Book_07-12-07Duke-Energy 2006_Stat_Book_07-12-07
Duke-Energy 2006_Stat_Book_07-12-07
 
textron annual report 1998
textron  annual report 1998textron  annual report 1998
textron annual report 1998
 
cummins 2002arb
cummins  2002arbcummins  2002arb
cummins 2002arb
 
cmi_071115
cmi_071115cmi_071115
cmi_071115
 
DEC_3Q04_Earmings_Review_Slides
DEC_3Q04_Earmings_Review_SlidesDEC_3Q04_Earmings_Review_Slides
DEC_3Q04_Earmings_Review_Slides
 
Cummins_06/09/12
Cummins_06/09/12Cummins_06/09/12
Cummins_06/09/12
 
4Q/06_Slides
4Q/06_Slides4Q/06_Slides
4Q/06_Slides
 
duke energy 2Q/07_Earnings_Call_Transcript_-_Final
duke energy 2Q/07_Earnings_Call_Transcript_-_Finalduke energy 2Q/07_Earnings_Call_Transcript_-_Final
duke energy 2Q/07_Earnings_Call_Transcript_-_Final
 
edison international 2004_joint proxy
edison international 2004_joint proxy edison international 2004_joint proxy
edison international 2004_joint proxy
 
duke energy 2Q/07_Slides
duke energy 2Q/07_Slidesduke energy 2Q/07_Slides
duke energy 2Q/07_Slides
 

Similar to Duke Energy 02/01/06_RegG

alltel 1q 07recons
alltel  1q 07reconsalltel  1q 07recons
alltel 1q 07reconsfinance27
 
public serviceenterprise group library.corporate-ir
public serviceenterprise group library.corporate-irpublic serviceenterprise group library.corporate-ir
public serviceenterprise group library.corporate-irfinance20
 
ibrary.corporate-ir.net
 ibrary.corporate-ir.net ibrary.corporate-ir.net
ibrary.corporate-ir.netfinance20
 
public serviceenterprise group library.corporate-ir
public serviceenterprise group library.corporate-irpublic serviceenterprise group library.corporate-ir
public serviceenterprise group library.corporate-irfinance20
 
public serviceenterprise group library.corporate-ir
public serviceenterprise group  library.corporate-irpublic serviceenterprise group  library.corporate-ir
public serviceenterprise group library.corporate-irfinance20
 
public serviceenterprise grouplibrary.corporate-i
public serviceenterprise grouplibrary.corporate-ipublic serviceenterprise grouplibrary.corporate-i
public serviceenterprise grouplibrary.corporate-ifinance20
 
public serviceenterprise grouplibrary.corporate-i
 public serviceenterprise grouplibrary.corporate-i public serviceenterprise grouplibrary.corporate-i
public serviceenterprise grouplibrary.corporate-ifinance20
 
public serviceenterprise group library.corporate-ir
public serviceenterprise group  library.corporate-irpublic serviceenterprise group  library.corporate-ir
public serviceenterprise group library.corporate-irfinance20
 
public serviceenterprise group Investor library.corporate
public serviceenterprise group Investor  library.corporatepublic serviceenterprise group Investor  library.corporate
public serviceenterprise group Investor library.corporatefinance20
 
public serviceenterprise group Investor library.corporate
 public serviceenterprise group Investor library.corporate public serviceenterprise group Investor library.corporate
public serviceenterprise group Investor library.corporatefinance20
 
public serviceenterprise group library.corporate
public serviceenterprise group  library.corporatepublic serviceenterprise group  library.corporate
public serviceenterprise group library.corporatefinance20
 
library.corporate-ir
library.corporate-irlibrary.corporate-ir
library.corporate-irfinance20
 
allstate Quarterly Investor Information Earnings Press Release 2004 1st
allstate Quarterly Investor Information Earnings Press Release  2004 1stallstate Quarterly Investor Information Earnings Press Release  2004 1st
allstate Quarterly Investor Information Earnings Press Release 2004 1stfinance7
 
EP4Q2007Earnings_FINALv2(Web)
EP4Q2007Earnings_FINALv2(Web)EP4Q2007Earnings_FINALv2(Web)
EP4Q2007Earnings_FINALv2(Web)finance49
 
EP4Q2007Earnings_FINALv2(Web)
EP4Q2007Earnings_FINALv2(Web)EP4Q2007Earnings_FINALv2(Web)
EP4Q2007Earnings_FINALv2(Web)finance49
 
celanese q4_2005_ir_slides
celanese q4_2005_ir_slidescelanese q4_2005_ir_slides
celanese q4_2005_ir_slidesfinance44
 
Duke_Energy_2004_Annual_Report
Duke_Energy_2004_Annual_ReportDuke_Energy_2004_Annual_Report
Duke_Energy_2004_Annual_Reportfinance21
 
Hexion FinalQ407
Hexion FinalQ407Hexion FinalQ407
Hexion FinalQ407finance36
 
Hexion FinalQ407
Hexion FinalQ407Hexion FinalQ407
Hexion FinalQ407finance36
 

Similar to Duke Energy 02/01/06_RegG (20)

alltel 1q 07recons
alltel  1q 07reconsalltel  1q 07recons
alltel 1q 07recons
 
2Q06_RegG
2Q06_RegG2Q06_RegG
2Q06_RegG
 
public serviceenterprise group library.corporate-ir
public serviceenterprise group library.corporate-irpublic serviceenterprise group library.corporate-ir
public serviceenterprise group library.corporate-ir
 
ibrary.corporate-ir.net
 ibrary.corporate-ir.net ibrary.corporate-ir.net
ibrary.corporate-ir.net
 
public serviceenterprise group library.corporate-ir
public serviceenterprise group library.corporate-irpublic serviceenterprise group library.corporate-ir
public serviceenterprise group library.corporate-ir
 
public serviceenterprise group library.corporate-ir
public serviceenterprise group  library.corporate-irpublic serviceenterprise group  library.corporate-ir
public serviceenterprise group library.corporate-ir
 
public serviceenterprise grouplibrary.corporate-i
public serviceenterprise grouplibrary.corporate-ipublic serviceenterprise grouplibrary.corporate-i
public serviceenterprise grouplibrary.corporate-i
 
public serviceenterprise grouplibrary.corporate-i
 public serviceenterprise grouplibrary.corporate-i public serviceenterprise grouplibrary.corporate-i
public serviceenterprise grouplibrary.corporate-i
 
public serviceenterprise group library.corporate-ir
public serviceenterprise group  library.corporate-irpublic serviceenterprise group  library.corporate-ir
public serviceenterprise group library.corporate-ir
 
public serviceenterprise group Investor library.corporate
public serviceenterprise group Investor  library.corporatepublic serviceenterprise group Investor  library.corporate
public serviceenterprise group Investor library.corporate
 
public serviceenterprise group Investor library.corporate
 public serviceenterprise group Investor library.corporate public serviceenterprise group Investor library.corporate
public serviceenterprise group Investor library.corporate
 
public serviceenterprise group library.corporate
public serviceenterprise group  library.corporatepublic serviceenterprise group  library.corporate
public serviceenterprise group library.corporate
 
library.corporate-ir
library.corporate-irlibrary.corporate-ir
library.corporate-ir
 
allstate Quarterly Investor Information Earnings Press Release 2004 1st
allstate Quarterly Investor Information Earnings Press Release  2004 1stallstate Quarterly Investor Information Earnings Press Release  2004 1st
allstate Quarterly Investor Information Earnings Press Release 2004 1st
 
EP4Q2007Earnings_FINALv2(Web)
EP4Q2007Earnings_FINALv2(Web)EP4Q2007Earnings_FINALv2(Web)
EP4Q2007Earnings_FINALv2(Web)
 
EP4Q2007Earnings_FINALv2(Web)
EP4Q2007Earnings_FINALv2(Web)EP4Q2007Earnings_FINALv2(Web)
EP4Q2007Earnings_FINALv2(Web)
 
celanese q4_2005_ir_slides
celanese q4_2005_ir_slidescelanese q4_2005_ir_slides
celanese q4_2005_ir_slides
 
Duke_Energy_2004_Annual_Report
Duke_Energy_2004_Annual_ReportDuke_Energy_2004_Annual_Report
Duke_Energy_2004_Annual_Report
 
Hexion FinalQ407
Hexion FinalQ407Hexion FinalQ407
Hexion FinalQ407
 
Hexion FinalQ407
Hexion FinalQ407Hexion FinalQ407
Hexion FinalQ407
 

More from finance21

ConAgra June92003Q&A
ConAgra June92003Q&AConAgra June92003Q&A
ConAgra June92003Q&Afinance21
 
ConAgraFY04Q1
ConAgraFY04Q1ConAgraFY04Q1
ConAgraFY04Q1finance21
 
ConAgra UAP10-03
ConAgra UAP10-03ConAgra UAP10-03
ConAgra UAP10-03finance21
 
ConAgra DealClosing11-03
ConAgra DealClosing11-03ConAgra DealClosing11-03
ConAgra DealClosing11-03finance21
 
ConAgra DealClosingb11-03
ConAgra DealClosingb11-03ConAgra DealClosingb11-03
ConAgra DealClosingb11-03finance21
 
SharePurchase12-03
SharePurchase12-03SharePurchase12-03
SharePurchase12-03finance21
 
ConAgra Q2Dec03
ConAgra Q2Dec03ConAgra Q2Dec03
ConAgra Q2Dec03finance21
 
ConAgra Q3Mar04
ConAgra Q3Mar04ConAgra Q3Mar04
ConAgra Q3Mar04finance21
 
ConAgra Q4Jul04
ConAgra Q4Jul04ConAgra Q4Jul04
ConAgra Q4Jul04finance21
 
ConAgra Q1Sept22-04
ConAgra Q1Sept22-04ConAgra Q1Sept22-04
ConAgra Q1Sept22-04finance21
 
ConAgra Q2Dec04
ConAgra Q2Dec04ConAgra Q2Dec04
ConAgra Q2Dec04finance21
 
ConAgra Q4Jun05
ConAgra Q4Jun05ConAgra Q4Jun05
ConAgra Q4Jun05finance21
 
ConAgra QAFY06Q1
ConAgra QAFY06Q1ConAgra QAFY06Q1
ConAgra QAFY06Q1finance21
 
ConAgra QAFY06Q2
ConAgra QAFY06Q2ConAgra QAFY06Q2
ConAgra QAFY06Q2finance21
 
ConAgra QAFY06Q3
ConAgra QAFY06Q3ConAgra QAFY06Q3
ConAgra QAFY06Q3finance21
 
ConAgra QAFY06Q4
ConAgra QAFY06Q4ConAgra QAFY06Q4
ConAgra QAFY06Q4finance21
 
ConAgra QAFY07Q1
ConAgra QAFY07Q1ConAgra QAFY07Q1
ConAgra QAFY07Q1finance21
 
ConAgra QAFY07Q2
ConAgra QAFY07Q2ConAgra QAFY07Q2
ConAgra QAFY07Q2finance21
 
ConAgra QAFY07Q3
ConAgra QAFY07Q3ConAgra QAFY07Q3
ConAgra QAFY07Q3finance21
 

More from finance21 (20)

ConAgra June92003Q&A
ConAgra June92003Q&AConAgra June92003Q&A
ConAgra June92003Q&A
 
ConAgraFY04Q1
ConAgraFY04Q1ConAgraFY04Q1
ConAgraFY04Q1
 
ConAgra UAP10-03
ConAgra UAP10-03ConAgra UAP10-03
ConAgra UAP10-03
 
ConAgra DealClosing11-03
ConAgra DealClosing11-03ConAgra DealClosing11-03
ConAgra DealClosing11-03
 
ConAgra DealClosingb11-03
ConAgra DealClosingb11-03ConAgra DealClosingb11-03
ConAgra DealClosingb11-03
 
SharePurchase12-03
SharePurchase12-03SharePurchase12-03
SharePurchase12-03
 
ConAgra Q2Dec03
ConAgra Q2Dec03ConAgra Q2Dec03
ConAgra Q2Dec03
 
ConAgra Q3Mar04
ConAgra Q3Mar04ConAgra Q3Mar04
ConAgra Q3Mar04
 
ConAgra Q4Jul04
ConAgra Q4Jul04ConAgra Q4Jul04
ConAgra Q4Jul04
 
ConAgra Q1Sept22-04
ConAgra Q1Sept22-04ConAgra Q1Sept22-04
ConAgra Q1Sept22-04
 
ConAgra Q2Dec04
ConAgra Q2Dec04ConAgra Q2Dec04
ConAgra Q2Dec04
 
Q3Mar05
Q3Mar05Q3Mar05
Q3Mar05
 
ConAgra Q4Jun05
ConAgra Q4Jun05ConAgra Q4Jun05
ConAgra Q4Jun05
 
ConAgra QAFY06Q1
ConAgra QAFY06Q1ConAgra QAFY06Q1
ConAgra QAFY06Q1
 
ConAgra QAFY06Q2
ConAgra QAFY06Q2ConAgra QAFY06Q2
ConAgra QAFY06Q2
 
ConAgra QAFY06Q3
ConAgra QAFY06Q3ConAgra QAFY06Q3
ConAgra QAFY06Q3
 
ConAgra QAFY06Q4
ConAgra QAFY06Q4ConAgra QAFY06Q4
ConAgra QAFY06Q4
 
ConAgra QAFY07Q1
ConAgra QAFY07Q1ConAgra QAFY07Q1
ConAgra QAFY07Q1
 
ConAgra QAFY07Q2
ConAgra QAFY07Q2ConAgra QAFY07Q2
ConAgra QAFY07Q2
 
ConAgra QAFY07Q3
ConAgra QAFY07Q3ConAgra QAFY07Q3
ConAgra QAFY07Q3
 

Recently uploaded

Stock Market Brief Deck for 4/24/24 .pdf
Stock Market Brief Deck for 4/24/24 .pdfStock Market Brief Deck for 4/24/24 .pdf
Stock Market Brief Deck for 4/24/24 .pdfMichael Silva
 
Chapter 2.ppt of macroeconomics by mankiw 9th edition
Chapter 2.ppt of macroeconomics by mankiw 9th editionChapter 2.ppt of macroeconomics by mankiw 9th edition
Chapter 2.ppt of macroeconomics by mankiw 9th editionMuhammadHusnain82237
 
New dynamic economic model with a digital footprint | European Business Review
New dynamic economic model with a digital footprint | European Business ReviewNew dynamic economic model with a digital footprint | European Business Review
New dynamic economic model with a digital footprint | European Business ReviewAntonis Zairis
 
(TANVI) Call Girls Nanded City ( 7001035870 ) HI-Fi Pune Escorts Service
(TANVI) Call Girls Nanded City ( 7001035870 ) HI-Fi Pune Escorts Service(TANVI) Call Girls Nanded City ( 7001035870 ) HI-Fi Pune Escorts Service
(TANVI) Call Girls Nanded City ( 7001035870 ) HI-Fi Pune Escorts Serviceranjana rawat
 
Shrambal_Distributors_Newsletter_Apr-2024 (1).pdf
Shrambal_Distributors_Newsletter_Apr-2024 (1).pdfShrambal_Distributors_Newsletter_Apr-2024 (1).pdf
Shrambal_Distributors_Newsletter_Apr-2024 (1).pdfvikashdidwania1
 
VIP Kolkata Call Girl Jodhpur Park 👉 8250192130 Available With Room
VIP Kolkata Call Girl Jodhpur Park 👉 8250192130  Available With RoomVIP Kolkata Call Girl Jodhpur Park 👉 8250192130  Available With Room
VIP Kolkata Call Girl Jodhpur Park 👉 8250192130 Available With Roomdivyansh0kumar0
 
Quarter 4- Module 3 Principles of Marketing
Quarter 4- Module 3 Principles of MarketingQuarter 4- Module 3 Principles of Marketing
Quarter 4- Module 3 Principles of MarketingMaristelaRamos12
 
Lundin Gold April 2024 Corporate Presentation v4.pdf
Lundin Gold April 2024 Corporate Presentation v4.pdfLundin Gold April 2024 Corporate Presentation v4.pdf
Lundin Gold April 2024 Corporate Presentation v4.pdfAdnet Communications
 
Instant Issue Debit Cards - School Designs
Instant Issue Debit Cards - School DesignsInstant Issue Debit Cards - School Designs
Instant Issue Debit Cards - School Designsegoetzinger
 
20240429 Calibre April 2024 Investor Presentation.pdf
20240429 Calibre April 2024 Investor Presentation.pdf20240429 Calibre April 2024 Investor Presentation.pdf
20240429 Calibre April 2024 Investor Presentation.pdfAdnet Communications
 
Monthly Market Risk Update: April 2024 [SlideShare]
Monthly Market Risk Update: April 2024 [SlideShare]Monthly Market Risk Update: April 2024 [SlideShare]
Monthly Market Risk Update: April 2024 [SlideShare]Commonwealth
 
Dharavi Russian callg Girls, { 09892124323 } || Call Girl In Mumbai ...
Dharavi Russian callg Girls, { 09892124323 } || Call Girl In Mumbai ...Dharavi Russian callg Girls, { 09892124323 } || Call Girl In Mumbai ...
Dharavi Russian callg Girls, { 09892124323 } || Call Girl In Mumbai ...Pooja Nehwal
 
How Automation is Driving Efficiency Through the Last Mile of Reporting
How Automation is Driving Efficiency Through the Last Mile of ReportingHow Automation is Driving Efficiency Through the Last Mile of Reporting
How Automation is Driving Efficiency Through the Last Mile of ReportingAggregage
 
VIP Call Girls in Saharanpur Aarohi 8250192130 Independent Escort Service Sah...
VIP Call Girls in Saharanpur Aarohi 8250192130 Independent Escort Service Sah...VIP Call Girls in Saharanpur Aarohi 8250192130 Independent Escort Service Sah...
VIP Call Girls in Saharanpur Aarohi 8250192130 Independent Escort Service Sah...Suhani Kapoor
 
Quantitative Analysis of Retail Sector Companies
Quantitative Analysis of Retail Sector CompaniesQuantitative Analysis of Retail Sector Companies
Quantitative Analysis of Retail Sector Companiesprashantbhati354
 
fca-bsps-decision-letter-redacted (1).pdf
fca-bsps-decision-letter-redacted (1).pdffca-bsps-decision-letter-redacted (1).pdf
fca-bsps-decision-letter-redacted (1).pdfHenry Tapper
 
Best VIP Call Girls Noida Sector 18 Call Me: 8448380779
Best VIP Call Girls Noida Sector 18 Call Me: 8448380779Best VIP Call Girls Noida Sector 18 Call Me: 8448380779
Best VIP Call Girls Noida Sector 18 Call Me: 8448380779Delhi Call girls
 

Recently uploaded (20)

Monthly Economic Monitoring of Ukraine No 231, April 2024
Monthly Economic Monitoring of Ukraine No 231, April 2024Monthly Economic Monitoring of Ukraine No 231, April 2024
Monthly Economic Monitoring of Ukraine No 231, April 2024
 
Stock Market Brief Deck for 4/24/24 .pdf
Stock Market Brief Deck for 4/24/24 .pdfStock Market Brief Deck for 4/24/24 .pdf
Stock Market Brief Deck for 4/24/24 .pdf
 
Chapter 2.ppt of macroeconomics by mankiw 9th edition
Chapter 2.ppt of macroeconomics by mankiw 9th editionChapter 2.ppt of macroeconomics by mankiw 9th edition
Chapter 2.ppt of macroeconomics by mankiw 9th edition
 
New dynamic economic model with a digital footprint | European Business Review
New dynamic economic model with a digital footprint | European Business ReviewNew dynamic economic model with a digital footprint | European Business Review
New dynamic economic model with a digital footprint | European Business Review
 
(TANVI) Call Girls Nanded City ( 7001035870 ) HI-Fi Pune Escorts Service
(TANVI) Call Girls Nanded City ( 7001035870 ) HI-Fi Pune Escorts Service(TANVI) Call Girls Nanded City ( 7001035870 ) HI-Fi Pune Escorts Service
(TANVI) Call Girls Nanded City ( 7001035870 ) HI-Fi Pune Escorts Service
 
Shrambal_Distributors_Newsletter_Apr-2024 (1).pdf
Shrambal_Distributors_Newsletter_Apr-2024 (1).pdfShrambal_Distributors_Newsletter_Apr-2024 (1).pdf
Shrambal_Distributors_Newsletter_Apr-2024 (1).pdf
 
VIP Kolkata Call Girl Jodhpur Park 👉 8250192130 Available With Room
VIP Kolkata Call Girl Jodhpur Park 👉 8250192130  Available With RoomVIP Kolkata Call Girl Jodhpur Park 👉 8250192130  Available With Room
VIP Kolkata Call Girl Jodhpur Park 👉 8250192130 Available With Room
 
Commercial Bank Economic Capsule - April 2024
Commercial Bank Economic Capsule - April 2024Commercial Bank Economic Capsule - April 2024
Commercial Bank Economic Capsule - April 2024
 
Quarter 4- Module 3 Principles of Marketing
Quarter 4- Module 3 Principles of MarketingQuarter 4- Module 3 Principles of Marketing
Quarter 4- Module 3 Principles of Marketing
 
Lundin Gold April 2024 Corporate Presentation v4.pdf
Lundin Gold April 2024 Corporate Presentation v4.pdfLundin Gold April 2024 Corporate Presentation v4.pdf
Lundin Gold April 2024 Corporate Presentation v4.pdf
 
Instant Issue Debit Cards - School Designs
Instant Issue Debit Cards - School DesignsInstant Issue Debit Cards - School Designs
Instant Issue Debit Cards - School Designs
 
20240429 Calibre April 2024 Investor Presentation.pdf
20240429 Calibre April 2024 Investor Presentation.pdf20240429 Calibre April 2024 Investor Presentation.pdf
20240429 Calibre April 2024 Investor Presentation.pdf
 
Monthly Market Risk Update: April 2024 [SlideShare]
Monthly Market Risk Update: April 2024 [SlideShare]Monthly Market Risk Update: April 2024 [SlideShare]
Monthly Market Risk Update: April 2024 [SlideShare]
 
Dharavi Russian callg Girls, { 09892124323 } || Call Girl In Mumbai ...
Dharavi Russian callg Girls, { 09892124323 } || Call Girl In Mumbai ...Dharavi Russian callg Girls, { 09892124323 } || Call Girl In Mumbai ...
Dharavi Russian callg Girls, { 09892124323 } || Call Girl In Mumbai ...
 
How Automation is Driving Efficiency Through the Last Mile of Reporting
How Automation is Driving Efficiency Through the Last Mile of ReportingHow Automation is Driving Efficiency Through the Last Mile of Reporting
How Automation is Driving Efficiency Through the Last Mile of Reporting
 
VIP Call Girls in Saharanpur Aarohi 8250192130 Independent Escort Service Sah...
VIP Call Girls in Saharanpur Aarohi 8250192130 Independent Escort Service Sah...VIP Call Girls in Saharanpur Aarohi 8250192130 Independent Escort Service Sah...
VIP Call Girls in Saharanpur Aarohi 8250192130 Independent Escort Service Sah...
 
Quantitative Analysis of Retail Sector Companies
Quantitative Analysis of Retail Sector CompaniesQuantitative Analysis of Retail Sector Companies
Quantitative Analysis of Retail Sector Companies
 
fca-bsps-decision-letter-redacted (1).pdf
fca-bsps-decision-letter-redacted (1).pdffca-bsps-decision-letter-redacted (1).pdf
fca-bsps-decision-letter-redacted (1).pdf
 
Best VIP Call Girls Noida Sector 18 Call Me: 8448380779
Best VIP Call Girls Noida Sector 18 Call Me: 8448380779Best VIP Call Girls Noida Sector 18 Call Me: 8448380779
Best VIP Call Girls Noida Sector 18 Call Me: 8448380779
 
Veritas Interim Report 1 January–31 March 2024
Veritas Interim Report 1 January–31 March 2024Veritas Interim Report 1 January–31 March 2024
Veritas Interim Report 1 January–31 March 2024
 

Duke Energy 02/01/06_RegG

  • 1. Duke Energy Corporation Non-GAAP Reconciliation for SEC Regulation G 2006 Earnings per Share (“EPS”) Incentive Target Measure The slides and prepared remarks for the February 1, 2006 Earnings Conference Call include a discussion of the Company's 2006 EPS incentive target of $1.90 and the minimum payout level of $1.75. This EPS measure is used for employee incentive bonuses and should track ongoing diluted EPS, which is a non-GAAP financial measure as it represents diluted EPS from continuing operations plus the per-share effect of any discontinued operations from the Company’s Crescent Resources real estate unit, adjusted for the per-share impact of special items. Special items represent certain charges and credits which management believes will not be recurring on a regular basis. The most directly comparable GAAP measure for ongoing diluted EPS is reported diluted EPS from continuing operations which includes the impact of special items. Due to the forward- looking nature of this non-GAAP financial measure, information to reconcile this non-GAAP financial measure to the most directly comparable GAAP financial measure is not available at this time as the Company is unable to project any special items for 2006. 2006 and Beyond Ongoing Segment EBIT and Related Growth Percentages The Company’s slides and prepared remarks for the February 1, 2006 Earnings Conference Call include a discussion of forecasted ongoing EBIT for 2006 for certain segments, including a discussion of ongoing equity earnings for Field Services, Other, and ongoing EBIT contributions for Cinergy’s operations post merger, in addition to, for certain segments, a discussion of a forecasted ongoing segment EBIT growth rates, which are based on historical and forecasted ongoing segment EBIT. Ongoing segment or Other EBIT, and related growth rates, are non-GAAP financial measures as they represent reported segment or Other EBIT adjusted for “special items,” which represent certain charges and credits which management believes will not be recurring on a regular basis. The most directly comparable GAAP measure for ongoing segment or Other EBIT is reported segment or Other EBIT, which represents EBIT from continuing operations, including any “special items.” Due to the forward-looking nature of forecasted ongoing segment or Other EBIT and related growth rates, for future periods, information to reconcile these non-GAAP financial measures to the most directly comparable GAAP financial measures is not available at this time as the Company is unable to project any “special items” for any future periods.
  • 2. 2006 Segment EBIT from Continuing and Discontinued Operations for Crescent The Company’s slides and prepared remarks for the February 1, 2006 Earnings Conference Call include a discussion of Crescent Resources’ segment EBIT from continuing and discontinued operations for 2006. As the Company’s segment GAAP measure is EBIT from continuing operations, the combination of segment EBIT from continuing and discontinued operations represents a non-GAAP financial measure. The most directly comparable GAAP measure for Crescent’s segment EBIT from continuing and discontinued operations is reported segment EBIT from continuing operations. Information to reconcile this non-GAAP financial measure to the most directly comparable GAAP financial measure is not available at this time as the Company is unable to forecast those Crescent operations, if any, which will be discontinued operations during 2006. Post-2007 Ongoing Diluted EPS Growth The Company’s prepared remarks for the February 1, 2006 Earnings Conference Call include a discussion of the expected range of growth in ongoing diluted EPS after 2007. These percentages are based on anticipated ongoing diluted EPS amounts for future periods. This ongoing diluted EPS measure is a non-GAAP financial measure as it represents diluted EPS from continuing operations plus the per-share effects of any discontinued operations from the Company’s Crescent Resources real estate unit, adjusted for the impact of special items. Special items represent certain charges and credits which management believes will not be recurring on a regular basis. Management believes that the presentation of ongoing diluted EPS provides useful information to investors, as it allows them to more accurately compare the Company’s ongoing performance across all periods. The most directly comparable GAAP measure for ongoing diluted EPS is reported diluted EPS from continuing operations which includes the impact of special items. Due to the forward-looking nature of ongoing diluted EPS for future periods, information to reconcile such non-GAAP financial measure to the most directly comparable GAAP financial measure is not available at this time as the Company is unable to forecast any special items for future periods. FFO Interest Coverage The Company's slides and script for the February 1, 2006 Earnings Conference Call include a discussion of expected FFO Interest Coverage Ratios for 2006, which is a non-GAAP financial measure. Funds from Operations (numerator) is defined as net cash provided by operating activities on a GAAP basis. Adjustments to the GAAP number primarily include changes in working capital and adjustments for off-credit entities. Cash interest paid (numerator) and interest expense (denominator) on a GAAP basis are adjusted for interest paid on off-credit entity debt and capitalized interest, which includes AFUDC interest.
  • 3. Duke Energy Corporation Field Services Pro-Forma Segment Earnings Reg G Reconciliation (Amounts in millions) Year-Ended 12/31/2005 DEFS LLC Net Income (100%) - Year Ended 12/31/2005 $ 2,166 Less Special Items: Gain on sale of TEPPCO (1,134) Pro-Forma DEFS LLC Net Income (100%) - Year Ended 12/31/2005 1,032 Duke Energy ownership % 50% Pro-Forma Equity Earnings 516 Adjustment for 2005 hedge impacts (238) Pro-Forma Pretax Earnings Impact, Net of Hedging $ 278 Year-Ended 12/31/2006 Projected 2006 DEFS Equity Earnings (50%) $ 500 Pro-Forma Pretax Earnings Impact, Net of Hedging (278) Net Increase $ 222 (approximately $220 million)
  • 4. DUKE ENERGY CORPORATION ONGOING TO REPORTED EARNINGS RECONCILIATION December 2004 Quarter-to-date (Dollars in Millions) Special Items (Note 1) Gains (losses) Discontinued Gains Adjustment on sales and Operations, Ongoing (Losses) on Total Reported to Captive Loss on impairments excluding Earnings sale Adjustments Earnings Insurance Asset of equity Crescent of assets Reserves Exchanges investments Resources SEGMENT EARNINGS BEFORE INTEREST AND TAXES FROM CONTINUING OPERATIONS Franchised Electric $ 252 $ - $ - $ - $ - $ - $ - $ 252 Gas Transmission 328 4 11 - - - 15 343 Field Services 124 - - - - - - 124 Duke Energy North America (41) (30) A - - - - (30) (71) International Energy 64 (3) - - - - (3) 61 Crescent 50 - - - - - - 50 Total reportable segment EBIT 777 (29) 11 - - - (18) 759 Other (80) - (1) 64 B (4) C - 59 (21) Total reportable segment EBIT and other EBIT $ 697 $ (29) $ 10 $ 64 $ (4) $ - $ 41 $ 738 EARNINGS FOR COMMON Total reportable segment EBIT and other EBIT $ 697 $ (29) $ 10 $ 64 $ (4) $ - $ 41 $ 738 Foreign Currency Translation Gains (Losses) 1 - - - - - - 1 Interest Income and other 18 - - - - - - 18 Interest Expense (297) - - - - - - (297) Minority Interest (Expense) Benefit - Interest/Income Tax Expense 11 - - - - - - 11 Income taxes on continuing operations (154) 10 (3) (22) 1 - (14) (168) Discontinued operations, net of taxes 1 - - - - 54 54 55 Trust Preferred/Preferred Dividends (2) - - - - - - (2) Total Earnings for Common $ 275 $ (19) $ 7 $ 42 $ (3) $ 54 $ 81 $ 356 $ 0.29 $ (0.02) $ 0.01 $ 0.04 $ - $ 0.06 $ 0.09 $ 0.38 EARNINGS PER SHARE, BASIC $ 0.28 $ (0.02) $ 0.01 $ 0.04 $ - $ 0.05 $ 0.08 $ 0.36 EARNINGS PER SHARE, DILUTED Note 1 - Amounts for special items are entered net of minority interest A - Net of minority interest of $20 million. B - Recorded in Operation, maintenance and other on the Consolidated Statements of Operations. C - Recorded in Other income and expenses, net on the Consolidated Statements of Operations. Weighted Average Shares (reported and ongoing) - in millions Basic 947 Diluted 983
  • 5. DUKE ENERGY CORPORATION ONGOING TO REPORTED EARNINGS RECONCILIATION December 2005 Quarter-to-date (Dollars in Millions) Special Items (Note 1) Discontinued MTM change on Loss on MTM impact of de- Operations/ Field Services de-designated Ongoing Southeast designated Cumulative Total Reported hedge de- Field Services Tax Adjustments Earnings DENA contract Southeast DENA Effect of Change Adjustments Earnings designation, net hedges for 2005, termination hedges in Accounting net Principle SEGMENT EARNINGS BEFORE INTEREST AND TAXES FROM CONTINUING OPERATIONS Franchised Electric $ 279 $ - $ - $ - $ - $ - $ - $ - $ 279 Gas Transmission 344 - - - - - - - 344 Field Services 127 - 35 B - - - - 35 162 Duke Energy North America - - - - - - - - - International Energy 97 - - - - - - - 97 Crescent 104 - - - - - - - 104 Total reportable segment EBIT 951 - 35 - - - - 35 986 Other (130) (75) A - 64 C (9) D - - (20) (150) Total reportable segment EBIT and other EBIT $ 821 $ (75) $ 35 $ 64 $ (9) $ - $ - $ 15 $ 836 EARNINGS FOR COMMON Total reportable segment EBIT and other EBIT $ 821 $ (75) $ 35 $ 64 $ (9) $ - $ - $ 15 $ 836 Foreign Currency Translation Gains (Losses) 1 - - - - - - - 1 Interest Income and other 22 - - - - - - - 22 Interest Expense (249) - - - - - - - (249) Minority Interest (Expense) Benefit - Interest/Income Tax Expense (1) - - - - - - - (1) Income taxes on Continuing Operations (196) 28 (13) (22) 3 12 - 8 (188) Discontinued Operations, net of taxes 5 - - - - - 184 E,F 184 189 Cumulative Effect of Change in Accounting Principle - - - - - - (4) (4) (4) Trust Preferred/Preferred Dividends (5) - - - - - - - (5) Total Earnings for Common $ 398 $ (47) $ 22 $ 42 $ (6) $ 12 $ 180 $ 203 $ 601 $ 0.43 $ (0.05) $ 0.02 $ 0.05 $ (0.01) $ 0.01 $ 0.20 $ 0.22 $ 0.65 EARNINGS PER SHARE, BASIC $ 0.42 $ (0.04) $ 0.02 $ 0.04 $ (0.01) $ 0.01 $ 0.19 $ 0.21 $ 0.63 EARNINGS PER SHARE, DILUTED Note 1 - Amounts for special items are entered net of minority interest A - Recorded in Gains (Losses) on Sales of Other Assets, net on the Consolidated Statements of Operations. B - Fourth quarter settlement of the 2005 portion of the Field Services de-designated hedges as of 2/22/05, recorded in Equity in earnings of unconsolidated affiliates on the Consolidated Statements of Operations. C - Recorded in Other income and expenses, net on the Consolidated Statements of Operations. D - Recorded in Non-regulated electric, natural gas, natural gas liquids and other revenues on the Consolidated Statements of Operations. E - Excludes Crescent discontinued operations. F - Primarily DENA discontinued operations. Recorded in (Loss) Income From Discontinued Operations, net of tax on the Consolidated Statements of Operations. Weighted Average Shares (reported and ongoing) - in millions Basic 928 Diluted 962
  • 6. DUKE ENERGY CORPORATION ONGOING TO REPORTED EARNINGS RECONCILIATION December 2004 Year-to-date (Dollars in Millions) Special Items (Note 1) Gains Discontinued Gains (losses) on Adjustment to Tax Benefit from Operations, Ongoing (Losses) on Enron Total Reported sales and Captive Impairment DEA excluding Earnings sale Settlement Adjustments Earnings impairments Insurance Loss on Asset Restructuring Crescent of assets of equity Reserves Exchanges Resources investments SEGMENT EARNINGS BEFORE INTEREST AND TAXES FROM CONTINUING OPERATIONS Franchised Electric $ 1,464 $ 3 $ - $ - $ - $ - $ - $ - $ - $ 3 $ 1,467 Gas Transmission 1,297 16 - 16 - - - - - 32 1,329 Field Services 391 1A (10) B (16) C 1 D - - - - (24) 367 Duke Energy North America (190) (403) E - - 8 D,F - - - - (395) (585) International Energy 236 (2) (13) D 1 - - - - - (14) 222 Crescent 240 - - - - - - - - - 240 Total reportable segment EBIT 3,438 (385) (23) 1 9 - - - - (398) 3,040 Other (164) 4 - 2 21 D 64 D (4) G - - 87 (77) Total reportable segment EBIT and other EBIT $ 3,274 $ (381) $ (23) $ 3 $ 30 $ 64 $ (4) $ - $ - $ (311) $ 2,963 EARNINGS FOR COMMON Total reportable segment EBIT and other EBIT $ 3,274 $ (381) $ (23) $ 3 $ 30 $ 64 $ (4) $ - $ - $ (311) $ 2,963 Foreign Currency Translation Gains (Losses) 1 - - - - - - - - - 1 Interest Income and other 64 - - - - - - - - - 64 Interest Expense (1,281) - - - - - - - - - (1,281) Minority Interest (Expense) Benefit - Interest/Income Tax Expense 38 - - - - - - - - - 38 Income taxes on continuing operations (690) 133 8 - (11) (22) 1 48 - 157 (533) Discontinued operations, net of taxes 5 - - - - - - - 233 233 238 Trust Preferred/Preferred Dividends (9) - - - - - - - - - (9) Total Earnings for Common $ 1,402 $ (248) $ (15) $ 3 $ 19 $ 42 $ (3) $ 48 $ 233 $ 79 $ 1,481 $ 1.51 $ (0.27) $ (0.02) $ - $ 0.02 $ 0.05 $ - $ 0.05 $ 0.25 $ 0.08 $ 1.59 EARNINGS PER SHARE, BASIC $ 1.46 $ (0.25) $ (0.02) $ - $ 0.02 $ 0.04 $ - $ 0.05 $ 0.24 $ 0.08 $ 1.54 EARNINGS PER SHARE, DILUTED Note 1 - Amounts for special items are entered net of minority interest A - Net of minority interest of $1 million. B - Net of minority interest of $12 million. C - Net of minority interest of $7 million. D - Recorded in Operation, maintenance and other on the Consolidated Statements of Operations. E - $(397) million recorded in Gains (Losses) on Sales of Other Assets, net (net of $25 million of minority interest) and $(6) million recorded in Operation, maintenance and other on the Consolidated Statements of Operations. F - Amount is net of $5 million of minority interest. G -Recorded in Other income and expenses, net on the Consolidated Statements of Operations. Weighted Average Shares (reported and ongoing) - in millions Basic 931 Diluted 966
  • 7. DUKE ENERGY CORPORATION ONGOING TO REPORTED EARNINGS RECONCILIATION December 2005 Year-to-date (Dollars in Millions) Special Items (Note 1) Initial gain and Discontinued Loss on Gain on Gains (losses) Mutual Field Services subsequent Operations/ Southeast transfer of on sales and Ongoing insurance hedge de- MTM change on Tax Cumulative Effect Total Reported DENA 19.7% impairments of Earnings liability designation, de-designated Adjustments of Change in Adjustments Earnings contract interest in equity adjustment net Southeast DENA Accounting termination DEFS investments hedges Principle SEGMENT EARNINGS BEFORE INTEREST AND TAXES FROM CONTINUING OPERATIONS Franchised Electric $ 1,495 $ - $ - $ - $ - $ - $ - $ - $ - $ - $ 1,495 Gas Transmission 1,388 - - - - - - - - - 1,388 Field Services 505 - - 576 C 888 A (23) B - - - 1,441 1,946 Duke Energy North America - - - - - - - - - - - International Energy 334 - - - (20) E - - - - (20) 314 Crescent 314 - - - - - - - - - 314 Total reportable segment EBIT 4,036 - - 576 868 (23) - - - 1,421 5,457 Other (563) (75) C (28) D - - - 21 F - - (82) (645) Total reportable segment EBIT and other EBIT $ 3,473 $ (75) $ (28) $ 576 $ 868 $ (23) $ 21 $ - $ - $ 1,339 $ 4,812 EARNINGS FOR COMMON Total reportable segment EBIT and other EBIT $ 3,473 $ (75) $ (28) $ 576 $ 868 $ (23) $ 21 $ - $ - $ 1,339 $ 4,812 Foreign Currency Translation Gains (Losses) (11) - - - - - - - - - (11) Interest Income and other 57 - - - - - - - - - 57 Interest Expense (1,062) - - - - - - - - - (1,062) Minority Interest (Expense) Benefit - Interest/Income Tax Expense 20 - - - - - - - - - 20 Income taxes on Continuing Operations (798) 28 10 (213) (323) 9 (8) 12 - (485) (1,283) Discontinued Operations, net of taxes 7 - - - - - - - (712) G,H (712) (705) Cumulative Effect of Change in Accounting Principle - - - - - - - - (4) (4) (4) Trust Preferred/Preferred Dividends (12) - - - - - - - - - (12) Total Earnings for Common $ 1,674 $ (47) $ (18) $ 363 $ 545 $ (14) $ 13 $ 12 $ (716) $ 138 $ 1,812 $ 1.79 $ (0.05) $ (0.02) $ 0.39 $ 0.58 $ (0.01) $ 0.01 $ 0.01 $ (0.76) $ 0.15 $ 1.94 EARNINGS PER SHARE, BASIC $ 1.73 $ (0.04) $ (0.02) $ 0.37 $ 0.56 $ (0.01) $ 0.01 $ 0.01 $ (0.73) $ 0.15 $ 1.88 EARNINGS PER SHARE, DILUTED Note 1 - Amounts for special items are entered net of minority interest A - Gain on sale of investment in units of TEPPCO LP, $97 million, and TEPPCO GP, $791 million net of $343 million of minority interest. B - De-designation of hedges due to the transfer of 19.7% interest in DEFS to ConocoPhillips. $125 million loss recorded in Impairment and other charges on the Consolidated Statements of Operations, reduced by $29 million of hedge settlements recorded in Non-regulated electric, natural gas, natural gas liquids and other revenues, and $73 million of hedge settlements recorded in Equity in Earnings of Unconsolidated Affiliates on the Consolidated Statements of Operations. C - Recorded in Gains (Losses) on Sales of Other Assets, net on the Consolidated Statements of Operations. D - Recorded in Operation, maintenance and other on the Consolidated Statements of Operations. E - Campeche equity investment impairment, recorded in Gains (Losses) on sales and impairments of equity investments on the Consolidated Statements of Operations. F - Recorded in Non-regulated electric, natural gas, natural gas liquids and other revenues on the Consolidated Statements of Operations. G - Excludes Crescent discontinued operations. H - Primarily the non-cash, after-tax charge related to the planned exit of substantially all of DENA's physical and commercial assets outside the midwestern United States and the reclassification of DENA 2005 operations. Recorded in (Loss) Income From Discontinued Operations, net of tax on the Consolidated Statements of Operations. Weighted Average Shares (reported and ongoing) - in millions Basic 934 Diluted 970
  • 8. Duke Energy Corporation Consolidated Cash Flow Reconciliation Required by SEC Regulation G ($ in Millions) 2006 Estimate Primary Sources: Net income (Based on $1.90 per ongoing diluted share target) (1) a $ 2,225 Depreciation & amortization a 2,075 NBV of ongoing Crescent sales a 425 NBV of asset and equity investment sales b 1,475 Book/Tax timing differences a 700 Other sources/(uses), net a (650) Total Sources 6,250 Primary Uses: Capital expenditures b (4,325) Dividends c (1,450) Total Uses (5,775) Positive Net Cash $ 475 Reconciliations to amounts per U.S. GAAP reporting: Operating cash flow components from above [summation of (a)] $ 4,775 Reconciling items to GAAP operating cash flow (2) (875) Net cash provided by operating activities per GAAP Consolidated Statement of Cash Flows $ 3,900 Investing cash flow components from above [summation of (b)] $ (2,850) Reconciling items to GAAP investing cash flow (3) 1,400 Net cash used in investing activities per GAAP Consolidated Statement of Cash Flows $ (1,450) Financing cash flow components from above [summation of (c)] $ (1,450) Reconciling items to GAAP financing cash flow (4) (1,000) Net cash used by financing activities per GAAP Consolidated Statement of Cash Flows $ (2,450) Notes: (1) Forecast net income of $2,225 million for 2006 is based on Duke Energy's 2006 employee incentive earnings target of $1.90 of ongoing diluted earnings per share (EPS). This EPS measure is used for employee incentive bonuses and should track ongoing diluted EPS, which is a non-GAAP financial measure as it represents diluted EPS from continuing operations plus the per-share effect of any discontinued operations from the Company’s Crescent Resources real estate unit, adjusted for the per-share impact of special items. Special items represent certain charges and credits which management believes will not be recurring on a regular basis. The most directly comparable GAAP measure for ongoing diluted EPS is reported diluted EPS from continuing operations which includes the impact of special items. Due to the forward-looking nature of this non-GAAP financial measure, information to reconcile this non-GAAP financial measure to the most directly comparable GAAP financial measure is not available at this time as the Company is unable to project any special items for 2006 (2) Amount consists primarily of non-operating cash flow items such as proceeds from the sales of commercial and multi-family real estate, and other operating cash flow reductions such as capital expenditures for residential real estate and gain on the sale of other assets and equity investments. (3) Amount consists primarily of proceeds from the sales of commercial and multi-family real estate, proceeds from the sale of other assets and equity investments in excess of book value (i.e. gain on sale), capital expenditures for residentia real estate, and net proceeds from the purchase and sale of available-for-sale securities (4) Amount consists of estimated net other financing activities.