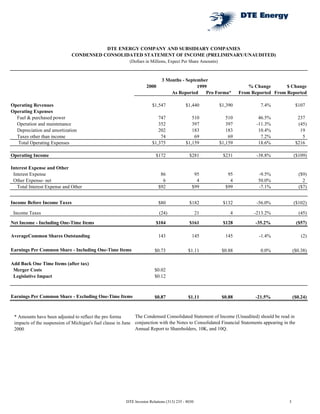
1. DTE ENERGY COMPANY AND SUBSIDIARY COMPANIES
CONDENSED CONSOLIDATED STATEMENT OF INCOME (PRELIMINARY/UNAUDITED)
(Dollars in Millions, Expect Per Share Amounts)
3 Months - September
2000 % Change $ Change
1999
As Reported Pro Forma* From Reported From Reported
Operating Revenues $1,547 $1,440 $1,390 7.4% $107
Operating Expenses
Fuel & purchased power 747 510 510 46.5% 237
Operation and maintenance 352 397 397 -11.3% (45)
Depreciation and amortization 202 183 183 10.4% 19
Taxes other than income 74 69 69 7.2% 5
Total Operating Expenses $1,375 $1,159 $1,159 18.6% $216
Operating Income $172 $281 $231 -38.8% ($109)
Interest Expense and Other
Interest Expense 86 95 95 -9.5% ($9)
Other Expense- net 6 4 4 50.0% 2
Total Interest Expense and Other $92 $99 $99 -7.1% ($7)
Income Before Income Taxes $80 $182 $132 -56.0% ($102)
Income Taxes (24) 21 4 -213.2% (45)
Net Income - Including One-Time Items $104 $161 $128 -35.2% ($57)
AverageCommon Shares Outstanding 143 145 145 -1.4% (2)
Earnings Per Common Share - Including One-Time Items $0.73 $1.11 $0.88 0.0% ($0.38)
Add Back One Time Items (after tax)
Merger Costs $0.02
Legislative Impact $0.12
Earnings Per Common Share - Excluding One-Time Items $0.87 $1.11 $0.88 -21.5% ($0.24)
The Condensed Consolidated Statement of Income (Unaudited) should be read in
* Amounts have been adjusted to reflect the pro forma
impacts of the suspension of Michigan's fuel clause in June conjunction with the Notes to Consolidated Financial Statements appearing in the
Annual Report to Shareholders, 10K, and 10Q.
2000
DTE Investor Relations (313) 235 - 8030 3
2. DTE ENERGY COMPANY AND SUBSIDIARY COMPANIES
CONDENSED CONSOLIDATED STATEMENT OF INCOME (PRELIMINARY/UNAUDITED)
(Dollars in Millions, Expect Per Share Amounts)
9 Months - September
2000 % Change $ Change
1999
As Reported Pro Forma* From Reported From Reported
Operating Revenues $4,157 $3,614 $3,538 15.0% $543
Operating Expenses
Fuel & purchased power 1,670 1,063 1,063 57.1% 607
Operation and maintenance 1,093 1,086 1,086 0.6% 7
Depreciation and amortization 580 547 547 6.0% 33
Taxes other than income 224 211 211 6.2% 13
Total Operating Expenses $3,567 $2,907 $2,907 22.7% $660
Operating Income $590 $707 $631 -16.6% ($117)
Interest Expense and Other
Interest Expense 251 260 260 -3.5% ($9)
Other Expense- net 9 13 13 -33.1% (4)
Total Interest Expense and Other $260 $273 $273 -4.9% ($13)
Income Before Income Taxes $330 $434 $358 -23.9% ($104)
Income Taxes 1 48 22 -97.9% (47)
Net Income - Including One-Time Items $329 $386 $336 -14.7% ($57)
AverageCommon Shares Outstanding 143 145 145 -1.4% (2.0)
Earnings Per Common Share - Including One-Time
Items $2.30 $2.66 $2.32 0.0% ($0.36)
Add Back One Time Items (after tax)
Merger Costs $0.08
Legislative Impact $0.06
Earnings Per Common Share - Excluding One-Time
Items $2.44 $2.66 $2.32 -8.3% ($0.22)
* Amounts have been adjusted to reflect the pro forma The Condensed Consolidated Statement of Income (Unaudited) should be read in
impacts of the suspension of Michigan's fuel clause in conjunction with the Notes to Consolidated Financial Statements appearing in the Annual
Report to Shareholders, 10K, and 10Q.
June 2000
DTE Investor Relations (313) 235 - 8030 4
3. DTE ENERGY COMPANY AND SUBSIDIARY COMPANIES
Earnings Analysis 3rd Quarter
Change from 9/30/99 After-Tax
Per Share Impact*
DTE Energy Beginning Earnings Per Share - Third Quarter 1999 $1.11
Effect of PSCR Freeze ($0.23)
Pro Forma EPS $0.88
Adjustment from change in shares outstanding (from 145mm to 142.7mm) $0.01
Net Margin:
Revenue - Lower residential sales due to cooler weather ($0.15)
Fuel and Purchased Power - Higher than expected power costs and out of market purchased power
($0.22)
contracts
Regulated Net Revenues - excluding impact of legislation ($0.37)
Legislative Impacts ($0.12)
Regulated Oper. & Maintenance Expense
1999 Storms Expense - no storms in 3Q 2000 $0.12
Energy Distribution - lower operating costs; reduced outages due to mild weather $0.04
Incremental Y2K costs $0.03
1997 Storm cost amortization booked in 1999 $0.02
Nuclear Generation - lower operating costs $0.02
Other $0.02
Merger Related Costs ($0.02)
Regulated Oper. & Maintenance Expense $0.23
Depreciation & Amortization
($0.03)
Accelerated depreciation of Fermi 2, higher plant in service
Interest & Other
$0.02
1999 Write-off of unamortized debt costs on early redemptions
Income Taxes
Reduction in pre-tax income and favorable adjustments to 1999 tax return $0.08
Regulated Net Income(Detroit Edison) $0.70
Non-Regulated Net Income:
$0.02
DTE Energy Services
$0.04
Merchant Generation activities
($0.01)
Increased Plug Power Losses
($0.02)
Holding Company & Capital
Total Non-Regulated $0.03
$0.73
Reported Earnings per Share - Including One-Time Merger and Legislative Impacts
Add Back:
Legislative Impacts $0.12
Merger Related Costs $0.02
$0.87
Normalized Earnings
* Differences may exist due to rounding. DTE Investor Relations (313) 235 - 8030 5
5. Non-Regulated Earnings Per Share by Activity
4Q 1999 1Q 2000 2Q 2000 3Q 2000 Total
Coal Related $0.15 $0.15 $0.18 $0.21 $0.69
DTE Energy Services
DTE Coal Services
Renewables $0.01 $0.01 $0.01 $0.01 $0.04
DTE Biomass Energy
Market Development $0.01 ($0.01) ($0.01) $0.02 $0.01
DTE Energy Trading
DTE Energy Technologies
DTE Energy Marketing
Other $0.02 $0.02 $0.00 $0.00 $0.04
DTE Generation
Syndeco Realty
Edison Development Corp
Total Non-Regulated Subsidiaries
$0.19 $0.17 $0.18 $0.24 $0.78
(excluding Plug Power)
Plug Power ($0.04) ($0.02) ($0.03) ($0.03) ($0.12)
$0.15 $0.15 $0.15 $0.21 $0.66
Total Non-Regulated (including Plug Power)
DTE Capital/ Holding Co. ($0.07) ($0.01) ($0.02) ($0.02) ($0.12)
Total Non-Regulated EPS $0.08 $0.14 $0.13 $0.19 $0.54
Differences may exist due to rounding
DTE Investor Relations (313) 235-8030 7
6. DTE ENERGY COMPANY AND SUBSIDIARY COMPANIES
CONDENSED CONSOLIDATED BALANCE SHEET (PRELIMINARY/UNAUDITED)
(Dollars in Millions)
Percent
ASSETS Sept. 30, 2000 Dec. 31, 1999 Change
Current Assets
Cash and Cash Equivalents $46 $33 41.8%
Restricted Cash 78 131 -40.5%
Accounts Receivable
Customer (less allowance for doubtful
accounts) 533 388 37.6%
Accrued Unbilled Revenues 157 166 -5.5%
Other 149 144 3.3%
Inventories (at average cost)
Fuel 153 175 -12.6%
Materials and Supplies 170 168 1.4%
Asset from Risk Management Activities 41 67 -38.5%
Prepaids and Other 67 38 76.3%
$1,394 $1,310 6.4%
Investments
Nuclear Decommissioning Trust Funds $398 $361 10.4%
Other 216 212 1.9%
Plug Power 46 63 -27.0%
$660 635 4.0%
Property
Property, Plant and Equipment $11,992 $11,755 2.0%
Property under Capital Leases 221 222 -0.5%
Nuclear Fuel under Capital Lease 704 663 6.2%
Construction Work in Progress 114 106 7.5%
$13,031 $12,746 2.2%
Less Accumulated Depreciation & Amortization 5,704 5,598 1.9%
$7,327 $7,148 2.5%
Regulatory Assets $2,695 $2,935 -8.2%
Other Assets $270 $288 -6.3%
Total Assets $12,346 $12,316 0.2%
The Condensed Consolidated Balance Sheet (Unaudited) should be read in conjunction with the
Notes to Consolidated Financial Statements appearing in the Annual Report to Shareholders, 10K, and 10Q.
DTE Investor Relations (313) 235-8030 8
7. DTE ENERGY COMPANY AND SUBSIDIARY COMPANIES
CONDENSED CONSOLIDATED BALANCE SHEET (PRELIMINARY/UNAUDITED)
(Dollars in Millions)
Percent
LIABILITIES AND SHAREHOLDERS' EQUITY Sept. 30, 2000 Dec. 31, 1999 Change
Current Liabilities
Accounts Payable $231 $273 -15.3%
Accrued Interest 70 57 21.7%
Dividends Payable 73 75 -1.6%
Accrued Payroll 86 97 -12.1%
Short-term Borrowings 551 387 42.3%
Income taxes 99 61 62.5%
Current Portion Long-term Debt 234 270 -13.4%
Current Portion Capital Leases 93 75 24.2%
Liability from Risk Management Activities 35 52 -32.6%
Other 305 257 18.6%
$1,777 $1,604 10.8%
Other Liabilities
Deferred Income Taxes $1,802 $1,925 -6.4%
Capital Leases 106 114 -7.0%
Regulatory Liabilities 190 262 -27.4%
Other 586 564 3.9%
$2,684 $2,865 -6.3%
Long-Term Debt $3,936 $3,938 -0.1%
Shareholders' Equity
Common Stock, without par value, 400,000,000 shares authorized,
$1,918 $1,950 -1.6%
142,653,454 and 145,041,324 issued and outstanding, respectively
Retained Earnings 2,031 1,959 3.7%
Total Shareholders' Equity $3,949 $3,909 1.0%
Total Liabilities and Shareholders' Equity $12,346 $12,316 0.2%
The Condensed Consolidated Balance Sheet (Unaudited) should be read in conjunction with the Notes to
Consolidated Financial Statements appearing in the Annual Report to Shareholders, 10K, and 10Q.
DTE Investor Relations (313) 235-8030 9
8. DTE ENERGY COMPANY
CONDENSED CONSOLIDATED STATEMENT OF CASH FLOWS
(PRELIMINARY/UNAUDITED)
(Dollars in Millions)
9 Months Ended
September 30
2000 1999
Operating Activities
Net Income $329 $386
Adjustments to reconcile net income to net cash from operating activities:
Depreciation and Amortization 580 547
Other (97) (72)
Changes in current assets and liabilities:
Restricted Cash 53 (11)
Accounts Receivable (141) (84)
Inventories 20 30
Payables (40) (43)
Prepaid Property Taxes and Other 20 (16)
Net cash from operating activities $724 $737
Investing Activities
Plant and Equipment Expenditures ($546) ($530)
Net cash used for investing activities (546) (530)
Financing Activities
Issuance of Long-term Debt $273 $265
Increase in Short-term Borrowings 164 65
Increase in restricted cash for debt redemptions (185)
Redemption of Long-term Debt (310) (204)
Repurchase of Common Stock (70)
Dividends on Common Stock (222) (224)
Net cash used for financing activities ($165) ($283)
Net Increase (Decrease) in Cash and Cash Equivalents $13 ($76)
Cash and Cash Equivalents at Beginning of the Period $33 $130
Cash and Cash Equivalents at End of the Period $46 $54
Supplementary Cash Flow Information
Interest paid (excluding interest capitalized) $238 $263
Income Taxes paid 59 102
New Capital lease obligations 41 3
The Condensed Consolidated Statement of Cash Flows (Unaudited) should be
read in conjunction with the Notes to Consolidated Financial Statements
appearing in the Annual Report to Shareholders, 10K, and 10Q.
10
DTE Investor Relations (313) 235-8030
9. The Detroit Edison Company
Statement of Income (Preliminary/Unaudited)
(Dollars in Millions, Except Per Share Amounts)
3 Months - September
2000 % Change $ Change
1999
As Reported Pro Forma* From Reported From Reported
Operating Revenues $1,109 $1,211 $1,161 -8.4% ($102)
Operating Expenses
Fuel and Purchased power $455 $405 $405 12.3% $50
Operation and Maintenance 224 275 275 -18.8% (52)
Depreciation and amortization 191 176 176 8.7% 15
Taxes other than income 72 69 69 5.5% 4
Total Operating Expenses $942 $925 $925 1.9% $17
Operating Income $167 $286 $236 -41.7% ($119)
Interest Expense and Other
Interest Expense $70 $82 $81 -14.9% ($12)
Other - net 4 1 1 209.6% 3
Total Interest Expense and Other $74 $83 $83 -11.4% ($10)
Income Before Income Taxes $93 $203 $153 -54.1% ($110)
Income Taxes $17 $65 $47 -73.9% ($48)
Net Income $76 $138 $106 -44.8% ($62)
* Amounts have been adjusted to reflect the pro The Condensed Consolidated Statement of Income (Unaudited) should be read in
forma impacts of the suspension of Michigan's conjunction with the Notes to Consolidated Financial Statements appearing in the Annual
fuel clause in June 2000 Report to Shareholders, 10K, and 10Q.
DTE Investor Relations (313) 235-8030 11
10. The Detroit Edison Company
Statement of Income (Preliminary/Unaudited)
(Dollars in Millions, Except Per Share Amounts)
9 Months - September
2000 % Change $ Change
1999
As Reported Pro Forma* From Reported From Reported
Operating Revenues $3,129 $3,128 $3,052 0.0% $1
Operating Expenses
Fuel and Purchased power $1,020 $888 $888 14.9% 132
Operation and Maintenance 736 773 774 -4.8% (37)
Depreciation and amortization 550 522 522 5.4% 28
Taxes other than income 219 210 210 4.4% 9
Total Operating Expenses $2,525 $2,393 $2,393 5.5% $132
Operating Income $604 $735 $659 -17.8% ($131)
Interest Expense and Other
Interest Expense $209 $219 $219 -4.6% (10)
Other - net 13 3 3 353.2% 10
Total Interest Expense and Other $222 $222 $222 0.1% $0
Income Before Income Taxes $382 $513 $437 -25.5% ($131)
Income Taxes $118 $164 $138 -28.4% ($47)
Net Income $264 $349 $299 -24.4% ($85)
* Amounts have been adjusted to reflect the pro The Condensed Consolidated Statement of Income (Unaudited) should be read in
forma impacts of the suspension of Michigan's conjunction with the Notes to Consolidated Financial Statements appearing in the Annual
fuel clause in June 2000 Report to Shareholders, 10K, and 10Q.
DTE Investor Relations (313) 235-8030 12
11. DTE ENERGY COMPANY AND SUBSIDIARY COMPANIES
SELECTED FINANCIAL RATIOS (PRELIMINARY/UNAUDITED)
Twelve Months Ended
September
2000 1999
Coverage Ratios (SEC Basis):
2.21 2.42
Ratio of Earnings to Fixed Charges (SEC Basis)
Ratio of Earnings to Fixed Charges
2.27 2.52
(Excluding Non-Recourse Debt Interest Expense)
10.9% 13.2%
Return on Average Common Equity - DTE Energy
69.6% 61.0%
Common Stock Dividend Payout
110.3% 135.3%
Funds Generated Internally for Construction
3.1% 8.1%
Effective Federal Income Tax Rate
$27.68 $26.60
Book Value Per Common Share
Capital Structure
Traditional Method
50.1% 49.2%
Common Shareholders' Equity
0.0% 0.0%
Preferred Stock
4.9% 4.9%
Deeply Subordinated Debt (QUIDS)
45.0% 45.9%
Long-Term Debt
100% 100%
Total
Rating Agency Method
44.6% 43.3%
Common Shareholders' Equity
(1)
4.3% 4.3%
Preferred Stock & Deeply Subordinated Debt (QUIDS)
Long-Term Debt (2) 51.1% 52.4%
100% 100%
Total
Capital Structure
(Excluding Non-Recourse Debt)
Traditional Method
51.3% 51.0%
Common Shareholders' Equity
0.0% 0.0%
Preferred Stock
5.0% 5.1%
Deeply Subordinated Debt (QUIDS)
43.7% 43.9%
Long-Term Debt
100% 100%
Total
Rating Agency Method
45.9% 45.2%
Common Shareholders' Equity
(1)
4.5% 4.5%
Preferred Stock & Deeply Subordinated Debt (QUIDS)
Long-Term Debt (2) 49.6% 50.3%
100% 100%
Total
(1)
Includes amounts due within one year.
(2)
Includes amounts due within one year, obligations under capital leases (current and non-current) and short-term debt.
DTE Investor Relations (313) 235-8030 13