SlideShare a Scribd company logo
1 of 11
Download to read offline
DTE ENERGY COMPANY AND SUBSIDIARY COMPANIES
             CONDENSED CONSOLIDATED STATEMENT OF INCOME (PRELIMINARY/UNAUDITED)
                                           (Dollars in Millions, Expect Per Share Amounts)

                                                   3 Months June 30                                                  After Tax
                                                       1999         1998              % Change        $ Change    EPS Impact *
Operating Revenues                                   $1,150       $1,064                  8.1%            $86           $0.39
Operating Expenses
  Fuel & Purchased power                                322                285               13.0%         37            ($0.17)
  Operation and maintenance                             364                300               21.3%         64            ($0.29)
  Depreciation and amortization                         182                162               12.3%         20            ($0.09)
  Taxes other than income                                71                 69                2.9%          2            ($0.01)
  Total Operating Expenses                             $939               $816               15.1%       $123            ($0.55)

Operating Income                                       $211               $248               -14.9%      ($37)           ($0.17)

Interest Expense and Other
 Interest Expense                                        82                  79                3.8%        $3            ($0.01)
 Pref. Stock Dividend of Subsidiary                     -                     2             -100.0%        (2)            $0.01
 Other Expense- net                                       6                   5               20.0%         1            ($0.00)
   Net Interest Expense and Other                       $88                 $86                2.3%        $2            ($0.01)


Income Before Income Taxes                             $123               $162               -24.1%      ($39)           ($0.17)

 Income Taxes                                             13                 61              -78.7%       (48)            $0.24
Net Income                                             $110               $101                8.9%         $9             $0.07

Common Sh. Outstanding - Avg                            145                 145              0.00%
Earnings Per Common Share                             $0.76               $0.69              10.2%                        $0.07


* Earnings impact figures are estimates     The Condensed Consolidated Statement of Income (Unaudited) should be read in
  Differences may exist due to rounding     conjunction with the Notes to Consolidated Financial Statements appearing in the
  Please see additional detail on Page 4    Annual Report to Shareholders, 10K, and 10Q.


                                                  DTE Investor Relations (313) 235 - 8030                                      2
DTE ENERGY COMPANY AND SUBSIDIARY COMPANIES
               CONDENSED CONSOLIDATED STATEMENT OF INCOME (PRELIMINARY/UNAUDITED)
                                          (Dollars in Millions, Expect Per Share Amounts)


                                                  6 Months June 30                                                   After Tax
                                                    1999           1998                     % Change   $ Change   EPS Impact *
Operating Revenues                                $2,174         $2,009                         8.2%      $165          $0.74
Operating Expenses
 Fuel and Purchased power                            553                    493                12.2%        60          ($0.27)
 Operation and Maintenance                           689                    568                21.3%       121          ($0.54)
 Depreciation and amortization                       364                    327                11.3%        37          ($0.17)
 Taxes other than income                             142                    140                 1.4%         2          ($0.01)
  Total Operating Expenses                        $1,748                $1,528                 14.4%      $220          ($0.99)

Operating Income                                    $426                  $481                -11.4%      ($55)         ($0.25)

Interest Expense and Other
 Interest Expense                                     165                  153                  7.8%        12          ($0.05)
 Pref. Stock Dividend of Subsidiary                   -                      5               -100.0%        (5)          $0.02
 Other - net                                            9                    5                 80.0%         4           $0.02

  Net Interest Expense and Other                    $174                  $163                  6.7%       $11          ($0.08)

Income Before Income Taxes                          $252                  $318                -20.8%      ($66)         ($0.32)

Income Taxes                                         $27                  $113                -76.1%       (86)         $0.46
Net Income                                          $225                  $205                  9.8%       $20          $0.14

Common Sh. Outstanding - Avg                         145                  145                 -0.06%
Earnings Per Common Share                           $1.55                $1.41                  9.9%                    $0.14

* Earnings impact figures are estimates   The Condensed Consolidated Statement of Income (Unaudited) should be read in
  Differences may exist due to rounding   conjunction with the Notes to Consolidated Financial Statements appearing in the
                                          Annual Report to Shareholders, 10K, and 10Q.


                                            DTE Investor Relations (313) 235-8030                                       3
DTE ENERGY COMPANY AND SUBSIDIARY COMPANIES
Earnings Analysis - Detail                                     2nd Quarter
Change from 06/30/98                                             After-Tax
                                                          Per Share Impact
Beginning Earnings Per Share                                              $0.69

Regulated Operating Revenues
Net System Sales                                                          $0.08
Fuel and Purchased Power                                                  (0.04)
Other                                                                     (0.02)

Total Regulated Net Revenues                                              $0.02

Regulated Oper. & Maintenance Expense

Year 2000 Costs                                                           (0.06)
Other                                                                     (0.01)

Regulated Oper. & Maintenance Expense                                    ($0.07)

Depreciation & Amortization                                               (0.05)

Interest Expense                                                          $0.02

Income Taxes
Primarily due to lower pretax income and full
normalization of Fermi regulatory assets in 1999
                                                                          $0.17

Preferred Dividends                                                       $0.01

Regulated Net Income (Detroit Edison)                                     $0.09

Non-Regulated Net Income:

Increased income due to full
                                                                          $0.03
year operations of coke

Write-down for discontinuation of DTE CoEnergy                           ($0.02)

Plug Power Expenses                                                      ($0.01)

Subtotal: Non-Regulated Subsidiaries                                      $0.00

DTE Energy Holding and DTE Capital Inc.                                  ($0.03)

Earnings Per Share Change                                                 $0.07


DTE Energy Ending Earnings Per Share                                      $0.76

Differences may exist due to rounding.


                                           DTE Investor Relations (313) 235-8030   4
DTE ENERGY COMPANY AND SUBSIDIARY COMPANIES
                                                      TRAILING 12-MONTH ANALYSIS - REPORTED EPS
                                                                    As of June 30, 1999

Detroit Edison
                                                           3Q              4Q               1Q         2Q      Total
                                          1998          $0.86           $0.87            $0.66      $0.64     $3.03
                                          1999          $0.85           $0.68            $0.71      $0.74     $2.98


Non-Regulated Subsidiaries                       (Additional Detail Provided Below)
                                                           3Q              4Q               1Q         2Q      Total
                                          1998          $0.05           $0.03            $0.06      $0.07     $0.21
                                          1999          $0.07           $0.09            $0.10      $0.07     $0.33


DTE Capital / DTE Holding Company
                                                           3Q              4Q               1Q          2Q      Total
                                          1998          $0.00          ($0.01)           $0.00      ($0.02)   ($0.03)
                                          1999         ($0.01)         ($0.04)          ($0.02)     ($0.05)   ($0.12)


DTE Energy Company
                                                           3Q              4Q               1Q         2Q      Total
                                          1998          $0.91           $0.89            $0.72      $0.69     $3.21
                                          1999          $0.91           $0.73            $0.79      $0.76     $3.19


                            1999 Non-Regulated Earnings Per Share by Activity *

                                                           1Q              2Q               3Q          4Q      Total
Coal Related                                            $0.11           $0.11                                  $0.22
Renewables                                              $0.01           $0.00                                  $0.01
Market Development                                     ($0.01)         ($0.03)                                ($0.04)
Plug Power, LLC                                        ($0.01)         ($0.02)                                ($0.02)
Other                                                   $0.00          ($0.00)                                ($0.00)
Total Non-Regulated Subsidiaries                        $0.10           $0.07            $0.00      $0.00     $0.17

DTE Capital / DTE Holding Co.                          ($0.02)         ($0.05)                                ($0.07)
Total 1999 Non-Regulated EPS                            $0.08           $0.02            $0.00      $0.00     $0.10

* Differences may exist due to rounding


                                                            DTE Investor Relations (313) 235-8030                       5
DTE ENERGY COMPANY AND SUBSIDIARY COMPANIES
        CONDENSED CONSOLIDATED BALANCE SHEET (PRELIMINARY/UNAUDITED)
                                (Dollars in Millions, Expect Per Share Amounts)

                                                                                                 Percent
ASSETS                                                     June 30, 1999        Dec. 31, 1998    Change
Current Assets
 Cash and Cash Equivalents                                            $35              $130       -73.1%
 Restricted Cash                                                      123               121         1.7%
 Acounts Receivable
    Customer (less allowance for doubtful
          accounts of $21 and $20, respectively)                      346               316         9.5%
    Accrued Unbilled Revenues                                         203               153        32.7%
    Other                                                             107               135       -20.7%
 Inventories (at average cost)
  Fuel                                                               165                 171      -3.5%
  Materials and Supplies                                             156                 167      -6.6%
 Other                                                               117                  39     200.0%
  Total Current Assets                                            $1,252              $1,232       1.6%

Investments
 Nuclear Decommissioning Trust Funds                                 339                309         9.7%
 Other                                                               242                261        -7.3%
                                                                    $581               $570         1.9%

Property
 Property, Plant and Equipment                                    11,364              11,121        2.2%
 Property under Capital Leases                                       234                 242       -3.3%
 Nuclear Fuel under Capital Lease                                    662                 659        0.5%
 Construction Work in Progress                                       200                 156       28.2%
                                                                 $12,460             $12,178        2.3%
Less Accumulated Depreciation & Amortization                       5,411               5,235        3.4%
                                                                   7,049               6,943        1.5%


Regulatory Assets                                                   3,026              3,091       -2.1%

Other Assets                                                          273               252         8.3%


Total Assets                                                     $12,181             $12,088        0.8%

The Condensed Consolidated Balance Sheet (Unaudited) should be read in conjunction with the
Notes to Consolidated Financial Statements appearing in the Annual Report to Shareholders, 10K, and 10Q.


                                             DTE Investor Relations (313) 235-8030                         6
DTE ENERGY COMPANY AND SUBSIDIARY COMPANIES
             CONDENSED CONSOLIDATED BALANCE SHEET (PRELIMINARY/UNAUDITED)
                                     (Dollars in Millions, Except Per Share Amounts)

                                                                                                       Percent
LIABILITIES                                                        June 30, 1999       Dec. 31, 1998   Change
Current Liabilities
 Accounts Payable                                                            $233             $239      -2.5%
 Accrued Interest                                                              56               57      -1.8%
 Dividends Payable                                                             75               75       0.0%
 Accrued Payroll                                                               87              101     -13.9%
 Short-term Borrowings                                                        407              231      76.2%
 Deferred income taxes                                                         90               60      50.0%
 Current Portion Long-term Debt                                               378              294      28.6%
 Current Portion Capital Leases                                                98              118     -16.9%
 Other                                                                        191              217     -12.0%
                                                                           $1,615           $1,392     16.0%

Other Liabilities
 Deferred Income Taxes                                                      1,893             1,888      0.3%
 Capital Leases                                                               119               126     -5.6%
 Regulatory Liabilities                                                       282               294     -4.1%
 Other                                                                        538               493      9.1%
                                                                            2,832             2,801      1.1%

Long-Term Debt                                                             $3,963           $4,197      -5.6%

Shareholder's Equity
 Common Stock, without par value, 400,000,000 shares
     authorized, 145,075,152 and 145,097,829 issued and
     outstanding, respectively                                              1,950            1,951      -0.1%
 Retained Earnings                                                          1,821            1,747       4.2%
 Total Shareholder's Equity                                                $3,771           $3,698      2.0%


Total Liabilities and Shareholder's Equity                                $12,181          $12,088       0.8%

The Condensed Consolidated Balance Sheet (Unaudited) should be read in conjunction with the Notes to
Consolidated Financial Statements appearing in the Annual Report to Shareholders, 10K, and 10Q.


                                          DTE Investor Relations (313) 235-8030                             7
DTE ENERGY COMPANY AND SUBSIDIARY COMPANIES
           CONDENSED CONSOLIDATED STATEMENT OF CASH FLOWS (PRELIMINARY/UNAUDITED)
                                                   (Dollars in Millions, Except Per Share Amounts)

                                                                                    3 Months Ended June 30             6 Months Ended June 30
                                                                                       1999          1998                    1999         1998
Operating Activities
 Net Income                                                                              $110            $101                  $225      $205
 Adjustments to reconcile net income to net cash from operating activities:
   Depreciation and Amortization                                                          182             162                   364       327
   Other                                                                                  (25)             (6)                   20        (3)
   Changes in current assets and liabilities:
    Restricted Cash                                                                         8               8                    (2)       (8)
    Accounts Receivable                                                                   (74)            (95)                  (52)      (48)
    Inventories                                                                           (10)            (42)                   17       (30)
    Payables                                                                               48              55                    (2)       60
    Other                                                                                  56              46                  (119)      (51)
   Net cash from operating activities                                                    $295            $229                  $451      $452

Investing Activities
 Plant and Equipment Expenditures                                                       ($194)          ($116)                ($356)     ($241)
 Investment in Coke Oven Battery Businesses                                                 -               -                     -       (200)
 Nuclear Decommissioning Trust Funds                                                      (12)            (12)                  (30)       (41)
 Other                                                                                    (28)            (17)                  (30)       (11)
   Net cash used for investing activities                                               ($234)          ($145)                ($416)     ($493)

Financing Activities
 Issuance of Long-term Debt                                                                   -          $200                       -    $200
 Increase (Decrease) in Short-term Borrowings                                             127            (115)                  176       262
 Redemption of Long-term Debt                                                            (120)            (18)                 (157)     (187)
 Redemption of Preferred Stock                                                                -          (100)                      -    (100)
 Dividends on Common Stock                                                                (74)            (75)                 (149)     (149)
 Other                                                                                        -             3                       -       2
    Net cash used for financing activities                                               ($67)          ($105)                ($130)      $28

Net Increase (Decrease) in Cash and Temporary Cash Investments                             (6)            (21)                  (95)      (13)
Cash and Cash Equivalents at Beginning of the Period                                       41              53                   130        45
Cash and Cash Equivalents at End of the Period                                            $35             $32                   $35       $32

Supplementary Cash Flow Information
 Interest paid (excluding interest capitalized)                                            81             $61                   165      $146
 Income Taxes paid                                                                          7              30                    36        66
 New Capital lease obligations                                                            -                31                     9        48

The Condensed Consolidated Statement of Cash Flows (Unaudited) should be read in conjunction with the Notes to Consolidated Financial
Statements appearing in the Annual Report to Shareholders, 10K, and 10Q.


                                                                                                                                             8
                                                            DTE Investor Relations (313) 235-8030
THE DETROIT EDISON COMPANY
                                STATEMENT OF INCOME (PRELIMINARY/UNAUDITED)
                                           (Dollars in Millions, Expect Per Share Amounts)

                                                    3 Months June 30                                                  After Tax
                                                        1999          1998             % Change      $ Change      EPS Impact *
Operating Revenues                                    $1,006         $992                  1.4%          $14             $0.06
Operating Expenses
  Fuel & Purchased power                                 277                 266             4.1%         11              ($0.05)
  Operation and maintenance                              261                 247             5.7%         14              ($0.06)
  Depreciation and amortization                          173                 161             7.5%         12              ($0.05)
  Taxes other than income                                 70                  70             0.0%          -               $0.00
  Total Operating Expenses                              $781                $744             5.0%        $37              ($0.17)

Operating Income                                        $225                $248             -9.3%      ($23)             ($0.10)

Interest Expense and Other
 Interest Expense                                          69                 68              1.5%        $1              ($0.00)
 Other Expense- net                                        (1)                 5           -120.0%        (6)              $0.03
   Net Interest Expense and Other                         $68                $73             -6.8%       ($5)              $0.02

Income Before Income Taxes                              $157                $175            -10.3%      ($18)             ($0.08)
 Income Taxes                                             50                  80            -37.5%       (30)              $0.16
Net Income                                              $107                 $95            12.6%        $12               $0.08

Preferred Stock Dividends                                 -                    $2          -100.0%       ($2)               0.01

Net Income Available for Common Stock                   $107                 $93             15.1%       $14               $0.10

* Earnings impact figures are estimates      The Condensed Consolidated Statement of Income (Unaudited) should be read in
  Differences may exist due to rounding      conjunction with the Notes to Consolidated Financial Statements appearing in the
  Please see additional detail on Page 4     Annual Report to Shareholders, 10K, and 10Q.


                                                 DTE Investor Relations (313) 235 - 8030                                        9
THE DETROIT EDISON COMPANY
                                 STATEMENT OF INCOME (PRELIMINARY/UNAUDITED)
                                          (Dollars in Millions, Expect Per Share Amounts)


                                                  6 Months June 30                                                  After Tax
                                                    1999           1998                 % Change      $ Change   EPS Impact *
Operating Revenues                                $1,917         $1,893                     1.3%          $24          $0.11
Operating Expenses
 Fuel and Purchased power                            483                   474                1.9%          9           (0.04)
 Operation and Maintenance                           498                   470                6.0%         28           (0.13)
 Depreciation and amortization                       346                   324                6.8%         22           (0.10)
 Taxes other than income                             141                   140                0.7%          1           (0.00)
  Total Operating Expenses                        $1,468                $1,408                4.3%        $60           (0.27)

Operating Income                                    $449                  $485                -7.4%      ($36)         ($0.16)

Interest Expense and Other
 Interest Expense                                     137                  136                 0.7%         1           (0.00)
 Other - net                                            2                   10               -80.0%        (8)          (0.04)

  Net Interest Expense and Other                    $139                  $146                -4.8%       ($7)         $0.05

Income Before Income Taxes                          $310                  $339                -8.6%      ($29)         ($0.11)

Income Taxes                                         $99                  $146               -32.2%       (47)          0.24
Net Income                                          $211                  $193                 9.3%       $18          $0.12

Preferred Stock Dividends                             -                      $5             -100.0%       ($5)             0.02

Net Income Available for Common Stock               $211                  $188               12.2%        $23          $0.16

* Earnings impact figures are estimates   The Condensed Consolidated Statement of Income (Unaudited) should be read in
  Differences may exist due to rounding   conjunction with the Notes to Consolidated Financial Statements appearing in the
                                          Annual Report to Shareholders, 10K, and 10Q.


                                             DTE Investor Relations (313) 235-8030                                    10
DTE ENERGY COMPANY AND SUBSIDIARY COMPANIES
                                   SELECTED FINANCIAL RATIOS (PRELIMINARY/UNAUDITED)

                                                                                                                  Twelve Months Ended
                                                                                                                          June
                                                                                                                       1999               1998
Coverage Ratios (SEC Basis):

                                                                                                                              2.44         3.08
Ratio of Earnings to Fixed Charges (SEC Basis)
Ratio of Earnings to Fixed Charges
                                                                                                                         2.55              3.22
  (Excluding Non-Recourse Debt Interest Expense)
                                                                                                                       12.6%             13.2%
Return on Average Common Equity
                                                                                                                       12.4%             12.9%
Return on Average Common Equity (Detroit Edison Only)
                                                                                                                       64.4%             64.2%
Common Stock Dividend Payout
                                                                                                                       91.7%            172.3%
Funds Generated Internally for Construction
                                                                                                                       12.8%             35.7%
Effective Federal Income Tax Rate
                                                                                                                      $26.00            $24.89
Book Value Per Common Share
Capital Structure
                                                                                                                         1999             1998
Traditional Method
                                                                                                                        48.8%            48.2%
Common Shareholders' Equity
                                                                                                                         0.0%             0.6%
Preferred Stock
                                                                                                                         5.0%             4.5%
Deeply Subordinated Debt (QUIDS)
                                                                                                                        46.2%            46.7%
Long-Term Debt
                                                                                                                        100%             100%
 Total
Rating Agency Method
                                                                                                                        43.2%            43.9%
Common Shareholders' Equity
                                                                                 (1)
                                                                                                                         4.4%             4.7%
Preferred Stock & Deeply Subordinated Debt (QUIDS)
Long-Term Debt (2)                                                                                                      52.4%            51.4%
                                                                                                                        100%             100%
 Total
Capital Structure
(Excluding Non-Recourse Debt)
                                                                                                                         1999             1998
Traditional Method
                                                                                                                        50.7%            49.7%
Common Shareholders' Equity
                                                                                                                         0.0%             0.7%
Preferred Stock
                                                                                                                         5.2%             4.6%
Deeply Subordinated Debt (QUIDS)
                                                                                                                        44.1%            45.0%
Long-Term Debt
                                                                                                                        100%             100%
 Total
Rating Agency Method
                                                                                                                        45.1%            45.4%
Common Shareholders' Equity
Preferred Stock & Deeply Subordinated Debt (QUIDS) (1)                                                                   4.6%             4.8%
Long-Term Debt (2)                                                                                                      50.3%            49.8%
                                                                                                                        100%             100%
 Total


(1)
      Includes amounts due within one year.
(2)
      Includes amounts due within one year, obligations under capital leases (current and non-current) and short-term debt.


                                                        DTE Investor Relations (313) 235-8030                                                     11
1999 SALES ANALYSIS
                                             (GWH)


                                                                                                    Sales As
                             2Q            2Q       % Chg               YTD         YTD    % Chg       % of
Category                   1999           1998       1999               1999        1998   YTD 99      Total
Residential               3,237          3,154       2.6%              6,723       6,468     3.9%     25.0%
Commercial
 Secondary                2,683          2,599         3.2%            5,187       5,005     3.6%     19.3%
 Primary                  2,390          2,198         8.7%            4,397       4,135     6.3%     16.3%
   Total Commercial       5,073          4,797         5.8%            9,583       9,140     4.8%     35.6%
Industrial
 Automotive               1,901          1,872         1.5%            3,700       3,647     1.4%    13.7%
 Steel                      700            743        -5.8%            1,364       1,449    -5.9%     5.1%
 Other Manufacturing      1,293          1,193         8.3%            2,381       2,249     5.9%     8.8%
   Total Industrial       3,893          3,809         2.2%            7,445       7,345     1.4%    27.7%
Other                       592            553         7.1%            1,258       1,152     9.2%     4.7%
Total System Sales       12,795         12,313         3.9%           25,009      24,106     3.7%    92.9%
Interconnection             786         1,323       -40.6%             1,912       2,756   -30.6%     7.1%
Total Sales              13,582         13,636       -0.4%            26,921      26,862     0.2%   100.0%


            Second Quarter Heating and Cooling Degree Day Data


                                          1999                           1998 % Change
Heating Degree Days                       572                            580      -1.4%
Cooling Degree Days                       256                            304     -15.8%


                                  Finance and Investor Relations (313) 235-8030                                12

More Related Content

Viewers also liked

starbucks ar01_narrative
starbucks  ar01_narrativestarbucks  ar01_narrative
starbucks ar01_narrativefinance41
 
dte_1Q2007ER
dte_1Q2007ERdte_1Q2007ER
dte_1Q2007ERfinance41
 
dollar general CorporateCharter
dollar general CorporateCharterdollar general CorporateCharter
dollar general CorporateCharterfinance41
 
starbucks ar02_narrative
starbucks  ar02_narrativestarbucks  ar02_narrative
starbucks ar02_narrativefinance41
 
dte_er040205
dte_er040205dte_er040205
dte_er040205finance41
 
pepco WSUG107
pepco WSUG107pepco WSUG107
pepco WSUG107finance41
 
starbucks Annual_Report_2003_part2
starbucks  Annual_Report_2003_part2starbucks  Annual_Report_2003_part2
starbucks Annual_Report_2003_part2finance41
 
DTE_Q12008_Supp_v2
DTE_Q12008_Supp_v2DTE_Q12008_Supp_v2
DTE_Q12008_Supp_v2finance41
 
Q32003_release
Q32003_releaseQ32003_release
Q32003_releasefinance41
 
pepco EdwardJones0306
pepco EdwardJones0306pepco EdwardJones0306
pepco EdwardJones0306finance41
 

Viewers also liked (18)

starbucks ar01_narrative
starbucks  ar01_narrativestarbucks  ar01_narrative
starbucks ar01_narrative
 
dte_4q1999
dte_4q1999dte_4q1999
dte_4q1999
 
dte_1Q2007ER
dte_1Q2007ERdte_1Q2007ER
dte_1Q2007ER
 
dte_4q06_ER
dte_4q06_ERdte_4q06_ER
dte_4q06_ER
 
dollar general CorporateCharter
dollar general CorporateCharterdollar general CorporateCharter
dollar general CorporateCharter
 
starbucks ar02_narrative
starbucks  ar02_narrativestarbucks  ar02_narrative
starbucks ar02_narrative
 
dte_020730a
dte_020730adte_020730a
dte_020730a
 
dte_er040205
dte_er040205dte_er040205
dte_er040205
 
dte_3Q06ER
dte_3Q06ERdte_3Q06ER
dte_3Q06ER
 
dte_4q2000
dte_4q2000dte_4q2000
dte_4q2000
 
pepco WSUG107
pepco WSUG107pepco WSUG107
pepco WSUG107
 
dte_030211
dte_030211dte_030211
dte_030211
 
starbucks Annual_Report_2003_part2
starbucks  Annual_Report_2003_part2starbucks  Annual_Report_2003_part2
starbucks Annual_Report_2003_part2
 
phi AR07
phi AR07phi AR07
phi AR07
 
dte_030814
dte_030814dte_030814
dte_030814
 
DTE_Q12008_Supp_v2
DTE_Q12008_Supp_v2DTE_Q12008_Supp_v2
DTE_Q12008_Supp_v2
 
Q32003_release
Q32003_releaseQ32003_release
Q32003_release
 
pepco EdwardJones0306
pepco EdwardJones0306pepco EdwardJones0306
pepco EdwardJones0306
 

Similar to dte_2q1999

monsanto supplemental_toolkit
monsanto supplemental_toolkitmonsanto supplemental_toolkit
monsanto supplemental_toolkitfinance28
 
monsanto supplemental_toolkit
monsanto  supplemental_toolkitmonsanto  supplemental_toolkit
monsanto supplemental_toolkitfinance28
 
.monsanto supplemental_toolkit
.monsanto  supplemental_toolkit.monsanto  supplemental_toolkit
.monsanto supplemental_toolkitfinance28
 
monsanto supplemental_toolkit
monsanto supplemental_toolkitmonsanto supplemental_toolkit
monsanto supplemental_toolkitfinance28
 
.monsanto supplemental_toolkit
.monsanto  supplemental_toolkit.monsanto  supplemental_toolkit
.monsanto supplemental_toolkitfinance28
 
CLX0201_1_Balance_Sheets-159159
CLX0201_1_Balance_Sheets-159159CLX0201_1_Balance_Sheets-159159
CLX0201_1_Balance_Sheets-159159finance48
 
CLX0502-1980616518a
CLX0502-1980616518aCLX0502-1980616518a
CLX0502-1980616518afinance48
 
CLOrox 1%20Consolidated%20Earnings,%20Segment%20Information%20and%20Consoli...
CLOrox   1%20Consolidated%20Earnings,%20Segment%20Information%20and%20Consoli...CLOrox   1%20Consolidated%20Earnings,%20Segment%20Information%20and%20Consoli...
CLOrox 1%20Consolidated%20Earnings,%20Segment%20Information%20and%20Consoli...finance48
 
first energy 3Q 2007
first energy 3Q 2007first energy 3Q 2007
first energy 3Q 2007finance21
 
first energy 3Q 2007
first energy 3Q 2007first energy 3Q 2007
first energy 3Q 2007finance21
 

Similar to dte_2q1999 (20)

dte_3q1999
dte_3q1999dte_3q1999
dte_3q1999
 
dte_1q2000
dte_1q2000dte_1q2000
dte_1q2000
 
dte_2q2000
dte_2q2000dte_2q2000
dte_2q2000
 
dte_1q1999
dte_1q1999dte_1q1999
dte_1q1999
 
dte_3q2000
dte_3q2000dte_3q2000
dte_3q2000
 
dtefin1
dtefin1dtefin1
dtefin1
 
monsanto supplemental_toolkit
monsanto supplemental_toolkitmonsanto supplemental_toolkit
monsanto supplemental_toolkit
 
monsanto supplemental_toolkit
monsanto  supplemental_toolkitmonsanto  supplemental_toolkit
monsanto supplemental_toolkit
 
.monsanto supplemental_toolkit
.monsanto  supplemental_toolkit.monsanto  supplemental_toolkit
.monsanto supplemental_toolkit
 
monsanto supplemental_toolkit
monsanto supplemental_toolkitmonsanto supplemental_toolkit
monsanto supplemental_toolkit
 
.monsanto supplemental_toolkit
.monsanto  supplemental_toolkit.monsanto  supplemental_toolkit
.monsanto supplemental_toolkit
 
dtefin1
dtefin1dtefin1
dtefin1
 
CLX0201_1_Balance_Sheets-159159
CLX0201_1_Balance_Sheets-159159CLX0201_1_Balance_Sheets-159159
CLX0201_1_Balance_Sheets-159159
 
CLX0502-1980616518a
CLX0502-1980616518aCLX0502-1980616518a
CLX0502-1980616518a
 
dte_020730a
dte_020730adte_020730a
dte_020730a
 
AES 3Q 2006
AES 3Q 2006AES 3Q 2006
AES 3Q 2006
 
CLOrox 1%20Consolidated%20Earnings,%20Segment%20Information%20and%20Consoli...
CLOrox   1%20Consolidated%20Earnings,%20Segment%20Information%20and%20Consoli...CLOrox   1%20Consolidated%20Earnings,%20Segment%20Information%20and%20Consoli...
CLOrox 1%20Consolidated%20Earnings,%20Segment%20Information%20and%20Consoli...
 
first energy 3Q 2007
first energy 3Q 2007first energy 3Q 2007
first energy 3Q 2007
 
first energy 3Q 2007
first energy 3Q 2007first energy 3Q 2007
first energy 3Q 2007
 
Second Quarter 2007 Earnings Presentation
Second Quarter 2007 Earnings PresentationSecond Quarter 2007 Earnings Presentation
Second Quarter 2007 Earnings Presentation
 

More from finance41

pepco POMSlides
pepco POMSlidespepco POMSlides
pepco POMSlidesfinance41
 
pepco Berenson0306
pepco Berenson0306pepco Berenson0306
pepco Berenson0306finance41
 
pepco 2006JulyInvestorMeetings
pepco 2006JulyInvestorMeetingspepco 2006JulyInvestorMeetings
pepco 2006JulyInvestorMeetingsfinance41
 
pepco Presentation081706
pepco Presentation081706pepco Presentation081706
pepco Presentation081706finance41
 
pepco FallEEIl
pepco FallEEIlpepco FallEEIl
pepco FallEEIlfinance41
 
pepco AugustInvestorMeetings2007Final
pepco AugustInvestorMeetings2007Finalpepco AugustInvestorMeetings2007Final
pepco AugustInvestorMeetings2007Finalfinance41
 
pepco MerillLynchPower&GasConferenceSept2007(final)
pepco MerillLynchPower&GasConferenceSept2007(final)pepco MerillLynchPower&GasConferenceSept2007(final)
pepco MerillLynchPower&GasConferenceSept2007(final)finance41
 
pepco POMFallEEI2007
pepco POMFallEEI2007pepco POMFallEEI2007
pepco POMFallEEI2007finance41
 
pepco WallStBerensonFINAL
pepco WallStBerensonFINALpepco WallStBerensonFINAL
pepco WallStBerensonFINALfinance41
 
pepco POMAGAPresentation(final)
pepco POMAGAPresentation(final)pepco POMAGAPresentation(final)
pepco POMAGAPresentation(final)finance41
 
PHI_ProxyAnnual_Report2002
PHI_ProxyAnnual_Report2002PHI_ProxyAnnual_Report2002
PHI_ProxyAnnual_Report2002finance41
 
PHI_ProxyAnnual_Report2002
PHI_ProxyAnnual_Report2002PHI_ProxyAnnual_Report2002
PHI_ProxyAnnual_Report2002finance41
 
PHI_ProxyAnnual_Report2004
PHI_ProxyAnnual_Report2004PHI_ProxyAnnual_Report2004
PHI_ProxyAnnual_Report2004finance41
 
PHI_ProxyAnnual_Report2003
PHI_ProxyAnnual_Report2003PHI_ProxyAnnual_Report2003
PHI_ProxyAnnual_Report2003finance41
 
PHI_ProxyAnnual_Report2003
PHI_ProxyAnnual_Report2003PHI_ProxyAnnual_Report2003
PHI_ProxyAnnual_Report2003finance41
 
PHI_ProxyAnnual_Report2004
PHI_ProxyAnnual_Report2004PHI_ProxyAnnual_Report2004
PHI_ProxyAnnual_Report2004finance41
 
phi proxystatement2005report
phi proxystatement2005reportphi proxystatement2005report
phi proxystatement2005reportfinance41
 
phi proxystatement2005report
phi proxystatement2005reportphi proxystatement2005report
phi proxystatement2005reportfinance41
 

More from finance41 (20)

pepco POMSlides
pepco POMSlidespepco POMSlides
pepco POMSlides
 
pepco Berenson0306
pepco Berenson0306pepco Berenson0306
pepco Berenson0306
 
pepco 2006JulyInvestorMeetings
pepco 2006JulyInvestorMeetingspepco 2006JulyInvestorMeetings
pepco 2006JulyInvestorMeetings
 
pepco Presentation081706
pepco Presentation081706pepco Presentation081706
pepco Presentation081706
 
pepco FallEEIl
pepco FallEEIlpepco FallEEIl
pepco FallEEIl
 
pepco AugustInvestorMeetings2007Final
pepco AugustInvestorMeetings2007Finalpepco AugustInvestorMeetings2007Final
pepco AugustInvestorMeetings2007Final
 
pepco MerillLynchPower&GasConferenceSept2007(final)
pepco MerillLynchPower&GasConferenceSept2007(final)pepco MerillLynchPower&GasConferenceSept2007(final)
pepco MerillLynchPower&GasConferenceSept2007(final)
 
pepco POMFallEEI2007
pepco POMFallEEI2007pepco POMFallEEI2007
pepco POMFallEEI2007
 
pepco WallStBerensonFINAL
pepco WallStBerensonFINALpepco WallStBerensonFINAL
pepco WallStBerensonFINAL
 
pepco POM2
pepco POM2pepco POM2
pepco POM2
 
pepco POMAGAPresentation(final)
pepco POMAGAPresentation(final)pepco POMAGAPresentation(final)
pepco POMAGAPresentation(final)
 
PHI_ProxyAnnual_Report2002
PHI_ProxyAnnual_Report2002PHI_ProxyAnnual_Report2002
PHI_ProxyAnnual_Report2002
 
PHI_ProxyAnnual_Report2002
PHI_ProxyAnnual_Report2002PHI_ProxyAnnual_Report2002
PHI_ProxyAnnual_Report2002
 
PHI_ProxyAnnual_Report2004
PHI_ProxyAnnual_Report2004PHI_ProxyAnnual_Report2004
PHI_ProxyAnnual_Report2004
 
PHI_ProxyAnnual_Report2003
PHI_ProxyAnnual_Report2003PHI_ProxyAnnual_Report2003
PHI_ProxyAnnual_Report2003
 
PHI_ProxyAnnual_Report2003
PHI_ProxyAnnual_Report2003PHI_ProxyAnnual_Report2003
PHI_ProxyAnnual_Report2003
 
PHI_ProxyAnnual_Report2004
PHI_ProxyAnnual_Report2004PHI_ProxyAnnual_Report2004
PHI_ProxyAnnual_Report2004
 
phi proxystatement2005report
phi proxystatement2005reportphi proxystatement2005report
phi proxystatement2005report
 
phi proxystatement2005report
phi proxystatement2005reportphi proxystatement2005report
phi proxystatement2005report
 
phi AR07
phi AR07phi AR07
phi AR07
 

Recently uploaded

Vp Girls near me Delhi Call Now or WhatsApp
Vp Girls near me Delhi Call Now or WhatsAppVp Girls near me Delhi Call Now or WhatsApp
Vp Girls near me Delhi Call Now or WhatsAppmiss dipika
 
Financial Leverage Definition, Advantages, and Disadvantages
Financial Leverage Definition, Advantages, and DisadvantagesFinancial Leverage Definition, Advantages, and Disadvantages
Financial Leverage Definition, Advantages, and Disadvantagesjayjaymabutot13
 
Q3 2024 Earnings Conference Call and Webcast Slides
Q3 2024 Earnings Conference Call and Webcast SlidesQ3 2024 Earnings Conference Call and Webcast Slides
Q3 2024 Earnings Conference Call and Webcast SlidesMarketing847413
 
BPPG response - Options for Defined Benefit schemes - 19Apr24.pdf
BPPG response - Options for Defined Benefit schemes - 19Apr24.pdfBPPG response - Options for Defined Benefit schemes - 19Apr24.pdf
BPPG response - Options for Defined Benefit schemes - 19Apr24.pdfHenry Tapper
 
SBP-Market-Operations and market managment
SBP-Market-Operations and market managmentSBP-Market-Operations and market managment
SBP-Market-Operations and market managmentfactical
 
VIP Call Girls LB Nagar ( Hyderabad ) Phone 8250192130 | ₹5k To 25k With Room...
VIP Call Girls LB Nagar ( Hyderabad ) Phone 8250192130 | ₹5k To 25k With Room...VIP Call Girls LB Nagar ( Hyderabad ) Phone 8250192130 | ₹5k To 25k With Room...
VIP Call Girls LB Nagar ( Hyderabad ) Phone 8250192130 | ₹5k To 25k With Room...Suhani Kapoor
 
Stock Market Brief Deck for 4/24/24 .pdf
Stock Market Brief Deck for 4/24/24 .pdfStock Market Brief Deck for 4/24/24 .pdf
Stock Market Brief Deck for 4/24/24 .pdfMichael Silva
 
Interimreport1 January–31 March2024 Elo Mutual Pension Insurance Company
Interimreport1 January–31 March2024 Elo Mutual Pension Insurance CompanyInterimreport1 January–31 March2024 Elo Mutual Pension Insurance Company
Interimreport1 January–31 March2024 Elo Mutual Pension Insurance CompanyTyöeläkeyhtiö Elo
 
Independent Lucknow Call Girls 8923113531WhatsApp Lucknow Call Girls make you...
Independent Lucknow Call Girls 8923113531WhatsApp Lucknow Call Girls make you...Independent Lucknow Call Girls 8923113531WhatsApp Lucknow Call Girls make you...
Independent Lucknow Call Girls 8923113531WhatsApp Lucknow Call Girls make you...makika9823
 
Attachment Of Assets......................
Attachment Of Assets......................Attachment Of Assets......................
Attachment Of Assets......................AmanBajaj36
 
VIP Kolkata Call Girl Serampore 👉 8250192130 Available With Room
VIP Kolkata Call Girl Serampore 👉 8250192130  Available With RoomVIP Kolkata Call Girl Serampore 👉 8250192130  Available With Room
VIP Kolkata Call Girl Serampore 👉 8250192130 Available With Roomdivyansh0kumar0
 
Stock Market Brief Deck for "this does not happen often".pdf
Stock Market Brief Deck for "this does not happen often".pdfStock Market Brief Deck for "this does not happen often".pdf
Stock Market Brief Deck for "this does not happen often".pdfMichael Silva
 
letter-from-the-chair-to-the-fca-relating-to-british-steel-pensions-scheme-15...
letter-from-the-chair-to-the-fca-relating-to-british-steel-pensions-scheme-15...letter-from-the-chair-to-the-fca-relating-to-british-steel-pensions-scheme-15...
letter-from-the-chair-to-the-fca-relating-to-british-steel-pensions-scheme-15...Henry Tapper
 
(办理原版一样)QUT毕业证昆士兰科技大学毕业证学位证留信学历认证成绩单补办
(办理原版一样)QUT毕业证昆士兰科技大学毕业证学位证留信学历认证成绩单补办(办理原版一样)QUT毕业证昆士兰科技大学毕业证学位证留信学历认证成绩单补办
(办理原版一样)QUT毕业证昆士兰科技大学毕业证学位证留信学历认证成绩单补办fqiuho152
 
OAT_RI_Ep19 WeighingTheRisks_Apr24_TheYellowMetal.pptx
OAT_RI_Ep19 WeighingTheRisks_Apr24_TheYellowMetal.pptxOAT_RI_Ep19 WeighingTheRisks_Apr24_TheYellowMetal.pptx
OAT_RI_Ep19 WeighingTheRisks_Apr24_TheYellowMetal.pptxhiddenlevers
 
Vip B Aizawl Call Girls #9907093804 Contact Number Escorts Service Aizawl
Vip B Aizawl Call Girls #9907093804 Contact Number Escorts Service AizawlVip B Aizawl Call Girls #9907093804 Contact Number Escorts Service Aizawl
Vip B Aizawl Call Girls #9907093804 Contact Number Escorts Service Aizawlmakika9823
 
(办理学位证)加拿大萨省大学毕业证成绩单原版一比一
(办理学位证)加拿大萨省大学毕业证成绩单原版一比一(办理学位证)加拿大萨省大学毕业证成绩单原版一比一
(办理学位证)加拿大萨省大学毕业证成绩单原版一比一S SDS
 
Instant Issue Debit Cards - School Designs
Instant Issue Debit Cards - School DesignsInstant Issue Debit Cards - School Designs
Instant Issue Debit Cards - School Designsegoetzinger
 
VIP Call Girls Service Dilsukhnagar Hyderabad Call +91-8250192130
VIP Call Girls Service Dilsukhnagar Hyderabad Call +91-8250192130VIP Call Girls Service Dilsukhnagar Hyderabad Call +91-8250192130
VIP Call Girls Service Dilsukhnagar Hyderabad Call +91-8250192130Suhani Kapoor
 

Recently uploaded (20)

Vp Girls near me Delhi Call Now or WhatsApp
Vp Girls near me Delhi Call Now or WhatsAppVp Girls near me Delhi Call Now or WhatsApp
Vp Girls near me Delhi Call Now or WhatsApp
 
Financial Leverage Definition, Advantages, and Disadvantages
Financial Leverage Definition, Advantages, and DisadvantagesFinancial Leverage Definition, Advantages, and Disadvantages
Financial Leverage Definition, Advantages, and Disadvantages
 
Q3 2024 Earnings Conference Call and Webcast Slides
Q3 2024 Earnings Conference Call and Webcast SlidesQ3 2024 Earnings Conference Call and Webcast Slides
Q3 2024 Earnings Conference Call and Webcast Slides
 
BPPG response - Options for Defined Benefit schemes - 19Apr24.pdf
BPPG response - Options for Defined Benefit schemes - 19Apr24.pdfBPPG response - Options for Defined Benefit schemes - 19Apr24.pdf
BPPG response - Options for Defined Benefit schemes - 19Apr24.pdf
 
SBP-Market-Operations and market managment
SBP-Market-Operations and market managmentSBP-Market-Operations and market managment
SBP-Market-Operations and market managment
 
VIP Call Girls LB Nagar ( Hyderabad ) Phone 8250192130 | ₹5k To 25k With Room...
VIP Call Girls LB Nagar ( Hyderabad ) Phone 8250192130 | ₹5k To 25k With Room...VIP Call Girls LB Nagar ( Hyderabad ) Phone 8250192130 | ₹5k To 25k With Room...
VIP Call Girls LB Nagar ( Hyderabad ) Phone 8250192130 | ₹5k To 25k With Room...
 
Stock Market Brief Deck for 4/24/24 .pdf
Stock Market Brief Deck for 4/24/24 .pdfStock Market Brief Deck for 4/24/24 .pdf
Stock Market Brief Deck for 4/24/24 .pdf
 
Interimreport1 January–31 March2024 Elo Mutual Pension Insurance Company
Interimreport1 January–31 March2024 Elo Mutual Pension Insurance CompanyInterimreport1 January–31 March2024 Elo Mutual Pension Insurance Company
Interimreport1 January–31 March2024 Elo Mutual Pension Insurance Company
 
Independent Lucknow Call Girls 8923113531WhatsApp Lucknow Call Girls make you...
Independent Lucknow Call Girls 8923113531WhatsApp Lucknow Call Girls make you...Independent Lucknow Call Girls 8923113531WhatsApp Lucknow Call Girls make you...
Independent Lucknow Call Girls 8923113531WhatsApp Lucknow Call Girls make you...
 
Attachment Of Assets......................
Attachment Of Assets......................Attachment Of Assets......................
Attachment Of Assets......................
 
VIP Kolkata Call Girl Serampore 👉 8250192130 Available With Room
VIP Kolkata Call Girl Serampore 👉 8250192130  Available With RoomVIP Kolkata Call Girl Serampore 👉 8250192130  Available With Room
VIP Kolkata Call Girl Serampore 👉 8250192130 Available With Room
 
Stock Market Brief Deck for "this does not happen often".pdf
Stock Market Brief Deck for "this does not happen often".pdfStock Market Brief Deck for "this does not happen often".pdf
Stock Market Brief Deck for "this does not happen often".pdf
 
Monthly Economic Monitoring of Ukraine No 231, April 2024
Monthly Economic Monitoring of Ukraine No 231, April 2024Monthly Economic Monitoring of Ukraine No 231, April 2024
Monthly Economic Monitoring of Ukraine No 231, April 2024
 
letter-from-the-chair-to-the-fca-relating-to-british-steel-pensions-scheme-15...
letter-from-the-chair-to-the-fca-relating-to-british-steel-pensions-scheme-15...letter-from-the-chair-to-the-fca-relating-to-british-steel-pensions-scheme-15...
letter-from-the-chair-to-the-fca-relating-to-british-steel-pensions-scheme-15...
 
(办理原版一样)QUT毕业证昆士兰科技大学毕业证学位证留信学历认证成绩单补办
(办理原版一样)QUT毕业证昆士兰科技大学毕业证学位证留信学历认证成绩单补办(办理原版一样)QUT毕业证昆士兰科技大学毕业证学位证留信学历认证成绩单补办
(办理原版一样)QUT毕业证昆士兰科技大学毕业证学位证留信学历认证成绩单补办
 
OAT_RI_Ep19 WeighingTheRisks_Apr24_TheYellowMetal.pptx
OAT_RI_Ep19 WeighingTheRisks_Apr24_TheYellowMetal.pptxOAT_RI_Ep19 WeighingTheRisks_Apr24_TheYellowMetal.pptx
OAT_RI_Ep19 WeighingTheRisks_Apr24_TheYellowMetal.pptx
 
Vip B Aizawl Call Girls #9907093804 Contact Number Escorts Service Aizawl
Vip B Aizawl Call Girls #9907093804 Contact Number Escorts Service AizawlVip B Aizawl Call Girls #9907093804 Contact Number Escorts Service Aizawl
Vip B Aizawl Call Girls #9907093804 Contact Number Escorts Service Aizawl
 
(办理学位证)加拿大萨省大学毕业证成绩单原版一比一
(办理学位证)加拿大萨省大学毕业证成绩单原版一比一(办理学位证)加拿大萨省大学毕业证成绩单原版一比一
(办理学位证)加拿大萨省大学毕业证成绩单原版一比一
 
Instant Issue Debit Cards - School Designs
Instant Issue Debit Cards - School DesignsInstant Issue Debit Cards - School Designs
Instant Issue Debit Cards - School Designs
 
VIP Call Girls Service Dilsukhnagar Hyderabad Call +91-8250192130
VIP Call Girls Service Dilsukhnagar Hyderabad Call +91-8250192130VIP Call Girls Service Dilsukhnagar Hyderabad Call +91-8250192130
VIP Call Girls Service Dilsukhnagar Hyderabad Call +91-8250192130
 

dte_2q1999

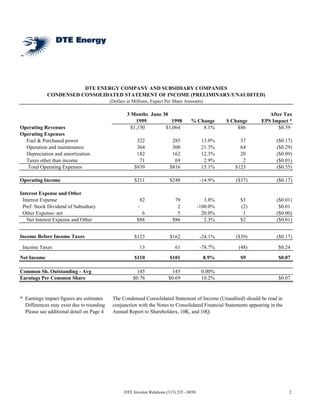
  • 1. DTE ENERGY COMPANY AND SUBSIDIARY COMPANIES CONDENSED CONSOLIDATED STATEMENT OF INCOME (PRELIMINARY/UNAUDITED) (Dollars in Millions, Expect Per Share Amounts) 3 Months June 30 After Tax 1999 1998 % Change $ Change EPS Impact * Operating Revenues $1,150 $1,064 8.1% $86 $0.39 Operating Expenses Fuel & Purchased power 322 285 13.0% 37 ($0.17) Operation and maintenance 364 300 21.3% 64 ($0.29) Depreciation and amortization 182 162 12.3% 20 ($0.09) Taxes other than income 71 69 2.9% 2 ($0.01) Total Operating Expenses $939 $816 15.1% $123 ($0.55) Operating Income $211 $248 -14.9% ($37) ($0.17) Interest Expense and Other Interest Expense 82 79 3.8% $3 ($0.01) Pref. Stock Dividend of Subsidiary - 2 -100.0% (2) $0.01 Other Expense- net 6 5 20.0% 1 ($0.00) Net Interest Expense and Other $88 $86 2.3% $2 ($0.01) Income Before Income Taxes $123 $162 -24.1% ($39) ($0.17) Income Taxes 13 61 -78.7% (48) $0.24 Net Income $110 $101 8.9% $9 $0.07 Common Sh. Outstanding - Avg 145 145 0.00% Earnings Per Common Share $0.76 $0.69 10.2% $0.07 * Earnings impact figures are estimates The Condensed Consolidated Statement of Income (Unaudited) should be read in Differences may exist due to rounding conjunction with the Notes to Consolidated Financial Statements appearing in the Please see additional detail on Page 4 Annual Report to Shareholders, 10K, and 10Q. DTE Investor Relations (313) 235 - 8030 2
  • 2. DTE ENERGY COMPANY AND SUBSIDIARY COMPANIES CONDENSED CONSOLIDATED STATEMENT OF INCOME (PRELIMINARY/UNAUDITED) (Dollars in Millions, Expect Per Share Amounts) 6 Months June 30 After Tax 1999 1998 % Change $ Change EPS Impact * Operating Revenues $2,174 $2,009 8.2% $165 $0.74 Operating Expenses Fuel and Purchased power 553 493 12.2% 60 ($0.27) Operation and Maintenance 689 568 21.3% 121 ($0.54) Depreciation and amortization 364 327 11.3% 37 ($0.17) Taxes other than income 142 140 1.4% 2 ($0.01) Total Operating Expenses $1,748 $1,528 14.4% $220 ($0.99) Operating Income $426 $481 -11.4% ($55) ($0.25) Interest Expense and Other Interest Expense 165 153 7.8% 12 ($0.05) Pref. Stock Dividend of Subsidiary - 5 -100.0% (5) $0.02 Other - net 9 5 80.0% 4 $0.02 Net Interest Expense and Other $174 $163 6.7% $11 ($0.08) Income Before Income Taxes $252 $318 -20.8% ($66) ($0.32) Income Taxes $27 $113 -76.1% (86) $0.46 Net Income $225 $205 9.8% $20 $0.14 Common Sh. Outstanding - Avg 145 145 -0.06% Earnings Per Common Share $1.55 $1.41 9.9% $0.14 * Earnings impact figures are estimates The Condensed Consolidated Statement of Income (Unaudited) should be read in Differences may exist due to rounding conjunction with the Notes to Consolidated Financial Statements appearing in the Annual Report to Shareholders, 10K, and 10Q. DTE Investor Relations (313) 235-8030 3
  • 3. DTE ENERGY COMPANY AND SUBSIDIARY COMPANIES Earnings Analysis - Detail 2nd Quarter Change from 06/30/98 After-Tax Per Share Impact Beginning Earnings Per Share $0.69 Regulated Operating Revenues Net System Sales $0.08 Fuel and Purchased Power (0.04) Other (0.02) Total Regulated Net Revenues $0.02 Regulated Oper. & Maintenance Expense Year 2000 Costs (0.06) Other (0.01) Regulated Oper. & Maintenance Expense ($0.07) Depreciation & Amortization (0.05) Interest Expense $0.02 Income Taxes Primarily due to lower pretax income and full normalization of Fermi regulatory assets in 1999 $0.17 Preferred Dividends $0.01 Regulated Net Income (Detroit Edison) $0.09 Non-Regulated Net Income: Increased income due to full $0.03 year operations of coke Write-down for discontinuation of DTE CoEnergy ($0.02) Plug Power Expenses ($0.01) Subtotal: Non-Regulated Subsidiaries $0.00 DTE Energy Holding and DTE Capital Inc. ($0.03) Earnings Per Share Change $0.07 DTE Energy Ending Earnings Per Share $0.76 Differences may exist due to rounding. DTE Investor Relations (313) 235-8030 4
  • 4. DTE ENERGY COMPANY AND SUBSIDIARY COMPANIES TRAILING 12-MONTH ANALYSIS - REPORTED EPS As of June 30, 1999 Detroit Edison 3Q 4Q 1Q 2Q Total 1998 $0.86 $0.87 $0.66 $0.64 $3.03 1999 $0.85 $0.68 $0.71 $0.74 $2.98 Non-Regulated Subsidiaries (Additional Detail Provided Below) 3Q 4Q 1Q 2Q Total 1998 $0.05 $0.03 $0.06 $0.07 $0.21 1999 $0.07 $0.09 $0.10 $0.07 $0.33 DTE Capital / DTE Holding Company 3Q 4Q 1Q 2Q Total 1998 $0.00 ($0.01) $0.00 ($0.02) ($0.03) 1999 ($0.01) ($0.04) ($0.02) ($0.05) ($0.12) DTE Energy Company 3Q 4Q 1Q 2Q Total 1998 $0.91 $0.89 $0.72 $0.69 $3.21 1999 $0.91 $0.73 $0.79 $0.76 $3.19 1999 Non-Regulated Earnings Per Share by Activity * 1Q 2Q 3Q 4Q Total Coal Related $0.11 $0.11 $0.22 Renewables $0.01 $0.00 $0.01 Market Development ($0.01) ($0.03) ($0.04) Plug Power, LLC ($0.01) ($0.02) ($0.02) Other $0.00 ($0.00) ($0.00) Total Non-Regulated Subsidiaries $0.10 $0.07 $0.00 $0.00 $0.17 DTE Capital / DTE Holding Co. ($0.02) ($0.05) ($0.07) Total 1999 Non-Regulated EPS $0.08 $0.02 $0.00 $0.00 $0.10 * Differences may exist due to rounding DTE Investor Relations (313) 235-8030 5
  • 5. DTE ENERGY COMPANY AND SUBSIDIARY COMPANIES CONDENSED CONSOLIDATED BALANCE SHEET (PRELIMINARY/UNAUDITED) (Dollars in Millions, Expect Per Share Amounts) Percent ASSETS June 30, 1999 Dec. 31, 1998 Change Current Assets Cash and Cash Equivalents $35 $130 -73.1% Restricted Cash 123 121 1.7% Acounts Receivable Customer (less allowance for doubtful accounts of $21 and $20, respectively) 346 316 9.5% Accrued Unbilled Revenues 203 153 32.7% Other 107 135 -20.7% Inventories (at average cost) Fuel 165 171 -3.5% Materials and Supplies 156 167 -6.6% Other 117 39 200.0% Total Current Assets $1,252 $1,232 1.6% Investments Nuclear Decommissioning Trust Funds 339 309 9.7% Other 242 261 -7.3% $581 $570 1.9% Property Property, Plant and Equipment 11,364 11,121 2.2% Property under Capital Leases 234 242 -3.3% Nuclear Fuel under Capital Lease 662 659 0.5% Construction Work in Progress 200 156 28.2% $12,460 $12,178 2.3% Less Accumulated Depreciation & Amortization 5,411 5,235 3.4% 7,049 6,943 1.5% Regulatory Assets 3,026 3,091 -2.1% Other Assets 273 252 8.3% Total Assets $12,181 $12,088 0.8% The Condensed Consolidated Balance Sheet (Unaudited) should be read in conjunction with the Notes to Consolidated Financial Statements appearing in the Annual Report to Shareholders, 10K, and 10Q. DTE Investor Relations (313) 235-8030 6
  • 6. DTE ENERGY COMPANY AND SUBSIDIARY COMPANIES CONDENSED CONSOLIDATED BALANCE SHEET (PRELIMINARY/UNAUDITED) (Dollars in Millions, Except Per Share Amounts) Percent LIABILITIES June 30, 1999 Dec. 31, 1998 Change Current Liabilities Accounts Payable $233 $239 -2.5% Accrued Interest 56 57 -1.8% Dividends Payable 75 75 0.0% Accrued Payroll 87 101 -13.9% Short-term Borrowings 407 231 76.2% Deferred income taxes 90 60 50.0% Current Portion Long-term Debt 378 294 28.6% Current Portion Capital Leases 98 118 -16.9% Other 191 217 -12.0% $1,615 $1,392 16.0% Other Liabilities Deferred Income Taxes 1,893 1,888 0.3% Capital Leases 119 126 -5.6% Regulatory Liabilities 282 294 -4.1% Other 538 493 9.1% 2,832 2,801 1.1% Long-Term Debt $3,963 $4,197 -5.6% Shareholder's Equity Common Stock, without par value, 400,000,000 shares authorized, 145,075,152 and 145,097,829 issued and outstanding, respectively 1,950 1,951 -0.1% Retained Earnings 1,821 1,747 4.2% Total Shareholder's Equity $3,771 $3,698 2.0% Total Liabilities and Shareholder's Equity $12,181 $12,088 0.8% The Condensed Consolidated Balance Sheet (Unaudited) should be read in conjunction with the Notes to Consolidated Financial Statements appearing in the Annual Report to Shareholders, 10K, and 10Q. DTE Investor Relations (313) 235-8030 7
  • 7. DTE ENERGY COMPANY AND SUBSIDIARY COMPANIES CONDENSED CONSOLIDATED STATEMENT OF CASH FLOWS (PRELIMINARY/UNAUDITED) (Dollars in Millions, Except Per Share Amounts) 3 Months Ended June 30 6 Months Ended June 30 1999 1998 1999 1998 Operating Activities Net Income $110 $101 $225 $205 Adjustments to reconcile net income to net cash from operating activities: Depreciation and Amortization 182 162 364 327 Other (25) (6) 20 (3) Changes in current assets and liabilities: Restricted Cash 8 8 (2) (8) Accounts Receivable (74) (95) (52) (48) Inventories (10) (42) 17 (30) Payables 48 55 (2) 60 Other 56 46 (119) (51) Net cash from operating activities $295 $229 $451 $452 Investing Activities Plant and Equipment Expenditures ($194) ($116) ($356) ($241) Investment in Coke Oven Battery Businesses - - - (200) Nuclear Decommissioning Trust Funds (12) (12) (30) (41) Other (28) (17) (30) (11) Net cash used for investing activities ($234) ($145) ($416) ($493) Financing Activities Issuance of Long-term Debt - $200 - $200 Increase (Decrease) in Short-term Borrowings 127 (115) 176 262 Redemption of Long-term Debt (120) (18) (157) (187) Redemption of Preferred Stock - (100) - (100) Dividends on Common Stock (74) (75) (149) (149) Other - 3 - 2 Net cash used for financing activities ($67) ($105) ($130) $28 Net Increase (Decrease) in Cash and Temporary Cash Investments (6) (21) (95) (13) Cash and Cash Equivalents at Beginning of the Period 41 53 130 45 Cash and Cash Equivalents at End of the Period $35 $32 $35 $32 Supplementary Cash Flow Information Interest paid (excluding interest capitalized) 81 $61 165 $146 Income Taxes paid 7 30 36 66 New Capital lease obligations - 31 9 48 The Condensed Consolidated Statement of Cash Flows (Unaudited) should be read in conjunction with the Notes to Consolidated Financial Statements appearing in the Annual Report to Shareholders, 10K, and 10Q. 8 DTE Investor Relations (313) 235-8030
  • 8. THE DETROIT EDISON COMPANY STATEMENT OF INCOME (PRELIMINARY/UNAUDITED) (Dollars in Millions, Expect Per Share Amounts) 3 Months June 30 After Tax 1999 1998 % Change $ Change EPS Impact * Operating Revenues $1,006 $992 1.4% $14 $0.06 Operating Expenses Fuel & Purchased power 277 266 4.1% 11 ($0.05) Operation and maintenance 261 247 5.7% 14 ($0.06) Depreciation and amortization 173 161 7.5% 12 ($0.05) Taxes other than income 70 70 0.0% - $0.00 Total Operating Expenses $781 $744 5.0% $37 ($0.17) Operating Income $225 $248 -9.3% ($23) ($0.10) Interest Expense and Other Interest Expense 69 68 1.5% $1 ($0.00) Other Expense- net (1) 5 -120.0% (6) $0.03 Net Interest Expense and Other $68 $73 -6.8% ($5) $0.02 Income Before Income Taxes $157 $175 -10.3% ($18) ($0.08) Income Taxes 50 80 -37.5% (30) $0.16 Net Income $107 $95 12.6% $12 $0.08 Preferred Stock Dividends - $2 -100.0% ($2) 0.01 Net Income Available for Common Stock $107 $93 15.1% $14 $0.10 * Earnings impact figures are estimates The Condensed Consolidated Statement of Income (Unaudited) should be read in Differences may exist due to rounding conjunction with the Notes to Consolidated Financial Statements appearing in the Please see additional detail on Page 4 Annual Report to Shareholders, 10K, and 10Q. DTE Investor Relations (313) 235 - 8030 9
  • 9. THE DETROIT EDISON COMPANY STATEMENT OF INCOME (PRELIMINARY/UNAUDITED) (Dollars in Millions, Expect Per Share Amounts) 6 Months June 30 After Tax 1999 1998 % Change $ Change EPS Impact * Operating Revenues $1,917 $1,893 1.3% $24 $0.11 Operating Expenses Fuel and Purchased power 483 474 1.9% 9 (0.04) Operation and Maintenance 498 470 6.0% 28 (0.13) Depreciation and amortization 346 324 6.8% 22 (0.10) Taxes other than income 141 140 0.7% 1 (0.00) Total Operating Expenses $1,468 $1,408 4.3% $60 (0.27) Operating Income $449 $485 -7.4% ($36) ($0.16) Interest Expense and Other Interest Expense 137 136 0.7% 1 (0.00) Other - net 2 10 -80.0% (8) (0.04) Net Interest Expense and Other $139 $146 -4.8% ($7) $0.05 Income Before Income Taxes $310 $339 -8.6% ($29) ($0.11) Income Taxes $99 $146 -32.2% (47) 0.24 Net Income $211 $193 9.3% $18 $0.12 Preferred Stock Dividends - $5 -100.0% ($5) 0.02 Net Income Available for Common Stock $211 $188 12.2% $23 $0.16 * Earnings impact figures are estimates The Condensed Consolidated Statement of Income (Unaudited) should be read in Differences may exist due to rounding conjunction with the Notes to Consolidated Financial Statements appearing in the Annual Report to Shareholders, 10K, and 10Q. DTE Investor Relations (313) 235-8030 10
  • 10. DTE ENERGY COMPANY AND SUBSIDIARY COMPANIES SELECTED FINANCIAL RATIOS (PRELIMINARY/UNAUDITED) Twelve Months Ended June 1999 1998 Coverage Ratios (SEC Basis): 2.44 3.08 Ratio of Earnings to Fixed Charges (SEC Basis) Ratio of Earnings to Fixed Charges 2.55 3.22 (Excluding Non-Recourse Debt Interest Expense) 12.6% 13.2% Return on Average Common Equity 12.4% 12.9% Return on Average Common Equity (Detroit Edison Only) 64.4% 64.2% Common Stock Dividend Payout 91.7% 172.3% Funds Generated Internally for Construction 12.8% 35.7% Effective Federal Income Tax Rate $26.00 $24.89 Book Value Per Common Share Capital Structure 1999 1998 Traditional Method 48.8% 48.2% Common Shareholders' Equity 0.0% 0.6% Preferred Stock 5.0% 4.5% Deeply Subordinated Debt (QUIDS) 46.2% 46.7% Long-Term Debt 100% 100% Total Rating Agency Method 43.2% 43.9% Common Shareholders' Equity (1) 4.4% 4.7% Preferred Stock & Deeply Subordinated Debt (QUIDS) Long-Term Debt (2) 52.4% 51.4% 100% 100% Total Capital Structure (Excluding Non-Recourse Debt) 1999 1998 Traditional Method 50.7% 49.7% Common Shareholders' Equity 0.0% 0.7% Preferred Stock 5.2% 4.6% Deeply Subordinated Debt (QUIDS) 44.1% 45.0% Long-Term Debt 100% 100% Total Rating Agency Method 45.1% 45.4% Common Shareholders' Equity Preferred Stock & Deeply Subordinated Debt (QUIDS) (1) 4.6% 4.8% Long-Term Debt (2) 50.3% 49.8% 100% 100% Total (1) Includes amounts due within one year. (2) Includes amounts due within one year, obligations under capital leases (current and non-current) and short-term debt. DTE Investor Relations (313) 235-8030 11
  • 11. 1999 SALES ANALYSIS (GWH) Sales As 2Q 2Q % Chg YTD YTD % Chg % of Category 1999 1998 1999 1999 1998 YTD 99 Total Residential 3,237 3,154 2.6% 6,723 6,468 3.9% 25.0% Commercial Secondary 2,683 2,599 3.2% 5,187 5,005 3.6% 19.3% Primary 2,390 2,198 8.7% 4,397 4,135 6.3% 16.3% Total Commercial 5,073 4,797 5.8% 9,583 9,140 4.8% 35.6% Industrial Automotive 1,901 1,872 1.5% 3,700 3,647 1.4% 13.7% Steel 700 743 -5.8% 1,364 1,449 -5.9% 5.1% Other Manufacturing 1,293 1,193 8.3% 2,381 2,249 5.9% 8.8% Total Industrial 3,893 3,809 2.2% 7,445 7,345 1.4% 27.7% Other 592 553 7.1% 1,258 1,152 9.2% 4.7% Total System Sales 12,795 12,313 3.9% 25,009 24,106 3.7% 92.9% Interconnection 786 1,323 -40.6% 1,912 2,756 -30.6% 7.1% Total Sales 13,582 13,636 -0.4% 26,921 26,862 0.2% 100.0% Second Quarter Heating and Cooling Degree Day Data 1999 1998 % Change Heating Degree Days 572 580 -1.4% Cooling Degree Days 256 304 -15.8% Finance and Investor Relations (313) 235-8030 12