1. DTE ENERGY COMPANY AND SUBSIDIARY COMPANIES
CONDENSED CONSOLIDATED STATEMENT OF INCOME (PRELIMINARY/UNAUDITED)
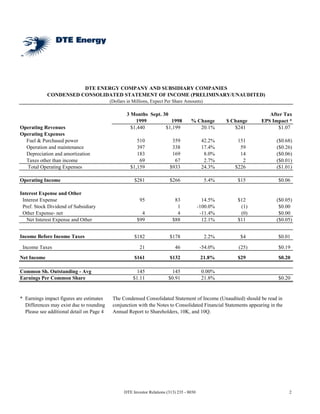
(Dollars in Millions, Expect Per Share Amounts)
3 Months Sept. 30 After Tax
1999 1998 % Change $ Change EPS Impact *
Operating Revenues $1,440 $1,199 20.1% $241 $1.07
Operating Expenses
Fuel & Purchased power 510 359 42.2% 151 ($0.68)
Operation and maintenance 397 338 17.4% 59 ($0.26)
Depreciation and amortization 183 169 8.0% 14 ($0.06)
Taxes other than income 69 67 2.7% 2 ($0.01)
Total Operating Expenses $1,159 $933 24.3% $226 ($1.01)
Operating Income $281 $266 5.4% $15 $0.06
Interest Expense and Other
Interest Expense 95 83 14.5% $12 ($0.05)
Pref. Stock Dividend of Subsidiary 1 -100.0% (1) $0.00
Other Expense- net 4 4 -11.4% (0) $0.00
Net Interest Expense and Other $99 $88 12.1% $11 ($0.05)
Income Before Income Taxes $182 $178 2.2% $4 $0.01
Income Taxes 21 46 -54.0% (25) $0.19
Net Income $161 $132 21.8% $29 $0.20
Common Sh. Outstanding - Avg 145 145 0.00%
Earnings Per Common Share $1.11 $0.91 21.8% $0.20
* Earnings impact figures are estimates The Condensed Consolidated Statement of Income (Unaudited) should be read in
Differences may exist due to rounding conjunction with the Notes to Consolidated Financial Statements appearing in the
Please see additional detail on Page 4 Annual Report to Shareholders, 10K, and 10Q.
DTE Investor Relations (313) 235 - 8030 2
2. DTE ENERGY COMPANY AND SUBSIDIARY COMPANIES
CONDENSED CONSOLIDATED STATEMENT OF INCOME (PRELIMINARY/UNAUDITED)
(Dollars in Millions, Expect Per Share Amounts)
9 Months September 30 After Tax
1999 1998 % Change $ Change EPS Impact *
Operating Revenues $3,614 $3,208 12.7% $406 $1.82
Operating Expenses
Fuel and Purchased power 1,063 852 24.8% 211 ($0.96)
Operation and Maintenance 1,086 906 19.9% 180 ($0.81)
Depreciation and amortization 547 496 10.3% 51 ($0.23)
Taxes other than income 211 207 1.9% 4 ($0.01)
Total Operating Expenses $2,907 $2,461 18.1% $446 ($2.00)
Operating Income $707 $747 -5.4% ($40) ($0.18)
Interest Expense and Other
Interest Expense 260 236 10.2% 24 ($0.11)
Pref. Stock Dividend of Subsidiary - 6 -100.0% (6) $0.03
Other - net 13 9 47.7% (4) ($0.02)
Net Interest Expense and Other $273 $251 8.9% $22 ($0.10)
Income Before Income Taxes $434 $496 -12.6% ($62) ($0.28)
Income Taxes $48 $159 -69.8% (111) $0.62
Net Income $386 $337 14.4% $49 $0.34
Common Sh. Outstanding - Avg 145 145 0.00%
Earnings Per Common Share $2.66 $2.32 14.4% $0.34
* Earnings impact figures are estimates The Condensed Consolidated Statement of Income (Unaudited) should be read in
Differences may exist due to rounding conjunction with the Notes to Consolidated Financial Statements appearing in the
Annual Report to Shareholders, 10K, and 10Q.
DTE Investor Relations (313) 235-8030 3
3. DTE ENERGY COMPANY AND SUBSIDIARY COMPANIES
Earnings Analysis - Detail 3rd Quarter
Change from 09/30/98 After-Tax
Per Share Impact
Beginning Earnings Per Share $0.91
Regulated Operating Revenues
Net System Sales $0.13
Incremental Rate Reduction in 1999 ($0.08)
1998 Fermi 2 Performance Reserve $0.15
Total Regulated Net Revenues $0.20
Regulated Oper. & Maintenance Expense
Storms and Heat-Related Trouble (0.08)
Other (0.04)
Taxes other than income (0.01)
Regulated Oper. & Maintenance Expense ($0.13)
Depreciation & Amortization ($0.06)
Interest Expense ($0.04)
Income Taxes $0.13
Due to full normalization of Fermi regulatory assets in
1999
Regulated Net Income (Detroit Edison) $0.10
Non-Regulated Net Income:
Increased income due to full year operations of Burns
Harbor coke battery, slightly offset by Plug Power
losses $0.08
Subtotal: Non-Regulated Subsidiaries $0.08
DTE Energy Holding and DTE Capital Inc. $0.02
Earnings Per Share Change $0.20
DTE Energy Ending Earnings Per Share $1.11
Differences may exist due to rounding.
DTE Investor Relations (313) 235-8030 4
4. DTE ENERGY COMPANY AND SUBSIDIARY COMPANIES
TRAILING 12-MONTH ANALYSIS - REPORTED EPS
As of September 30, 1999
Detroit Edison
4Q 1Q 2Q 3Q Total EPS Growth (%)
1998 $0.87 $0.66 $0.64 $0.85 $3.02
1999 $0.68 $0.71 $0.74 $0.95 $3.08 2.0%
Non-Regulated Subsidiaries (Additional Detail Provided Below)
4Q 1Q 2Q 3Q Total
1998 $0.03 $0.06 $0.07 $0.07 $0.23
1999 $0.09 $0.10 $0.07 $0.16 $0.41
DTE Capital / DTE Holding Company
4Q 1Q 2Q 3Q Total
1998 ($0.01) $0.00 ($0.02) ($0.01) ($0.04)
1999 ($0.04) ($0.02) ($0.05) $0.00 ($0.11)
DTE Energy Company
4Q 1Q 2Q 3Q Total EPS Growth (%)
1998 $0.89 $0.72 $0.69 $0.91 $3.21
1999 $0.73 $0.79 $0.76 $1.11 $3.39 5.4%
1999 Non-Regulated Earnings Per Share by Activity *
1Q 2Q 3Q 4Q Total
Coal Related $0.11 $0.11 $0.19 $0.41
Renewables $0.01 $0.00 $0.01 $0.02
Market Development ($0.01) ($0.03) ($0.02) ($0.06)
Plug Power, LLC ($0.01) ($0.02) ($0.02) ($0.04)
Other $0.00 $0.00 $0.00 $0.00
Total Non-Regulated Subsidiaries $0.10 $0.07 $0.16 $0.00 $0.33
DTE Capital / DTE Holding Co. ($0.02) ($0.05) $0.00 ($0.07)
Total 1999 Non-Regulated EPS $0.08 $0.02 $0.16 $0.00 $0.26
* Differences may exist due to rounding
DTE Investor Relations (313) 235-8030 5
5. DTE ENERGY COMPANY AND SUBSIDIARY COMPANIES
CONDENSED CONSOLIDATED BALANCE SHEET (PRELIMINARY/UNAUDITED)
(Dollars in Millions, Expect Per Share Amounts)
Percent
ASSETS Sept. 30, 1999 Dec. 31, 1998 Change
Current Assets
Cash and Cash Equivalents $54 $130 -58.6%
Restricted Cash 317 121 161.8%
Acounts Receivable
Customer (less allowance for doubtful
accounts of $21 and $20, respectively) 437 316 38.4%
Accrued Unbilled Revenues 154 153 0.7%
Other 97 135 -27.9%
Inventories (at average cost)
Fuel 148 171 -13.3%
Materials and Supplies 160 167 -4.4%
Other 88 39 125.8%
Total Current Assets $1,455 $1,232 18.1%
Investments
Nuclear Decommissioning Trust Funds 337 309 9.0%
Other 229 261 -12.3%
$566 $570 -0.8%
Property
Property, Plant and Equipment 11,580 11,121 4.1%
Property under Capital Leases 222 242 -8.2%
Nuclear Fuel under Capital Lease 662 659 0.5%
Construction Work in Progress 108 156 -30.6%
$12,572 $12,178 3.2%
Less Accumulated Depreciation & Amortization 5,508 5,235 5.2%
7,065 6,943 1.8%
Regulatory Assets 2,972 3,091 -3.9%
Other Assets 259 252 2.8%
Total Assets $12,316 $12,088 1.9%
The Condensed Consolidated Balance Sheet (Unaudited) should be read in conjunction with the
Notes to Consolidated Financial Statements appearing in the Annual Report to Shareholders, 10K, and 10Q.
DTE Investor Relations (313) 235-8030 6
6. DTE ENERGY COMPANY AND SUBSIDIARY COMPANIES
CONDENSED CONSOLIDATED BALANCE SHEET (PRELIMINARY/UNAUDITED)
(Dollars in Millions, Except Per Share Amounts)
Percent
LIABILITIES Sept. 30, 1999 Dec. 31, 1998 Change
Current Liabilities
Accounts Payable $215 $239 -10.2%
Accrued Interest 53 57 -6.5%
Dividends Payable 75 75 -0.4%
Accrued Payroll 86 101 -15.0%
Short-term Borrowings 296 231 28.2%
Income taxes 73 69 5.3%
Current Portion Long-term Debt 566 294 92.4%
Current Portion Capital Leases 87 118 -26.5%
Other 242 208 16.3%
$1,692 $1,392 21.5%
Other Liabilities
Deferred Income Taxes 1,902 1,888 0.7%
Capital Leases 118 126 -6.5%
Regulatory Liabilities 230 294 -21.7%
Other 532 493 7.9%
2,782 2,801 -0.7%
Long-Term Debt $3,985 $4,197 -5.1%
Shareholder's Equity
Common Stock, without par value, 400,000,000 shares
authorized, 145,045,159 and 145,071,317 issued and
outstanding, respectively 1,950 1,951 0.0%
Retained Earnings 1,908 1,747 9.2%
Total Shareholder's Equity $3,858 $3,698 4.3%
Total Liabilities and Shareholder's Equity $12,316 $12,088 1.9%
The Condensed Consolidated Balance Sheet (Unaudited) should be read in conjunction with the Notes to
Consolidated Financial Statements appearing in the Annual Report to Shareholders, 10K, and 10Q.
DTE Investor Relations (313) 235-8030 7
7. DTE ENERGY COMPANY AND SUBSIDIARY COMPANIES
CONDENSED CONSOLIDATED STATEMENT OF CASH FLOWS
(PRELIMINARY/UNAUDITED)
(Dollars in Millions, Except Per Share Amounts)
9 Months Ended Sept 30
1999 1998
Operating Activities
Net Income $386 $337
Adjustments to reconcile net income to net cash from operating activities:
Depreciation and Amortization 518 474
Other (41) (111)
Changes in current assets and liabilities:
Restricted Cash (196) (70)
Accounts Receivable (85) (89)
Inventories 30 (36)
Payables (44) 51
Other (16) 44
Net cash from operating activities $552 $600
Investing Activities
Plant and Equipment Expenditures (491) (632)
Removal Costs (39) (23)
Investment in coke oven battery business (195)
Net cash used for investing activities ($530) ($850)
Financing Activities
Issuance of Long-term Debt $264 $363
Increase (Decrease) in Short-term Borrowings 65 356
Redemption of Long-term Debt (204) (187)
Redemption of Preferred Stock - (100)
Dividends on Common Stock (224) (224)
Other - 3
Net cash used for financing activities ($99) $211
Net Increase (Decrease) in Cash and Temporary Cash Investments (77) (38)
Cash and Cash Equivalents at Beginning of the Period 131 99
Cash and Cash Equivalents at End of the Period $54 $60
The Condensed Consolidated Statement of Cash Flows (Unaudited) should be read in conjunction with the Notes to
Consolidated Financial Statements appearing in the Annual Report to Shareholders, 10K, and 10Q.
8
DTE Investor Relations (313) 235-8030
8. THE DETROIT EDISON COMPANY
STATEMENT OF INCOME (PRELIMINARY/UNAUDITED)
(Dollars in Millions, Expect Per Share Amounts)
3 Months Sept. 30 After Tax
1999 1998 % Change $ Change EPS Impact *
Operating Revenues $1,211 $1,105 9.6% $106 $0.48
Operating Expenses
Fuel & Purchased power 405 344 17.7% 61 ($0.27)
Operation and maintenance 275 249 10.4% 26 ($0.12)
Depreciation and amortization 176 162 8.6% 14 ($0.06)
Taxes other than income 69 66 4.5% 3 ($0.01)
Total Operating Expenses $925 $821 12.7% $104 ($0.47)
Operating Income $286 $284 0.7% $2 $0.01
Interest Expense and Other
Interest Expense 82 72 13.9% $10 ($0.04)
Other Expense- net 1 3 -66.7% (2) ($0.00)
Net Interest Expense and Other $83 $75 10.7% $8 ($0.04)
Income Before Income Taxes $203 $209 -2.9% ($6) ($0.03)
Income Taxes 65 84 -22.6% ($19) $0.13
Net Income $138 $125 10.4% $13 $0.10
Preferred Stock Dividends - $1 -100.0% ($1) 0.00
Net Income Available for Common Stock $138 $124 11.0% $14 $0.10
* Earnings impact figures are estimates The Condensed Consolidated Statement of Income (Unaudited) should be read in
Differences may exist due to rounding conjunction with the Notes to Consolidated Financial Statements appearing in the
Please see additional detail on Page 4 Annual Report to Shareholders, 10K, and 10Q.
DTE Investor Relations (313) 235 - 8030 9
9. THE DETROIT EDISON COMPANY
STATEMENT OF INCOME (PRELIMINARY/UNAUDITED)
(Dollars in Millions, Expect Per Share Amounts)
9 Months Sept. 30 After Tax
1999 1998 % Change $ Change EPS Impact *
Operating Revenues $3,128 $2,998 4.3% $130 $0.58
Operating Expenses
Fuel and Purchased power 888 818 8.6% 70 (0.31)
Operation and Maintenance 773 719 7.5% 54 (0.24)
Depreciation and amortization 522 486 7.4% 36 (0.16)
Taxes other than income 210 206 1.9% 4 (0.02)
Total Operating Expenses $2,393 $2,229 7.4% $164 (0.74)
Operating Income $735 $769 -4.4% ($34) ($0.15)
Interest Expense and Other
Interest Expense 219 208 5.3% 11 ($0.05)
Other - net 3 13 -76.9% (10) $0.04
Net Interest Expense and Other $222 $221 0.5% $1 ($0.01)
Income Before Income Taxes $513 $548 -6.4% ($35) ($0.16)
Income Taxes $164 $230 -28.6% ($66) $0.38
Net Income $349 $318 9.6% $31 $0.22
Preferred Stock Dividends $6 -100.0% ($6) $0.04
Net Income Available for Common Stock $349 $312 11.6% $36 $0.26
* Earnings impact figures are estimates The Condensed Consolidated Statement of Income (Unaudited) should be read in
Differences may exist due to rounding conjunction with the Notes to Consolidated Financial Statements appearing in the
Annual Report to Shareholders, 10K, and 10Q.
DTE Investor Relations (313) 235-8030 10
10. DTE ENERGY COMPANY AND SUBSIDIARY COMPANIES
SELECTED FINANCIAL RATIOS (PRELIMINARY/UNAUDITED)
Twelve Months Ended
September
1999 1998
Coverage Ratios (SEC Basis):
2.42 2.96
Ratio of Earnings to Fixed Charges (SEC Basis)
Ratio of Earnings to Fixed Charges
2.52 3.10
(Excluding Non-Recourse Debt Interest Expense)
13.2% 13.0%
Return on Average Common Equity
12.7% 12.8%
Return on Average Common Equity (Detroit Edison - Electirc & Steam)
60.7% 64.2%
Common Stock Dividend Payout
135.3% 113.1%
Funds Generated Internally for Construction
8.1% 32.6%
Effective Federal Income Tax Rate
$26.60 $25.25
Book Value Per Common Share
Capital Structure
1999 1998
Traditional Method
49.2% 47.6%
Common Shareholders' Equity
0.0% 0.6%
Preferred Stock
4.9% 4.3%
Deeply Subordinated Debt (QUIDS)
45.9% 47.5%
Long-Term Debt
100% 100%
Total
Rating Agency Method
43.3% 43.0%
Common Shareholders' Equity
(1)
4.3% 4.5%
Preferred Stock & Deeply Subordinated Debt (QUIDS)
Long-Term Debt (2) 52.4% 52.5%
100% 100%
Total
Capital Structure
(Excluding Non-Recourse Debt)
1999 1998
Traditional Method
51.0% 50.1%
Common Shareholders' Equity
0.0% 0.6%
Preferred Stock
5.1% 4.6%
Deeply Subordinated Debt (QUIDS)
43.9% 44.7%
Long-Term Debt
100% 100%
Total
Rating Agency Method
45.2% 45.3%
Common Shareholders' Equity
Preferred Stock & Deeply Subordinated Debt (QUIDS) (1) 4.5% 4.7%
Long-Term Debt (2) 50.3% 50.0%
100% 100%
Total
(1)
Includes amounts due within one year.
(2)
Includes amounts due within one year, obligations under capital leases (current and non-current) and short-term debt.
DTE Investor Relations (313) 235-8030 11
11. 1999 SALES ANALYSIS
(GWH)
Sales As
3Q 3Q % Chg YTD YTD % Chg % of
Category 1999 1998 1999 1999 1998 YTD 99 Total
Residential 4,231 4,149 2.0% 10,954 10,617 3.2% 26.2%
Commercial
Secondary 2,834 2,832 0.1% 8,021 7,838 2.3% 19.2%
Primary 2,426 2,461 -1.5% 6,822 6,596 3.4% 16.3%
Total Commercial 5,260 5,294 -0.6% 14,843 14,434 2.8% 35.5%
Industrial
Automotive 2,282 1,905 19.8% 5,982 5,552 7.7% 14.3%
Steel 749 727 3.0% 2,113 2,177 -2.9% 5.0%
Other Manufacturing 1,150 1,131 1.7% 3,531 3,380 4.5% 8.4%
Total Industrial 4,182 3,764 11.1% 11,626 11,109 4.7% 27.8%
Other 642 570 12.6% 1,900 1,722 10.3% 4.5%
Total System Sales 14,314 13,777 3.9% 39,324 37,883 3.8% 94.0%
Interconnection 620 838 -26.0% 2,532 3,594 -29.6% 6.0%
Total Sales 14,934 14,615 2.2% 41,855 41,477 0.9% 100.0%
Third Quarter Heating and Cooling Degree Day Data
1999 1998 % Change
Heating Degree Days 84 46 82.6%
Cooling Degree Days 647 667 -3.0%
Finance and Investor Relations (313) 235-8030 12