Certified Kala Jadu, Black magic specialist in Rawalpindi and Bangali Amil ba...
first energy 4Q 07
1. Consolidated Report to the Financial Community
Fourth Quarter 2007
(Released February 25, 2008)
HIGHLIGHTS
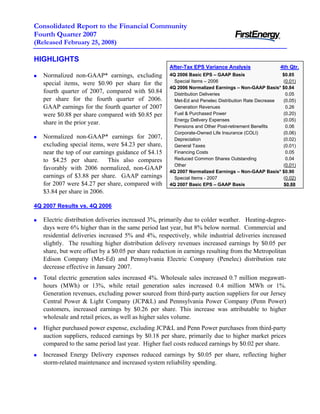
After-Tax EPS Variance Analysis 4th Qtr.
4Q 2006 Basic EPS – GAAP Basis $0.85
Normalized non-GAAP* earnings, excluding
Special Items – 2006 (0.01)
special items, were $0.90 per share for the
4Q 2006 Normalized Earnings – Non-GAAP Basis* $0.84
fourth quarter of 2007, compared with $0.84 Distribution Deliveries 0.05
per share for the fourth quarter of 2006. Met-Ed and Penelec Distribution Rate Decrease (0.05)
GAAP earnings for the fourth quarter of 2007 Generation Revenues 0.26
Fuel & Purchased Power (0.20)
were $0.88 per share compared with $0.85 per
Energy Delivery Expenses (0.05)
share in the prior year.
Pensions and Other Post-retirement Benefits 0.06
Corporate-Owned Life Insurance (COLI) (0.06)
Normalized non-GAAP* earnings for 2007, Depreciation (0.02)
excluding special items, were $4.23 per share, General Taxes (0.01)
near the top of our earnings guidance of $4.15 Financing Costs 0.05
Reduced Common Shares Outstanding 0.04
to $4.25 per share. This also compares
Other (0.01)
favorably with 2006 normalized, non-GAAP
4Q 2007 Normalized Earnings – Non-GAAP Basis* $0.90
earnings of $3.88 per share. GAAP earnings Special Items - 2007 (0.02)
for 2007 were $4.27 per share, compared with 4Q 2007 Basic EPS – GAAP Basis $0.88
$3.84 per share in 2006.
4Q 2007 Results vs. 4Q 2006
Electric distribution deliveries increased 3%, primarily due to colder weather. Heating-degree-
days were 6% higher than in the same period last year, but 8% below normal. Commercial and
residential deliveries increased 5% and 4%, respectively, while industrial deliveries increased
slightly. The resulting higher distribution delivery revenues increased earnings by $0.05 per
share, but were offset by a $0.05 per share reduction in earnings resulting from the Metropolitan
Edison Company (Met-Ed) and Pennsylvania Electric Company (Penelec) distribution rate
decrease effective in January 2007.
Total electric generation sales increased 4%. Wholesale sales increased 0.7 million megawatt-
hours (MWh) or 13%, while retail generation sales increased 0.4 million MWh or 1%.
Generation revenues, excluding power sourced from third-party auction suppliers for our Jersey
Central Power & Light Company (JCP&L) and Pennsylvania Power Company (Penn Power)
customers, increased earnings by $0.26 per share. This increase was attributable to higher
wholesale and retail prices, as well as higher sales volume.
Higher purchased power expense, excluding JCP&L and Penn Power purchases from third-party
auction suppliers, reduced earnings by $0.18 per share, primarily due to higher market prices
compared to the same period last year. Higher fuel costs reduced earnings by $0.02 per share.
Increased Energy Delivery expenses reduced earnings by $0.05 per share, reflecting higher
storm-related maintenance and increased system reliability spending.
2. Reduced pension and other post-retirement benefit costs increased earnings by $0.06 per share,
mainly due to retiree health care design changes and the impact of the $300 million voluntary
contribution to the pension plan made in January 2007.
Decreased investment income related to corporate-owned life insurance reduced earnings by
$0.06 per share.
Incremental property additions increased depreciation expense by $0.02 per share.
Higher general taxes reduced earnings by $0.01 per share, primarily due to higher Pennsylvania
gross receipts taxes.
Lower financing costs increased earnings by $0.05 per share. The decrease in financing costs is
attributable to reduced short-term borrowings, interest capitalized on higher construction
spending, and lower refinancing costs.
The reduction in shares outstanding, due to the accelerated repurchase of 14.4 million common
shares in March 2007, enhanced earnings by $0.04 per share.
During the quarter, a $0.02 per share reduction in earnings was recognized from the impairment
of securities held in trust for future nuclear decommissioning activities.
2008 Earnings Guidance
Normalized non-GAAP* earnings guidance for 2008, excluding special items, is $4.15 to $4.35
per share. Our estimate for the quarterly pattern of our 2008 earnings guidance is:
1st Quarter: 19% 2nd Quarter: 22% 3rd Quarter: 35% 4th Quarter: 24%
* The 2007 and 2008 GAAP to non-GAAP reconciliation statements can be found on page 10 of this report and all GAAP to non-
GAAP reconciliation statements are available on the Investor Information section of FirstEnergy Corp.'s Web site at
www.firstenergycorp.com/ir.
For additional information, please contact:
Ronald E. Seeholzer Kurt E. Turosky Rey Y. Jimenez
Vice President, Investor Relations Director, Investor Relations Principal, Investor Relations
(330) 384-5783 (330) 384-5500 (330) 761-4239
Consolidated Report to the Financial Community –4th Quarter 2007 2
3. FirstEnergy Corp.
Consolidated Statements of Income
(In millions, except for per share amounts)
Three Months Ended Dec. 31, Twelve Months Ended Dec. 31,
2007 2006 Change 2007 2006 Change
Revenues
(1) Electric sales $ 2,882 $ 2,492 $ 390 $ 11,944 $ 10,671 $ 1,273
(2) FE Facilities - - - - 48 (48)
(3) Other 197 188 9 858 782 76
(4) 3,079 2,680 399 12,802 11,501 1,301
Total Revenues
Expenses
(5) Fuel 291 283 8 1,178 1,212 (34)
(6) Purchased power 922 664 258 3,836 3,041 795
(7) Other operating expenses 831 735 96 3,086 2,924 162
(8) FE Facilities - - - - 41 (41)
(9) Provision for depreciation 161 151 10 638 596 42
(10) Amortization of regulatory assets 234 197 37 1,019 861 158
(11) Deferral of new regulatory assets (125) (121) (4) (524) (500) (24)
(12) General taxes 165 167 (2) 754 720 34
(13) Total Expenses 2,479 2,076 403 9,987 8,895 1,092
(14) Operating Income 600 604 (4) 2,815 2,606 209
Other Income (Expense)
(15) Investment income 27 29 (2) 120 149 (29)
(16) Interest expense (182) (193) 11 (775) (721) (54)
(17) Capitalized interest 11 5 6 32 26 6
(18) Subsidiaries' preferred stock dividends - (1) 1 - (7) 7
(19) (144) (160) 16 (623) (553) (70)
Total Other Expense
(20) Income From Continuing Operations
456 444 12 2,192 2,053 139
Before Income Taxes
(21) Income taxes 188 170 18 883 795 88
(22) Income From Continuing Operations 268 274 (6) 1,309 1,258 51
(23) Discontinued operations - - - - (4) 4
(24) Net Income $ 268 $ 274 $ (6) $ 1,309 $ 1,254 $ 55
Basic Earnings Per Common Share:
(25) Income from continuing operations $ 0.88 $ 0.85 $ 0.03 $ 4.27 $ 3.85 $ 0.42
(26) Discontinued operations - - - - (0.01) 0.01
(27) Basic Earnings Per Common Share $ 0.88 $ 0.85 $ 0.03 $ 4.27 $ 3.84 $ 0.43
(28) Weighted Average Number of
(18)
304 318 (14) 306 324
Basic Shares Outstanding
Diluted Earnings Per Common Share:
(29) Income from continuing operations $ 0.87 $ 0.84 $ 0.03 $ 4.22 $ 3.82 $ 0.40
(30) Discontinued operations - - - - (0.01) 0.01
(31) Diluted Earnings Per Common Share $ 0.87 $ 0.84 $ 0.03 $ 4.22 $ 3.81 $ 0.41
(32) Weighted Average Number of
308 321 (13) 310 327 (17)
Diluted Shares Outstanding
______________________________________________________________________________________________________
Consolidated Report to the Financial Community – 4th Quarter 2007 3
4. FirstEnergy Corp.
Consolidated Income Segments
(In millions)
Twelve Months Ended December 31, 2007
Ohio
Energy Competitive Transitional
Energy Reconciling
Delivery Generation
Services (b) Adjustments
Services (a) Services (c) Other (d) Consolidated
Revenues
(1) Electric sales $ 8,069 $ 1,316 $ 2,559 $ - $ - $ 11,944
(2) FE Facilities - - - - - -
(3) Other 657 152 37 39 (27) 858
(4) Internal revenues - 2,901 - - (2,901) -
(5) Total Revenues 8,726 4,369 2,596 39 (2,928) 12,802
Expenses
(6) Fuel 5 1,173 - - - 1,178
(7) Purchased power 3,733 764 2,240 - (2,901) 3,836
(8) Other operating expenses 1,700 1,160 305 15 (94) 3,086
(9) FE Facilities - - - - - -
(10) Provision for depreciation 404 204 - 4 26 638
(11) Amortization of regulatory assets 991 - 28 - - 1,019
(12) Deferral of new regulatory assets (371) - (153) - - (524)
(13) General taxes 623 107 4 1 19 754
(14) Total Expenses 7,085 3,408 2,424 20 (2,950) 9,987
(15) Operating Income 1,641 961 172 19 22 2,815
Other Income (Expense)
(16) Investment income 240 16 1 1 (138) 120
(17) Interest expense (456) (172) (1) (4) (142) (775)
(18) Capitalized interest 11 20 - - 1 32
(19) Subsidiaries' preferred stock dividends - - - - - -
(20) (205) (136) - (3) (279) (623)
Total Other Expense
(21) Income From Continuing Operations
1,436 825 172 16 (257) 2,192
Before Income Taxes
(22) Income taxes 574 330 69 4 (94) 883
(23) 862 495 103 12 (163) 1,309
Income From Continuing Operations
(24) Discontinued operations - - - - - -
(25) Net Income $ 862 $ 495 $ 103 $ 12 $ (163) $ 1,309
(a) Consists of regulated transmission and distribution operations, including transition cost recovery, and provider of last resort generation service for
FirstEnergy's Pennsylvania and New Jersey electric utility subsidiaries.
(b) Consists of unregulated generation and commodity operations, including competitive electric sales, and generation sales to affiliated electric utilities.
(c) Represents provider of last resort generation service by FirstEnergy's Ohio electric utility subsidiaries.
(d) Primarily consists of telecommunications services.
______________________________________________________________________________________________________
Consolidated Report to the Financial Community – 4th Quarter 2007 4
5. FirstEnergy Corp.
Consolidated Income Segments
(In millions)
Twelve Months Ended December 31, 2006
Ohio
Energy Competitive Transitional
Energy Reconciling
Delivery Generation
Services (b) Adjustments
Services (a) Services (c) Other (d) Consolidated
Revenues
(1) Electric sales $ 7,039 $ 1,266 $ 2,366 $ - $ - $ 10,671
(2) FE Facilities - - - 48 - 48
(3) Other 584 163 24 47 (36) 782
(4) Internal revenues 14 2,609 - - (2,623) -
(5) Total Revenues 7,637 4,038 2,390 95 (2,659) 11,501
Expenses
(6) Fuel 5 1,207 - - - 1,212
(7) Purchased power 3,010 605 2,050 - (2,624) 3,041
(8) Other operating expenses 1,585 1,138 247 24 (70) 2,924
(9) FE Facilities - - - 41 - 41
(10) Provision for depreciation 379 190 - 4 23 596
(11) Amortization of regulatory assets 841 - 20 - - 861
(12) Deferral of new regulatory assets (375) - (125) - - (500)
(13) General taxes 599 90 10 (2) 23 720
(14) Total Expenses 6,044 3,230 2,202 67 (2,648) 8,895
(15) Operating Income 1,593 808 188 28 (11) 2,606
Other Income (Expense)
(16) Investment income 328 35 - 1 (215) 149
(17) Interest expense (431) (200) (1) (6) (83) (721)
(18) Capitalized interest 14 12 - - - 26
(19) Subsidiaries' preferred stock dividends (16) - - - 9 (7)
(20) (105) (153) (1) (5) (289) (553)
Total Other Expense
(21) Income From Continuing Operations
1,488 655 187 23 (300) 2,053
Before Income Taxes
(22) Income taxes 595 262 75 (21) (116) 795
(23) Income From Continuing Operations 893 393 112 44 (184) 1,258
(24) Discontinued operations - - - (4) - (4)
(25) Net Income $ 893 $ 393 $ 112 $ 40 $ (184) $ 1,254
(a) Consists of regulated transmission and distribution operations, including transition cost recovery, and provider of last resort generation service for
FirstEnergy's Pennsylvania and New Jersey electric utility subsidiaries.
(b) Consists of unregulated generation and commodity operations, including competitive electric sales, and generation sales to affiliated electric utilities.
(c) Represents provider of last resort generation service by FirstEnergy's Ohio electric utility subsidiaries.
(d) Consists of telecommunications services and non-core businesses divested in 2006 (Facilities Services Group and MYR).
______________________________________________________________________________________________________
Consolidated Report to the Financial Community – 4th Quarter 2007 5
6. FirstEnergy Corp.
Consolidated Income Segments
(In millions)
Twelve Months Ended Dec. 31, 2007 vs. Twelve Months Ended Dec. 31, 2006
Ohio
Energy Competitive Transitional
Energy Reconciling
Delivery Generation
Services (b) Adjustments
Services (a) Services (c) Other (d) Consolidated
Revenues
(1) Electric sales $ 1,030 $ 50 $ 193 $ - $ - $ 1,273
(2) FE Facilities - - - (48) - (48)
(3) Other 73 (11) 13 (8) 9 76
(4) Internal revenues (14) 292 - - (278) -
(5) 1,089 331 206 (56) (269) 1,301
Total Revenues
Expenses
(6) Fuel - (34) - - - (34)
(7) Purchased power 723 159 190 - (277) 795
(8) Other operating expenses 115 22 58 (9) (24) 162
(9) FE Facilities - - - (41) - (41)
(10) Provision for depreciation 25 14 - - 3 42
(11) Amortization of regulatory assets 150 - 8 - - 158
(12) Deferral of new regulatory assets 4 - (28) - - (24)
(13) General taxes 24 17 (6) 3 (4) 34
(14) Total Expenses 1,041 178 222 (47) (302) 1,092
(15) Operating Income 48 153 (16) (9) 33 209
Total Other Expense
(16) Investment income (88) (19) 1 - 77 (29)
(17) Interest expense (25) 28 - 2 (59) (54)
(18) Capitalized interest (3) 8 - - 1 6
(19) Subsidiaries' preferred stock dividends 16 - - - (9) 7
(20) (100) 17 1 2 10 (70)
Total Other Expense
(21) Income From Continuing Operations
(52) 170 (15) (7) 43 139
Before Income Taxes
(22) Income taxes (21) 68 (6) 25 22 88
(23) Income From Continuing Operations (31) 102 (9) (32) 21 51
(24) Discontinued operations - - - 4 - 4
(25) Net Income $ (31) $ 102 $ (9) $ (28) $ 21 $ 55
(a) Consists of regulated transmission and distribution operations, including transition cost recovery, and provider of last resort generation service for
FirstEnergy's Pennsylvania and New Jersey electric utility subsidiaries.
(b) Consists of unregulated generation and commodity operations, including competitive electric sales, and generation sales to affiliated electric utilities.
(c) Represents provider of last resort generation service by FirstEnergy's Ohio electric utility subsidiaries.
(d) Consists of telecommunications services and non-core businesses divested in 2006 (Facilities Services Group and MYR).
______________________________________________________________________________________________________
Consolidated Report to the Financial Community – 4th Quarter 2007 6
7. FirstEnergy Corp.
Financial Statements
(In millions)
Condensed Consolidated Balance Sheets
As of As of
As of June 30, As Dec. 31,
of Dec 31,
Dec. 31,
2007 2006
2007 2006
Assets
Current Assets:
Cash and cash equivalents $ 129 $ 90
Receivables 1,421 1,267
Other 680 726
Total Current Assets 2,230 2,083
Property, Plant and Equipment 15,383 14,667
Investments 3,598 3,534
Deferred Charges and Other Assets 10,857 10,912
Total Assets $ 32,068 $ 31,196
Liabilities and Capitalization
Current Liabilities:
Currently payable long-term debt $ 2,014 $ 1,867
Short-term borrowings 903 1,108
Accounts payable 777 726
Other 1,454 1,554
Total Current Liabilities 5,148 5,255
Capitalization:
Common stockholders' equity (a) 8,977 9,035
Long-term debt and other long-term obligations 8,869 8,535
Total Capitalization 17,846 17,570
Noncurrent Liabilities 9,074 8,371
Total Liabilities and Capitalization $ 32,068 $ 31,196
(a) Reduction reflects $942 million common share repurchase in 2007.
General Information Three Months Ended Dec. 31, Twelve Months Ended Dec. 31,
2007 2006 2007 2006
Debt and equity securities redemptions $ (502) $ (1,629) $ (2,067) $ (3,329)
New long-term debt issues $ 427 $ 1,504 $ 1,527 $ 2,739
Short-term debt increase/(decrease) $ 330 $ (96) $ (205) $ 386
Capital expenditures $ 506 $ 325 $ 1,633 $ 1,315
Adjusted Capitalization (Including Off-Balance Sheet Items) - Rating Agency View
As of December 31,
2007 % Total 2006 % Total
Total common equity $ 8,977 40% $ 9,035 42%
Long-term debt (a) 10,486 47% 9,973 47%
Short-term debt 903 4% 1,108 5%
Off-balance sheet debt equivalents:
Sale-leaseback net debt equivalents (b) 1,990 9% 1,231 6%
Total $ 22,356 100% $ 21,347 100%
(a) Includes amounts due to be paid within one year and excludes JCP&L securitization debt of $397 million and $429 million in 2007
and 2006, respectively.
(b) Associated with 1987 and 2007 sale and leaseback transactions.
______________________________________________________________________________________________________
Consolidated Report to the Financial Community – 4th Quarter 2007 7
8. FirstEnergy Corp.
Financial Statements
(In millions)
Condensed Consolidated Statements of Cash Flows
Three Months Ended Dec. 31, Twelve Months Ended Dec. 31,
2007 2006 2007 2006
Cash flows from operating activities:
Net income $ 268 $ 274 $ 1,309 $ 1,254
Adjustments to reconcile net income to net cash from operating activities:
Depreciation, amortization, and deferral of regulatory assets 270 227 1,133 957
Deferred purchased power and other costs (81) (122) (346) (445)
Deferred income taxes and investment tax credits* 149 123 (9) 159
Deferred rents and lease market valuation liability (58) (59) (99) (113)
Electric service prepayment programs (23) (19) (75) (64)
Cash collateral, net (18) 21 (68) (77)
Pension trust contribution - - (300) -
Change in working capital and other (22) 251 149 268
485 696 1,694 1,939
Cash flows provided from operating activities
100 (360) (1,342) (804)
Cash flows provided from (used for) financing activities
(486) (287) (313) (1,109)
Cash flows used for investing activities
$ 99 $ 49 $ 39 $ 26
Net increase in cash and cash equivalents
* The Bruce Mansfield sale and leaseback transaction reduced deferred income taxes by $187 million in the twelve months ended December 31, 2007.
Deferrals and Amortizations
Three Months Ended Dec. 31, Twelve Months Ended Dec. 31,
2007 2006 Change 2007 2006 Change
Ohio Regulatory Assets - Rate Plans/Transmission
$ 1,788 $ 1,857 $ 1,844 $ 1,924
Deferred Balance - Beginning
Deferral of shopping incentives - - $ - - 3 $ (3)
Interest on shopping incentives 8 10 (2) 36 42 (6)
Deferral of MISO costs and interest 11 4 7 56 15 41
Deferral of RCP distribution reliability costs 23 35 (12) 166 155 11
Deferral of RCP fuel costs 45 19 26 107 113 (6)
$ 87 $ 68 $ 19 $ 365 $ 328 $ 37
Current period deferrals
Amortization
Ohio transition costs amortization $ (69) $ (59) $ (10) $ (291) $ (270) $ (21)
Shopping incentives amortization (29) (28) (1) (123) (121) (2)
MISO costs amortization (9) (5) (4) (29) (20) (9)
Other (7) 4 (11) (23) (12) (11)
$ (114) $ (88) $ (26) $ (466) $ (423) $ (43)
Current period amortization
$ 1,812 $ 1,844 $ 1,812 $ 1,844
Deferred Balance - Ending
Pennsylvania Deferred PJM Costs
$ 227 $ 111 $ 157 $ -
Beginning Balance
Deferrals 30 46 $ (16) 111 157 $ (46)
Interest 1 - 1 4 - 4
Amortizations (4) - (4) (18) - (18)
$ 254 $ 157 $ 254 $ 157
Ending Balance
New Jersey Deferred Energy Costs
$ 330 $ 340 $ 369 $ 541
Beginning Balance
$ (123) $ 39
Deferral (recovery) of energy costs (94) 29 (133) (172)
$ 236 $ 369 $ 236 $ 369
Ending Balance
______________________________________________________________________________________________________
Consolidated Report to the Financial Community – 4th Quarter 2007 8
9. FirstEnergy Corp.
Statistical Summary
ELECTRIC SALES STATISTICS Three Months Ended December 31, Twelve Months Ended December 31,
(in millions of kWhs) 2007 2006 Change 2007 2006 Change
Electric Generation Sales
Retail - Regulated 23,404 23,247 0.7% 97,057 96,125 1.0%
Retail - Competitive 3,056 2,833 7.9% 12,995 11,734 10.7%
Total Retail 26,460 26,080 1.5% 110,052 107,859 2.0%
Wholesale 6,543 5,804 12.7% 24,115 23,083 4.5%
Total Electric Generation Sales 33,003 31,884 3.5% 134,167 130,942 2.5%
Electric Distribution Deliveries
Ohio - Residential 4,244 4,095 3.6% 17,586 16,761 4.9%
- Commercial 3,610 3,521 2.5% 15,107 14,667 3.0%
- Industrial 5,686 5,651 0.6% 23,346 23,324 0.1%
- Other 93 94 -1.1% 372 374 -0.5%
Total Ohio 13,633 13,361 2.0% 56,411 55,126 2.3%
Pennsylvania - Residential 2,927 2,834 3.3% 11,782 11,278 4.5%
- Commercial 2,769 2,643 4.8% 11,268 10,826 4.1%
- Industrial 2,499 2,537 -1.5% 10,229 10,382 -1.5%
- Other 21 21 - 82 82 -
Total Pennsylvania 8,216 8,035 2.3% 33,361 32,568 2.4%
New Jersey - Residential 2,222 2,101 5.8% 9,839 9,548 3.0%
- Commercial 2,423 2,247 7.8% 9,867 9,450 4.4%
- Industrial 719 689 4.4% 2,885 2,831 1.9%
- Other 22 21 4.8% 88 86 2.3%
Total New Jersey 5,386 5,058 6.5% 22,679 21,915 3.5%
Total Residential 9,393 9,030 4.0% 39,207 37,587 4.3%
Total Commercial 8,802 8,411 4.6% 36,242 34,943 3.7%
Total Industrial 8,904 8,877 0.3% 36,460 36,537 -0.2%
Total Other 136 136 - 542 542 -
Total Distribution Deliveries 27,235 26,454 3.0% 112,451 109,609 2.6%
Electric Sales Shopped
Ohio - Residential 518 519 -0.2% 2,201 2,289 -3.8%
- Commercial 825 878 -6.0% 3,534 3,787 -6.7%
- Industrial 645 673 -4.2% 2,689 2,874 -6.4%
Total Ohio 1,988 2,070 -4.0% 8,424 8,950 -5.9%
Pennsylvania - Residential 29 - - 73 - -
- Commercial 186 2 - 632 4 -
- Industrial 507 132 284.1% 1,895 501 278.2%
Total Pennsylvania 722 134 438.8% 2,600 505 414.9%
New Jersey - Residential - - - - - -
- Commercial 559 478 16.9% 2,156 1,926 11.9%
- Industrial 559 525 6.5% 2,200 2,103 4.6%
Total New Jersey 1,118 1,003 11.5% 4,356 4,029 8.1%
Total Electric Sales Shopped 3,828 3,207 19.4% 15,380 13,484 14.1%
Operating Statistics
Three Months Ended Dec. 31, Twelve Months Ended Dec. 31,
2007 2006 2007 2006
Capacity Factors:
Fossil - Baseload 81% 83% 80% 89%
Fossil - Load Following 67% 69% 71% 69%
Nuclear 88% 85% 89% 87%
Generation Output:
Fossil - Baseload 40% 41% 39% 42%
Fossil - Load Following 22% 23% 23% 22%
Peaking 0% 0% 0% 0%
Nuclear 38% 36% 38% 36%
Three Months Ended Dec. 31, Twelve Months Ended Dec. 31,
Weather 2007 2006 Normal 2007 2006 Normal
Composite Heating-Degree-Days 1,824 1,715 1,977 5,443 4,900 5,534
Composite Cooling-Degree-Days 70 5 15 1,039 892 921
______________________________________________________________________________________________________
Consolidated Report to the Financial Community – 4th Quarter 2007 9
10. FirstEnergy Corp.
2007 EPS Reconciliations
(In millions, except for per share amounts)
Special Items
Three Months Ended Dec. 31, Twelve Months Ended Dec. 31,
2007 2006 2007 2006
Pre-tax Items - Income Increase (Decrease)
Gain on Non-Core Asset Sales of:
Gain on sale of First Communications (h) $ - $ - $ 21 $ -
All other (a)(f) - 11 - 12
Total Gain on Non-Core Asset Sales - 11 21 12
Saxton decommissioning costs regulatory assets (b) - - 27 -
Trust securities impairment (c) (10) (13) (26) (13)
Marbel property tax liability adjustment - 3 - 3
FE Facilities sales/impairment (d)(e)(g) - - - (13)
PA NUG purchased power adjustment applicable to 2005 (i) - - - (10)
Total-Pretax Items $ (10) $ 1 $ 22 $ (21)
EPS Effect $ (0.02) $ 0.01 $ 0.04 $ (0.04)
(a) Included in quot;Other operating expensesquot; (f) Before first quarter 2006 tax benefit of $2.5 million
(b) Included in quot;Deferral of new regulatory assetsquot; (g) Non-tax deductible
(c) Included in quot;Investment incomequot; (h) Included in quot;Other Revenuequot;
(d) Included in quot;FE Facilities expensesquot; (i) Included in quot;Purchased Powerquot;
(e) Included in quot;Discontinued Operationsquot;
2007 Earnings Per Share (EPS)
(Reconciliation of GAAP to Non-GAAP)
Three Months Twelve Months
Ended Dec. 31 Ended Dec. 31
$ 0.88 $ 4.27
Basic EPS (GAAP basis)
Excluding Special Items:
New regulatory asset authorized by PPUC - (0.05)
Gain on sale of non-core assets - (0.04)
Trust securities impairment 0.02 0.05
$ 0.90 $ 4.23
Basic EPS (Non-GAAP basis)
Non-GAAP 2008 Basic Earnings Per Share Guidance
(Reconciliation of GAAP to Non-GAAP)
2008 EPS
$4.23 - $4.43
Basic EPS (GAAP basis)
Excluding Special Items (0.08)
$4.15 - $4.35
Basic EPS (Non-GAAP basis)
______________________________________________________________________________________________________
Consolidated Report to the Financial Community – 4th Quarter 2007 10
11. RECENT DEVELOPMENTS
Ohio Substitute Senate Bill 221
On October 31, 2007, the Ohio Senate passed Substitute Senate Bill 221 which seeks to revise state energy policy.
Among other things, the bill outlines a process for establishing electricity prices for generation beginning in 2009,
and includes a requirement that at least 25% of the state’s electricity come from advanced energy technologies by
2025, with at least one-half of the 25% requirement coming from renewable resources.
The Ohio House of Representatives referred the bill to the House Public Utilities Committee which conducted
various hearings between November 2007 and February 2008. During the November 14, 2007, hearing, President
and Chief Executive Officer Tony Alexander provided testimony on the history and status of deregulation in Ohio.
In his remarks, Mr. Alexander indicated that Ohioans should have the opportunity to participate in the competitive
electricity marketplace as provided for under Ohio's 1999 deregulation law, Senate Bill 3, which set the stage for
long-term price moderation as well as more reliable and responsive service for Ohio's customers. On November
28, 2007, Senior Vice President and General Counsel Leila Vespoli provided testimony on the bill’s alternative
options for establishing electric generation pricing in 2009. In her remarks, Ms. Vespoli expressed the industry’s
concerns with Substitute Senate Bill 221, saying the legislation should be modified to provide the PUCO with
expanded regulatory tools and statutory authority to negotiate rate plans, and to include a true market rate option.
On January 16, 2008, Vice President of Rates and Regulatory Affairs David Blank provided testimony on special
discounted-rate contracts indicating that the rationale to support their continued use no longer exists.
Ohio Distribution Rate Case Filing
On December 4, 2007, the PUCO Staff issued its Staff Reports containing the results of their investigation into the
distribution rate requests for FirstEnergy subsidiaries Ohio Edison Company, The Cleveland Electric Illuminating
Company, and The Toledo Edison Company (collectively the Ohio Companies). In its Reports, the PUCO Staff
recommended a distribution rate increase of $161 million to $180 million compared to the Ohio Companies’
request of $332 million. However, during the evidentiary hearings, the PUCO Staff submitted testimony
decreasing their recommended revenue increase to a range of $114 million to $132 million. The revisions
primarily related to property tax, depreciation, and deferred tax corrections, as well as other miscellaneous
adjustments. Key differences between the Staff Reports’ recommendation and the Ohio Companies’ request
include: matters to be considered in separate proceedings ($115 million), and a recommended return on equity of
10% to 11% versus the Ohio Companies’ request of 11.75% ($16 million to $35 million).
On January 3, 2008, the Ohio Companies and intervening parties filed objections to the Staff Reports and on
January 10, 2008, the Ohio Companies filed supplemental testimony, while intervening parties filed their direct
testimony. Evidentiary hearings began on January 29 and are expected to conclude in late February 2008. The
PUCO is expected to render its decision during the 2nd or 3rd quarter of 2008.
Ohio Supreme Court Remand on Rate Certainty Plan
On January 9, 2008, the PUCO issued its Finding and Order on the Ohio Companies’ application on remand
seeking to recover incremental fuel costs deferred in 2006 and 2007, and fuel costs that would otherwise be
deferred in 2008, via two generation-related fuel cost tariff riders. The Order approved the implementation of the
tariff rider to recover actual incremental fuel costs incurred from January 1, 2008 through December 31, 2008
(estimated to be $167 million), but directed the Ohio Companies to file a separate application with an alternative
recovery mechanism to collect the 2006 and 2007 deferred fuel costs and associated carrying charges
($220 million balance as of December 31, 2007). On February 8, 2008, the Ohio Companies filed an application
proposing to recover the deferred fuel costs and carrying charges for 2006 and 2007 via a separate fuel rider, with
alternative options for the recovery period ranging from 5 to 25 years. This second application is pending before
the PUCO.
Consolidated Report to the Financial Community – 4th Quarter 2007 11
12. Penn Power Default Service Plan
On October 30, 2007, an Administrative Law Judge (ALJ) recommended that the Pennsylvania Public Utility
Commission (PPUC) approve the Joint Petition for Settlement for Pennsylvania Power Company’s (Penn Power)
Interim Default Service Supply Plan for the period covering June 1, 2008 through May 31, 2011. On December
20, 2007, the PPUC accepted all provisions of the Settlement Agreement except for the provision related to the
procurement of default service supply for residential customers, which was remanded to the ALJ for further
proceedings. The PPUC encouraged Penn Power to further consider adopting a portfolio approach that
incorporates the use of a variety of energy products in lieu of load-following, full requirements contracts for
default service procurement for residential customers. Under the terms of the Settlement Agreement, the default
service procurement for small commercial customers will be done with multiple requests for proposals (RFPs),
while the default service procurement for large commercial and industrial customers will utilize hourly pricing.
Bids in the first RFP for small commercial load were received on February 20, 2008. In February 2008, parties
filed direct and rebuttal testimony in the remand proceeding for the residential procurement approach. An
evidentiary hearing is scheduled for February 26, 2008, and this matter is expected to be presented to the PPUC
for its consideration by March 13, 2008.
Met-Ed and Penelec NUG Accounting Case
On November 8, 2007, the PPUC denied Metropolitan Edison Company’s and Pennsylvania Electric Company’s
request to modify their Non-Utility Generation (NUG) stranded cost accounting methodology to eliminate
reductions of the deferred cost balance during periods in which market prices exceeded NUG payments.
Nuclear Generation Record Output
FirstEnergy Nuclear Operating Company (FENOC) set a new annual generation output record of 30.3 million
megawatt-hours, surpassing FENOC’s previous best of 29.9 million megawatt-hours, set in 2004. Top-quartile
capability factor performance at Beaver Valley Unit 2 and Davis-Besse of 99.8 percent and 98.6 percent,
respectively, along with unit uprates of 43 MW and 24 MW at our Beaver Valley Units 1 and 2, respectively,
contributed to this accomplishment.
Nuclear Operations Update
On February 14, 2008, the 893-MW Davis-Besse Nuclear Power Station returned to service following completion
of its scheduled refueling outage, which began on December 30, 2007, and replacement of a component on the
generator rotor which was damaged during the outage. In addition to replacing 76 of the 177 fuel assemblies,
several improvement projects were completed, including rewinding the turbine generator and reinforcing welds on
plant equipment.
On December 10, 2007, the 1,258-MW Perry Nuclear Plant returned to service following the completion of
repairs to the Digital Feedwater Control and Reactor Core Isolation Cooling systems. The plant experienced an
automatic shutdown on November 28 due to two failed power supplies in the Digital Feedwater Control system.
A Nuclear Regulatory Commission special inspection team monitored the plant’s repair and restart efforts.
Power Uprates
Mansfield Unit 3 achieved a power uprate of 30 MW during the fourth quarter of 2007 after returning to service
following a scheduled maintenance outage. This uprate was achieved in support of FirstEnergy’s operating
strategy to maximize the full potential of its existing generation assets. This brings the total amount of generating
capacity added through power uprates in 2007 to 105 MW. Our supply portfolio was also enhanced during the
year through the reduction of seasonal derates by 149 MW at our peaking units and through long-term contracts to
purchase the output of 115 MW from wind generators.
Consolidated Report to the Financial Community – 4th Quarter 2007 12
13. Partially Complete Combined-Cycle Generating Plant Acquired
On January 28, 2008, FirstEnergy Generation Corp. (FGCO) entered into definitive agreements to acquire a
partially complete 707-MW natural gas fired generating plant in Fremont, Ohio from Calpine Corporation for
$253.6 million. Construction of the facility began in September 2001 and aggregate construction costs expended
to date are approximately $300 million. The facility includes two combined-cycle combustion turbines and a
steam turbine capable of producing 544 MW of load-following capacity and 163 MW of peaking capacity. In
court documents, Calpine has estimated that the plant is 70% complete and could become operational within 12 to
18 months. Based on those documents, FGCO estimates the additional expenditures to complete the Facility to be
approximately $150 million to $200 million. While FGCO believes these timing and cost estimates to be
accurate, the final cost and timeframe for construction are subject to a pending engineering study. The plant is
connected to both the Midwest Independent Transmission System Operator and the PJM Interconnection. The
acquisition will enhance the diversity of FirstEnergy’s generation fleet and further reduce its average carbon
dioxide emission rate.
Common Stock Dividend Increase
On December 18, 2007, FirstEnergy’s Board of Directors declared a quarterly dividend of $0.55 per share on
outstanding common stock, a 10% increase, payable March 1, 2008. The new indicated annual dividend is $2.20
per share. This action brings FirstEnergy’s cumulative dividend increase to 47% since the beginning of 2005, and
is consistent with FirstEnergy’s policy, which targets sustainable annual dividend growth and a payout that is
appropriate for FirstEnergy’s level of earnings.
Share Repurchase Program Completed
On December 10, 2007, Morgan Stanley completed its acquisition of common shares under FirstEnergy’s
accelerated share repurchase program for 14.4 million shares executed in March 2007. FirstEnergy subsequently
paid Morgan Stanley approximately $51 million for a purchase price adjustment (direct charge to common
stockholders’ equity) that resulted in a final purchase price of $942 million, or $65.54 per share.
Extension and Amendment of Credit Facility
On November 20, 2007, FirstEnergy and certain of its subsidiaries, including all of its operating utility
subsidiaries, agreed, pursuant to a Consent and Amendment with the lenders under the $2.75 billion credit facility
dated as of August 24, 2006, to extend the termination date of the facility for one year to August 24, 2012. The
parties also agreed to amendments that will permit the FirstEnergy parties to request an unlimited number of
additional one-year extensions of the facility termination date upon shorter notice than provided by the original
facility terms, which permitted only two extensions. In addition, the amendments increase FirstEnergy Solutions
Corp.’s (FES) borrowing sub-limit under the credit facility to up to $1 billion and remove any requirements for the
delivery of a FirstEnergy guaranty of FES’ obligations.
Establishment of the FirstEnergy Fund for Advanced Energy Research
On December 13, 2007, FirstEnergy announced a $2 million pledge to The University of Akron to establish the
FirstEnergy Fund for Advanced Energy Research. The fund will be used to create the FirstEnergy Advanced
Energy Research Center at the University and support development of carbon capture and coal-based fuel cells.
The Advanced Energy Research Center initially will focus on development of carbon capture technologies that
could be used by fossil-fueled power plants and the development of coal-based fuel cells for commercial use.
Consolidated Report to the Financial Community – 4th Quarter 2007 13
14. Forward-looking Statements. This Consolidated Report to the Financial Community includes forward-looking statements based on information currently
available to management. Such statements are subject to certain risks and uncertainties. These statements include declarations regarding our, or our
management’s, intents, beliefs and current expectations. These statements typically contain, but are not limited to, the terms “anticipate,” “potential,” “expect,”
“believe,” “estimate” and similar words. Forward-looking statements involve estimates, assumptions, known and unknown risks, uncertainties and other
factors that may cause our actual results, performance or achievements to be materially different from any future results, performance or achievements
expressed or implied by such forward-looking statements. Actual results may differ materially due to the speed and nature of increased competition in the
electric utility industry and legislative and regulatory changes affecting how generation rates will be determined following the expiration of existing rate plans
in Ohio and Pennsylvania, economic or weather conditions affecting future sales and margins, changes in markets for energy services, changing energy and
commodity market prices, replacement power costs being higher than anticipated or inadequately hedged, the continued ability of FirstEnergy’s regulated
utilities to collect transition and other charges or to recover increased transmission costs, maintenance costs being higher than anticipated, other legislative and
regulatory changes including revised environmental requirements and possible greenhouse gas emissions regulation, the uncertainty of the timing and amounts
of the capital expenditures needed to, among other things, implement the Air Quality Compliance Plan (including that such amounts could be higher than
anticipated) or levels of emission reductions related to the Consent Decree resolving the New Source Review litigation or other potential regulatory initiatives,
adverse regulatory or legal decisions and outcomes (including, but not limited to, the revocation of necessary licenses or operating permits and oversight by the
Nuclear Regulatory Commission including, but not limited to, the Demand for Information issued to FENOC on May 14, 2007) as disclosed in our SEC filings,
the timing and outcome of various proceedings before the PUCO (including, but not limited to, the Distribution Rate Cases and the generation supply plan filing
for the Ohio Companies and the successful resolution of the issues remanded to the PUCO by the Supreme Court of Ohio regarding the Rate Stabilization Plan
and the Rate Certainty Plan, including the deferral of fuel costs) and the PPUC (including the resolution of the Petitions for Review filed with the
Commonwealth Court of Pennsylvania with respect to the transition rate plan for Met-Ed and Penelec), the continuing availability of generating units and their
ability to continue to operate at or near full capacity, the ability to comply with applicable state and federal reliability standards, the inability to accomplish or
realize anticipated benefits from strategic goals (including employee workforce initiatives), the ability to improve electric commodity margins and to experience
growth in the distribution business, changing market conditions that could affect the value of assets held in our nuclear decommissioning trust fund, pension
fund and other trust funds, the ability to access the public securities and other capital markets and the cost of such capital, the risks and other factors discussed
from time to time in our SEC filings, and other similar factors. The foregoing review of factors should not be construed as exhaustive. New factors emerge
from time to time, and it is not possible for us to predict all such factors, nor can we assess the impact of any such factor on our business or the extent to which
any factor, or combination of factors, may cause results to differ materially from those contained in any forward-looking statements. Dividends declared from
time to time on FirstEnergy's common stock during any annual period may in aggregate vary from the indicated amounts due to circumstances considered by
FirstEnergy's Board of Directors at the time of the actual declarations. Also, a security rating is not a recommendation to buy, sell or hold securities, and it may
be subject to revision or withdrawal at any time and each such rating should be evaluated independently of any other rating. We expressly disclaim any current
intention to update any forward-looking statements contained herein as a result of new information, future events, or otherwise.
Consolidated Report to the Financial Community – 4th Quarter 2007 14