
Recommended
Recommended
More Related Content
Similar to I. Project 3 Financial Statement Analysis ProjectII. Introduct
Similar to I. Project 3 Financial Statement Analysis ProjectII. Introduct (8)
More from fideladallimore
More from fideladallimore (20)
Recently uploaded
Recently uploaded (20)
I. Project 3 Financial Statement Analysis ProjectII. Introduct
- 1. I. Project 3: Financial Statement Analysis Project II. Introduction: This project is designed to assess your ability to research corporate data, analyze and interpret financial statements and make a presentation to your boss and colleagues. The project provides opportunities for you to further develop the following competencies: Graduate School Core Competencies: 1. Communication 2. Critical thinking Accounting Competencies: 3. Measurement, analysis, and interpretation 4. Reporting 5. Research 6. Technology and tools Business Competencies: 7. Global and industry perspective Professional Competencies: 8. Professional behavior Scenario: You graduated with a MS in accounting from UMGC and have recently been hired by a large accounting firm in Washington, D.C. You report directly to the senior accountant, Kathryn Cowgal, who is originally from Colorado and loves to ski when she’s not riding horses. Fortunately, you and Kathryn hit it off right away and you’re excited to be part of her team. It’s Monday morning, you’re at your desk with a cup of coffee and a Danish staring at your long list of emails wondering how
- 2. you’ll ever have time to catch up on last week’s projects. Your boss Kathryn briskly enters your office, sits down, and says, you’re going to love this assignment. I have hand-picked you to prepare a financial analysis for a new client in the retail industry. Kathryn goes on to say your report will be part of a company-wide analysis of the retail business sector in the US. For the analysis, she instructs you to choose from a list of paired public retail companies that are among the Fortune 500 and to be prepared to present your findings to the client. Kathryn hands you the list of paired public retail companies, suggested steps to follow, and a list of deliverables. She strongly encourages you to submit drafts, which she refers to as milestones. The purpose of the milestones is to receive Kathryn’s constructive feedback on your deliverables to give you an opportunity to improve your final versions before her deadline. Further, Kathryn informs you that she and the CFO will also be attending your presentation to the client. They plan to use your presentation as part of the first quarter review all new employees undergo during the probation period with the company. Realizing this project could make or break your opportunity to stay employed beyond the probation period, you decide to review financial analyses techniques, interpreting SEC 10-K reports, and other resources to prepare the report and make a stellar presentation (Appendix A). III. Steps to Completion: Step 1: Select two companies to analyze Selectany pair of companies found in the Project 3 Fortune 500 Paired Companies List (Excel). Post your selection in the Subject Line of the Week 8 discussion topic. Each paired- company can only be selected by one student. Before making your selection, check the discussion to learn which paired- companies have already been selected by a colleague, and therefore no longer an option for you.
- 3. Step 2: Conduct research Click Edgar to search for the SEC filings of your chosen retail paired corporations. Download and review the SEC Forms 10-K for the most recent year. If you are unfamiliar with the corporations you selected, learn more about each company by reading Part I of its SEC Form 10- K. To learn more about the corporations, the following resources will be helpful: · UMUC Library: Research Guide for Business and Management: Resources · Browse all databases in this guide to find the most relevant resources · Hoovers will be used for the industry averages · Academic journals · ABI/Inform is the best starting point · Click Peer Reviewed · Federal government Websites · Big 4 Accounting firm articles published within the last 3 years Step 3: Using technology and tools to measure, analyze, and interpret · In Excel: 1. Perform a horizontal analysis of the Balance Sheet and Income Statement for the most recent 2 years in Excel using formulas. Reference different sheets in your formulas when necessary. 2. Perform a vertical analysis of the Balance Sheet and Income Statement for the most recent 2 years in Excel using formulas. Reference different sheets in your formulas when necessary. 3. Perform ratio analyses using 20 ratios for each corporation using formulas in each cell that contains an answer. Reference different sheets in your formulas when necessary. 4. Compare the horizontal analysis, vertical analysis, financial ratio analysis of both corporations and the industry averages,
- 4. which can be found in Hoovers, to detect trends and outliers, if any. 5. Summarize your findings on the last sheet. Step 4: Reporting Create an Excel file. · Start by pasting the original SEC 10-K reports for each corporation into Tabs 1 and 2. · Highlight figures on the Form 10-K’s you will use in your analyses · Note: all computations must be computed via an Excel formula that references other sheets when necessary. The Excel file must be prepared by you. · Add sheets to your Excel file as follows: Sheet # Label Contents Notes 1 Corp A BS & IS of Corp A Copy & paste from Edgars Cite all sources 2 Corp B BS & IS of Corp B Copy & paste from Edgars Cite all sources 3 Ind Avgs Industry averages Copy & paste from Hoovers Cite all sources 4 Horizontal Side-by-side horizontal analyses
- 5. Both Corp A & B, must use formulas 5 Vertical Side-by-side vertical analyses Both Corp A & B, must use formulas 6 Ratios 20 relevant financial ratios Select the same ratios for both Corp A & B. Must use formulas 7 Comparison Compare the same 20 financial ratios of both companies to the industry averages. Look for anomalies, outliers, trends, similarities, differences Compare Corp A to Corp B & to the Industry averages (in Hoovers). Cite all sources. Must use formulas. 8 Summary Present a side-by-side comparison & note your findings Corp A & B and Industry Averages Cite all sources Step 5: Critical thinking and communication Create a Word document summarizing your analyses and recommendations for both Corporation A and B. · Approximately a 3-4-page report not including the cover sheet and reference list · Must be in APA format. · Include accurate citations and a reference list. · Please use spell check before submitting your final copy. Step 6: Presentation with Oral Communication Prepare a PowerPoint presentation that includes the following: · Graphs, tables, and other data visualization tools to explain your findings
- 6. · Speaker’s notes must be placed under each slide. · All slide content and speaker’s notes must be in your own words. · The audio enhancement should be embedded and run without requiring your professor to click the “Play” button on each slide. · Note, the sample PowerPoint presentation located in Projects & Rubrics is one way to add audio; there are other methods. · Note, when you click “Play from Start” on slide 1, the slides advance automatically, the closed captioning is shown below each slide, there are no background distractions, and the presenter speaks clearly at a reasonable pace. Keep in mind that the main objective of that project was different from the main objective of this project. · Read the speaker’s notes you created to create the audio file. · One slide should include a summary side-by-side comparison of the two corporations and the industry averages you computed on Tab 8 of the Excel file. Note your findings on the slide face or in the speaker’s notes. · Important – state your recommendations to improve profitability in Company A and B. IV. Deliverables: This project has three deliverables in the following formats: Excel, Word, and PowerPoint 1. Excel workbook with 8 tabs (Sheets). 2. Word report as described above and written in your own words. Use spell check. 3. PowerPoint presentation as described above. Use spell check. V. Hints and Tips: · As your professor, please note that I have very little interest in reading what others in the field have written. It is fine to quote sources to illustrate or support your own thoughts, however, every graded assessment in graduate accounting courses will be based on the content you have thought about and you have
- 7. written in your own words. To properly guide you, I need to read your thoughts and interpretations and observe you making presentations which demonstrate your comprehension of the learning goals and ability to perform the competencies. · Read the grading rubric before beginning the project to fully understand the requirements; ask questions about the requirements if needed. · Use spell check! · Review and refresh your memory of APA style formatting 3-4 weeks before the assignment is due. · Writing a Research Paper: https://owl.english.purdue.edu/owl/resource/658/01/ · APA: https://owl.english.purdue.edu/owl/section/2/10/ · Developing your graduate level writing skills: https://owl.english.purdue.edu/owl/section/1/2/ · What Constitutes Graduate Level Writing; source unknown. In LEO, Content, Week 9. · Seek feedback for submitting your final version for a grade. · Ask a classmate, friend or family member to read your report, watch your presentation, and share constructive feedback to help improve your final version. · Submit your draft Word document to the Graduate Writing Center at least 1 week before the project due date. This FREE resource can be accessed in your LEO classroom. Make edits to your report after reviewing feedback from the writing center tutors. · Submit all required files on or before the due date. Late assignment policies can be found in the syllabus. No assignments are accepted after the last day of class. · Ask questions as needed in the weekly Ask the Professor forums. Students may discuss questions about the project in LEO. VI. Rubric: You will find the rubric in LEO under Contents>Course Resources>Projects & Rubrics. It is highly recommended that
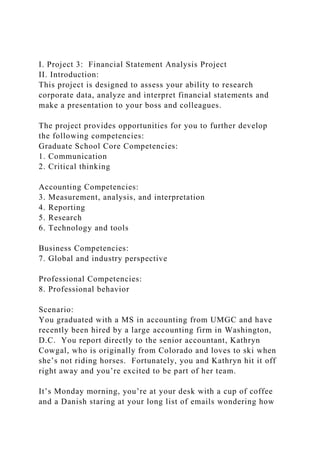
- 8. you read the entire project and review the rubric before you start the Steps to Completion. Your deliverables will be graded according to the rubric. 1 A Comparative Analysis of Home Depot & Lowe's By: NYSE: LOW NYSE: HD Background Home Depot is the world's largest home improvement retailer. Lowe's Companies, Inc. And subsidiaries are the world's second largest home improvement retailer. Both stores retail include: home improvement, building, hardware, do-it-yourself (DIY), do it for me (DIFM), and décor products Home Depot is 23rd & Lowe's is 40th on the Fortune 500 Financial Statements
- 9. Tenebruso, J. (2018). Better buy: the Home Depot, Inc. vs. Lowe’s. Retrieved April 16, 2019 from, https://www.fool.com/investing/2018/10/17/better-buy- the-home-depot-inc-vs-lowes.aspx Home Depot revenue is nearly 50% larger than Lowe's. Home Depot has a higher operating margin 14.5% compared to 8.9%. Home Depot generated more than twice as much cash from operations and free cash flow. 3 Growth Tenebruso, J. (2018). Better buy: the Home Depot, Inc. vs. Lowe’s. Retrieved April 16, 2019 from, https://www.fool.com/investing/2018/10/17/better-buy- the-home-depot-inc-vs-lowes.aspx Lowe's revenue growth has slightly outpaced Home Depot but, Home Depot has provided higher profit growth. Lowe's grow from cost reduction initiatives and Home Depot e- commerce. 4 Valuation
- 10. Tenebruso, J. (2018). Better buy: the Home Depot, Inc. vs. Lowe’s. Retrieved April 16, 2019 from, https://www.fool.com/investing/2018/10/17/better-buy- the-home-depot-inc-vs-lowes.aspx P/FCF - Price to free cash flow P/E - Price to Earnings PEG – Price to earnings to growth Home depot stock is more expensive. 5 Horizontal Analysis Home Depot stronger balance sheet Cash flow more Robust And higher dividends 6 Vertical Analysis
- 11. Home depot higher net earnings, bigger sales, larger operating income 7 Financial Ratios Market Performance Ratios EPS Home Depot 6.25 Lowes 4.15 Profitability Ratios Gross Profit Margin Home Depot 0.34 Lowes 0.34 Asset Utilization/ Turnover Ratios Inventory Turnover Home Depot 5.57 Lowes 3.97 EPS – Home Depot is a better value than Lowes Gross – Profit Margin is equal. They both have about the same amount left over from sales once cost of goods sold is taken into account. Inventory – Home Depot is able to turn it's inventory over more times than Lowes. 8 Financial Ratios cont. Liquidity Ratios Current Ratio Home Depot 1.03 Lowe’s 1.20 Debt Ratios
- 12. Cash Coverage Home Depot 17.86 Lowe’s 12.69 Current Ratio – Lowe's is however surpassing Home Depot in meeting it's financial obligations. This is due to Lowe's carrying lower debt than Home Depot Cash Coverage – Home Depot is more liquid than Lowe's due to the availablity of more revenue and retained earnings 9 Conclusion Neither company is a bad investment. Lowe's stock has room to grow. Home Depot is more robust and thus the better investment now. Home Depot is paying higher dividends. Home Depot has more cash available. Home Depot has more operating capital. Lowe's is up and coming but, not on the same level as Home Depot. 10 SIC NAICS Aerospace United Technologies Corp Honeywell International Inc 3724 336412 Airlines American Airlines Group Inc Delta Air Lines Inc 4512
- 13. 481111 Apparel Nike Inc VF Corp 3021 424340 Apparel The Gap Inc Ross Stores Inc 5651 448140 Autos Manufacturing Fox Factory Holding Corp Harley- Davidson 3751 336991 Auto Parts Icahn Enterprises LP O'Reilly Automotive Inc 5531 441310 Beverage Constellation Brands Inc Brown-Forman Corp 2084 312130 Bottled Beverages The Coca-Cola Co PepsiCo Inc 2086 312111 Building Materials, Glass Builders FirstSource Inc. Boise Cascade Co 5211 423310 Commerial Banks Wells Fargo & Co. Citigroup Inc 6021 522110 Computer Software International Business Machines Corp Hewlett Packard Enterprise Co 7379 541519 Contruction and Farm Equipment Deere & Co AGCO Corp 3523 333111 Defense Northrop Grumman Corp Raytheon Co 3812 334511 Education Laureate Education K12 Inc. 8299 611710 Electronics, Electrical Equip. Hubbell Inc. Methode Electronics Inc 3679 334417 Energy Vistra Energy Corp Entergy Corp 4911 221122 Entertainment Comcast Corp The Walt Disney Co. 4841 515210 Financial Data Services PayPal Holdings Inc Mastercard Inc 7389 561499 Food Production General Mills Inc Kellogg Co 2043 311230 Food and Drug Stores Sprouts Farmers Market Inc Chefs' Warehouse Inc 5411 445299 General Merchandisers Macy's Inc Kohl's Corp 5311 448150/44 8120 Healthcare: Medical
- 14. Facilities Genesis Healthcare Inc. Ensign Group Inc 8051 623110Healthcare: Pharmacy and Other Quest Diagnostics Inc Laboratory Corporation of America Holdings 8071 621511 Home Equipment and Furnishings Mohawk Industries Inc Interface Inc 2273 314110 Home Builders Lennar Corp Century Communities Inc 1521 236115 Hotels, Casinos, Resorts Hilton Worldwide Holdings inc Hyatt Hotels Corp 7011 721110 Household and Personal Products Colgate-Palmolive Co. Estee Lauder Companies Inc 2844 325620 Industry Machinery Illinois Tool Works, Inc. Zebra Technologies Corp 3569 333999 Mail Packing and Freight Air Transport Services Group Inc FedEx Corp 4513 492110 Packagin, Containers Ball Corp Crown Holdings Inc. 3411 332431 Pharmaceuticals AmerisourceBergen Corp. Cardinal Health Inc. 5122 424210 Plastics Berry Global Group Inc Tupperware Brands Corp 3089 326199 Railroads CSX Corp Norfolk Southern Corp 4011 482111 Retail - Good & Beverage United Natural Foods Inc SpartanNash Co. 5141 424410 Securities Franklin Resources Inc Ameriprise Financial Inc 6282 523930 Shipping Kirby Corp. Matson, Inc 4449 483211/48 3113
- 15. Temporary Help Robert Half International Inc Kelly Services Inc 7363 561320 Transportation and Roadrunner Transportation Systems Inc. C.H. Robinson Worldwide Inc. 4731 488510 Trucking, Truck Leasing J.B. Hunt Transport Services Inc Knight-Swift Transportation Holdings Inc 4213 484121 Waste Management Advanced Disposal Services Inc US Ecology Inc 4953 562211 Guidelines: Only 1 student per paired companies - no exceptions You may NOT change your selection - no exceptions Industry / Service or Products Sold Company 1 is Paired with Company 2 Last updated 4/3/20 Sharon L. Levin Page 1 of 3 Business Research: Finding Financial Ratios for Companies and Industries Financial ratios show the mathematical relationship between two numbers related to a company's or an industry's performance. Once a ratio has been calculated according to the relevant formula, the ratio can be used to help determine how well a particular company or industry is doing in comparison to its competitors and/or in comparison to its own past
- 16. performance. Here's how to find company and industry ratios in various UMGC Library databases. Business Insights: Essentials Company ratios • Click on the Companies link from the menu bar toward the top of the database's home page and then on the link for Financial Reports. • Browse or search for a U.S. company's name. • Click on the Ratios tab on the resulting Fundamentals Analysis page. Industry ratios • Click on the Industries link from the menu bar toward the top of the database's home page and then on the link for Plunkett Reports. • Use the search box on the left-hand side of the page to search for an industry by keyword or NAICS code. The resulting report will include ratios and analysis for the industry. D&B Hoovers Company ratios • Enter a company's name in the search box on the database's home page and click on its name from the results list.
- 17. • On the company information page, below the "Financials" heading on the left-hand side of the page, click on the Annual Ratios link and/or the Ratio Comparisons link. Industry ratios • Enter an industry's name, SIC code, or NAICS code in the search box on the database's home page and use the drop-down menu next to the search box to select Industries. • Click on the industry link on the search results page. • On the industry information page, below the "Market Research" heading on the left- hand side of the page, click on the All Market Research Reports link and scroll through the list of available reports to select relevant report(s), such as RMA Industry Norms reports. https://sites.umuc.edu/library/libhow/businessresearch- financialratios.cfm https://sites.umuc.edu/library/libhow/businessresearch- financialratios.cfm https://sites.umuc.edu/library/libhow/businessresearch- financialratios.cfm http://ezproxy.umuc.edu/login?url=http://infotrac.galegroup.co m/itweb/umd_umuc?db=BIE http://ezproxy.umuc.edu/login?url=https://www.mergentonline.c om/Hoovers Last updated 4/3/20 Sharon L. Levin Page 2 of 3
- 18. Factiva Company ratios • Click on the Companies/Markets link from the menu bar toward the top of the database's home page and then on Company. • Search for a company and click on its name from the search results. • On the company snapshot page, click on Financial Results from the left-hand side of the page and use the drop-down menu next to "Statement Type" to select Key Ratios. Industry ratios • Click on the Companies/Markets link from the menu bar toward the top of the database's home page and then on Industry. • Click on the link for an industry. • On the industry snapshot page, scroll down to the "Industry Averages and Ratios" section. Mergent Online Company ratios • Enter a company's name in the search box on the database's home page and click on the company's name from the search results. • On the company information page, click on the Company
- 19. Financials tab and then on the Ratios sub-tab. Industry ratios • Click on the Industry Analysis tab on the database's home page and then select from the among the available industries and/or regions. • Industry reports contain data that demonstrate industry performance. Nexis Uni Company ratios • Click on the Menu link in the upper left-hand corner of the database's home page and then on Company Dossier. • Enter a company's name in the "Company name" search box and click on its name on the results page. • On the company snapshot page, click on Financial Overview from the menu on the left- hand side of the page and then click on the link for Ratio Analysis. Industry ratios • Click on the Menu link in the upper left-hand corner of the database's home page and then on Company Dossier. • Click on the Industry tab at the top of the resulting page and enter an industry's name
- 20. or SIC code into one of the search boxes. • Click on the link for an industry from the results page. • On the industry overview page, click on the link for Ratio Components. (Source: https://sites.UMGC.edu/library/libhow/businessresearch- financialratios.cfm) http://ezproxy.umuc.edu/login?url=https://global.factiva.com/en /sess/login.asp?xsid=S003Wvf1WFo5DEs5DEmM9YuNTAvOD FyMHmnRsIuMcNG1pRRQUFBQUFBQUFBQUFBQUFB http://ezproxy.umuc.edu/login?url=http://www.mergentonline.co m/compsearch.asp http://ezproxy.umuc.edu/login?url=http://www.nexisuni.com https://sites.umuc.edu/library/libhow/businessresearch- financialratios.cfm Last updated 4/3/20 Sharon L. Levin Page 3 of 3 S&P NetAdvantage Company ratios • Enter a company's name in the search box on the database's home page and click on its name from the results list. • On the company profile page, below the "Financials/Valuation" heading on the left-hand side of the page, click on the Ratios link.
- 21. Industry ratios • Click on the Industry Survey link on the database's home page. • Use the drop-down menu in the "Industry Surveys" section of the resulting page to select an industry. • Click on the PDF icon next to the name of a report of interest. • Scroll through the report to the relevant section (e.g., "Key industry ratios and statistics," "Financial metrics," etc.). Additional Resources The UMGC Library contains many resources that can be used to find more information about what financial ratios are, how they're calculated, what they can be used for, etc. A sampling of these resources is given below: • Financial ratios - provides information about five categories of ratios: profitability, activity, liquidity, leverage, and market value • Financial ratios - provides information about four categories of ratios: profitability/return on investment, liquidity, leverage, and efficiency • Financial ratios - provides information about many types of financial ratios: profitability, asset utilization, leverage, liquidity, market value, and common size, as well as cautionary information about the use and interpretation of financial ratios
- 22. • Business ratios and formulas: A comprehensive guide (2nd edition) - per the preface for this e-book, "There are nearly 200 measurements itemized in this book. Each one is accompanied by a complete description, an explanation of the calculation, an example, and cautions regarding its use." • Financial ratios: How to use financial ratios to maximize value and success for your business - per the foreword for this e-book, the book looks at financial ratios from the perspectives of customers, employees, suppliers, the community, and shareholders • Intermediate accounting for dummies - this e-book presents 10 ratios for financial statement analysis, in addition to numerous other accounting- related topics • Analysis of financial statements (3rd edition) - per the description for this e-book, the book's "authors demonstrate the nuts and bolts of financial analysis by applying the techniques to actual companies" http://ezproxy.umuc.edu/login?url=https://na.capitaliq.com/ip/M ARUC http://ezproxy.umuc.edu/login?url=http://search.ebscohost.com. ezproxy.umuc.edu/login.aspx?direct=true&db=ers&AN=891637 14&site=eds-live&scope=site http://link.galegroup.com/apps/doc/CX2687200266/GVRL?u=u md_umuc&sid=GVRL&xid=d6c1b215 http://link.galegroup.com/apps/doc/CX3273100106/GVRL?u=u