A PROPOSED APPROACH TO ANALYTICAL METHOD LONG-TERM STABILITY ASSESSMENT
•
1 like•302 views

Apresentado no Congresso EUROMEDLAB, Innsbruck Austria 2009
Recommended

Recommended
More Related Content
What's hot
What's hot (20)
Similar to A PROPOSED APPROACH TO ANALYTICAL METHOD LONG-TERM STABILITY ASSESSMENT
Similar to A PROPOSED APPROACH TO ANALYTICAL METHOD LONG-TERM STABILITY ASSESSMENT (20)
More from Fernando Berlitz
More from Fernando Berlitz (12)
Recently uploaded
Recently uploaded (20)
A PROPOSED APPROACH TO ANALYTICAL METHOD LONG-TERM STABILITY ASSESSMENT
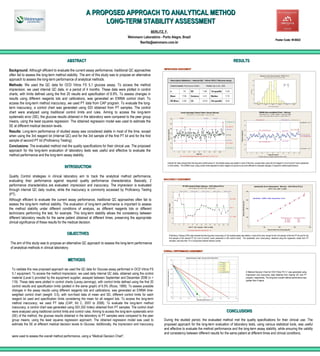
- 1. A PROPOSED APPROACH TO ANALYTICAL METHOD LONG-TERM STABILITY ASSESSMENT BERLITZ, F. Weinmann Laboratório - Porto Alegre, Brazil Poster Code: W-B022 fberlitz@weinmann.com.br ABSTRACT RESULTS IMPRECISION ASSESSMENT Background: Although efficient to evaluate the current assay performance, traditional QC approaches often fail to assess the long-term method stability. The aim of this study was to propose an alternative approach to assess the long-term performance of analytical methods. Methods: We used the QC data for OCD Vitros FS 5,1 glucose assay. To access the method imprecision, we used internal QC data, in a period of 4 months. These data were plotted in control charts, with limits defined using the first 20 results and specification of 6.9%. To assess changes in results using different reagents lots and calibrations, was generated an EWMA control chart. To access the long-term method inaccuracy, we used PT data from CAP program. To evaluate the long- term inaccuracy, a control chart was generated using SDI obtained from PT samples. The control chart were analyzed using traditional control limits and rules. Aiming to access the long-term systematic error (SE), the glucose results obtained in the laboratory were compared to the peer group means, using the least squares regression. The obtained regression model was used to estimate the SE at different medical decision levels. Results: Long-term performance of studied assay was considered stable in most of the time, except when using the 3rd reagent lot (Internal QC) and for the 3rd sample of the first PT kit and for the first sample of second PT kit (Proficiency Testing). Conclusions: The evaluated method met the quality specifications for their clinical use. The proposed approach for the long-term evaluation of laboratory tests was useful and effective to evaluate the method performance and the long-term assay stability. Internal QC data showed that the long-term performance of the studied assay was stable in most of the time, except when using the 3rd reagent (“out of control” event presented INTRODUCTION in both charts). The EWMA chart, using control limits adjusted for each reagent lot proved to be more efficient to evaluate changes in long-term method performance. Quality Control strategies in clinical laboratory aim to track the analytical method performance, INACCURACY ASSESSMENT evaluating their performance against required quality performance characteristics. Basically, 2 performance characteristics are evaluated: imprecision and inaccuracy. The imprecision is evaluated through internal QC daily routine, while the inaccuracy is commonly accessed by Proficiency Testing (PT). Although efficient to evaluate the current assay performance, traditional QC approaches often fail to assess the long-term method stability. The evaluation of long-term performance is important to assess the method stability under different conditions of analysis, as different reagents lots or different technicians performing the test, for example. This long-term stability allows the consistency between different laboratory results for the same patient obtained at different times, preserving the appropriate clinical significance of these results for the medical decision. OBJECTIVES Proficiency Testing (CAP) data showed that the long-term inaccuracy of the studied assay was stable in most of the time, except for the 3rd sample of the first PT kit and for the first sample of the second PT kit (“out of control” event presented in SDI control chart). The systematic error (inaccuracy), obtained using the regression model from PT samples, was less than 1% in all glucose medical decision points. The aim of this study was to propose an alternative QC approach to assess the long-term performance of analytical methods in clinical laboratory. OVERALL PERFORMANCE ASSESSMENT METHODS To validate this new proposed approach we used the QC data for Glucose assay performed in OCD Vitros FS A Medical Decision Chart for OCD Vitros FS 5,1 was generated using 5,1 equipment. To access the method imprecision, we used daily internal QC data, obtained using the control imprecision and inaccuracy data obtained from Internal QC and PT material (Level I) provided by the equipment supplier, assayed between September and December 2008 (n = program, respectively. The long-term overall method performance was greater than 4-sigma. 119). These data were plotted in control charts (Levey-Jennings), with control limits defined using the first 20 control results and specification limits (plotted in the same graph) of 6.9% (Ricos, 1999). To assess possible changes in the assay results using different reagents lots and calibrations, was generated an EWMA time- weighted control chart (weight: 0.5), with non-fixed data of mean and SD, different control limits for each reagent lot used and specification limits considering the mean for all reagent lots. To access the long-term method inaccuracy, we used PT data (CAP, Kit C, 2007 to 2008). To evaluate the long-term method inaccuracy, a control chart was generated using SDI (SD Index) obtained from PT samples. The control chart were analyzed using traditional control limits and control rules. Aiming to access the long-term systematic error CONCLUSIONS (SE) of the method, the glucose results obtained in the laboratory to PT samples were compared to the peer group means, using the least squares regression approach. The obtained regression model was used to During the studied period, the evaluated method met the quality specifications for their clinical use. The estimate the SE at different medical decision levels to Glucose. Additionally, the imprecision and inaccuracy proposed approach for the long-term evaluation of laboratory tests, using various statistical tools, was useful and effective to evaluate the method performance and the long-term assay stability, while ensuring the validity and consistency between different results for the same patient at different times and clinical conditions. were used to assess the overall method performance, using a “Medical Decision Chart”.