SlideShare a Scribd company logo
1 of 9
Download to read offline
Fall2014ProjectUtilizing temporal diversity in primary motor cortex neuron
populations to aid position detection (by Farid Pashtoon)
In this paper we will examine whether temporal diversity can be utilized in algorithms to
increase performance of the position detection of a monkey’s arm traversing a motion
while recording spikes from the primary motor cortex, possibly applicable to brain
machine interfaces.
Neural spikes were recorded from a monkey using a chronically implanted multi-electrode (96
channel Utah array). During the recording the monkey performed a center-out reach task that
consisted of three phases for each trial. In he first phase, center acquired, the monkey had to
hold its hand at the center of the screen and wait for the onset of a target. The target would
appear only in one of eight directions, namely 0, 45, 90, 135, 180, 225, 270, or 315 degrees. In
the second phase, go cue onset, the monkey would start the motion of its arm. The third phase,
target acquired, is considered to be the traversal of the motion of the monkeys arm in the prior
phase to reaching the target position that was presented. The times were recorded of the go cue
onset, the start of the movement, and the completion of the movement. To visualize the
description of the three phases, refer to Figure 1.
Figure 1. The process of the cue-reaching task as described by (Rao & Donoghue, 2013). In this figure the target
position is purple when not acquired and changes to yellow when the monkey acquires the target.
The following table describes the relevant data that is used in this paper from Dr. Donoghue’s
research group at Brown University in Exploring Neural Data.
Name Description
trial_angle The direction of movement in the eight directions, 0, 45, 90, 135, 180, 225, 270, or 315.
Each trial consists of only one angle direction.
trial_go Time of the go cue signal for each trial.
trial_move Time the monkey began the start of the movement for the trial.
trial_acq Time the money reached the target location to complete the movement for the trial.
spk_times List of arrays of spike times for each neuron that was sampled for the trial.
FP’s Exploring Neural Data Final Project
Fall 2014 ProjectIn this paper we will be concerned only with the start of the movement of the monkey until it
reached the target location. The entire extent of the motion will be considered while the traversal
movement was being recorded and the arm was moving. This extent will allow us to analyze
temporal activity because the motion is occurring over a time interval. But before delving into
the temporal activity let gain some intuition about the activity in the 62 neuron population using
simple averaging statistics and scientific visualizations.
STATIC TIME INTERVALAVERAGING
Figure 2 to the right depicts the average
neuron firing rates of the 62 neurons over the
136 trials that were performed. This is a good
starting point to start Exploring Neural Data.
Each trial has an arbitrary angle assigned for
the motion. They do not occur consecutively.
The first three trials for example have targets
of 270, 135 and 315 degrees in the dataset.
Despite this composition, we certainly can see a
great deal of regularity in the image. There looks
to be good activity in the population firings for neurons 0 to10 and the streak above neuron 50. It
is critical to reiterate that the averaging calculations were performed during the entire sweep of
the arm movement from the start of the move to
reaching the target.
It’s time to add color into the organization. Color
can reveal important changes in magnitude in
the data set. Additionally we haven’t yet
explored the magnitudes of the firing
rates. Figures 3 and 4 should add that
additional component of insight. We
clearly see that neurons 0 to 10 and
around 50 have a greater average firing
rate. 30-40 spikes/sec would be a good
number to attribute to the highest
spiking neurons, on average.
FP’s Exploring Neural Data Final Project
Figure 2. Average neuron firing rates during the
arm sweep from starting the moving to reaching the
target.
Figure 3. Top level color map view of
average firing rates.
Figure 4. Isometric color map view of average
firing rates.
(spikes/sec)
Fall 2014 ProjectWe continue to have much chaos in the plots in the previous page to make sense of the neuron
population.. 17 trials were run for each of the angles. However the trials that are being plotted
have arbitrary position angle targets. For each angle the plots will be modified to place the angles
consecutively to see if we find any visual patterns. Let’s get started on this step of the analysis.
Figure 5 is the same plot as in figure 1 but a color map has been applied. Next to it is figure 6.
The differences between the two plots is that figure 6 has all of the angle trials sorted so that the
17 consecutive trials related to any individual angle are plotted adjacent to one another. The first
17 vertical cross sections are all the neuron firing for angle 0. To see this pattern better, figure 7
shows the strips for each of the angles for comparison to each other. Each of these subplots in
figure 7 show their own
local colors. So the
coloring has changed and
more patterns have
emerged. The reader can
view the plot to look for
unique patterns to identify
each of the angles. One
example, Between neurons
24-28, at angle 315 a green
rectangle is identifiable that
is unique to this angle
alone!
FP’s Exploring Neural Data Final Project
Figure 5. Color map version of average neuron
firing rates in figure 1.
Figure 6. Consecutively placed angles compared
to those shown in figure 5.
Figure 7. Layering of the figure 6 plot into
subplots to identify each angle separately.
0
45
90
135
180
270
225
315
Fall 2014 Project
It is clear from this that patterns emerge that are attributable to set of neurons that are unique to
each angle. However we could question, is this robust? How does it change over time? Will the
same neurons function the same way if the monkey has gone to sleep and the same test applied
one week later? What would happen if the implant were to shift slightly in the brain of the
primate, would not this mechanism of estimating angles from neuron activity fail?
ADD IN TEMPORAL DIVERSITY TO THE MIX
Let’s investigate adding changes in firing rate that the neurons undergo from the time the
monkey started the motion to reaching the target. Can we add time as another dimension so that
we can treat the entire neural population (62 in our case), as a whole cluster. This would allow us
to divert from the idea of investigating individual or small set of neurons in trying to generate the
angle estimates. The goal here is to use the entire population of 62 neurons.
To perform this analysis we will develop a discrete time shifted bin based algorithm that sweeps
time and performs moving average calculations on
all 62 neurons spike time series. The calculations
were performed on 100ms to the right and 100ms to
the left of the time centered point for a total of
200ms. Then the time centered point was shifted
by 10ms and the average taken across the 200ms extent. As these calculations were performed
they were appended to a list and converted to a numpy array to generate a time histogram vector.
Let’s take a look at some of these time histograms.
The time histograms that were
calculated and stored in vectors for
one trial (a single angle motion) are
all plotted in Figure 8. These time
shifted bin based averaging
calculations in time reveal that the
firing rates can range anywhere from
0 to 70 spikes/sec. (This compares
well with 30-40 spikes/sec average
we calculated in the static time
interval section). The neurons all start
with a good deal activity because we
are considering the time from the start
of the motion, not the center acquired
phase mentioned on the first page. So
we would expect that firings have started. After the
target has been reached, the firing decay. Also let’s
note that the zero’s at the end of the waveforms
FP’s Exploring Neural Data Final Project
Figure 8. The legend for this plot represents the
firing rate of individual neurons plotted with their
time histograms across the movement.
Fall2014Project
was zero padding applied to make all trials equal length so the data could be stored in a uniform
matrix structure.
Figure 9 represents the same
data as figure 8, but the data
has been plotted in individual
planes per neuron for better
identification and
visualization.
FP’s Exploring Neural Data Final Project
Figure 9. Temporal neuron firing
rates plotted individually per neuron
in separate plane.
Time evolution of individual neurons
Figure 10. The figure also reflects time revolution. For each neuron the change in firing rate has been
plotted. The legend for this plot would be time intervals. What was the firing rate of a particular neuron as
it evolved in time for the movement of a single trial, a single angle reach.
Fall 2014 ProjectFigure 10 is the key to answering the question this paper addresses. Can neural firings in the
primary motor cortex be used to estimate the angle of reach of a limb in a primate? This
plot is similar to a plot we generated in figure 7. In that figure we partitioned average neural
activity separately to search for patterns that we unique. In Figure 10 we are doing the a similar
construction. We have partitioned temporal variations into angles to search for patterns. Visually
examining the figure the reader can find generalizations that appear for each angle that might
allow for unique identification.
TIME EVOLVED PATTERN RECOGNITION USING MACHINE LEARNING
The motivation for using a machine learning algorithm to search for patterns in the time evolving
patterns in Figure 10 is that the problem is difficult. The combinatorics of the problem are:
To create an algorithm to handle these difficult combinatorics and correlations in the data would
be a very time consuming task. Additionally we only have 136 trials of limited data to generalize
from. To make life easy for us, machine learning is a useful technique.
The machine learning algorithm that will be used
is the Bagged Decision Tree in Matlab. To
prepare the data we will use character recognition
of numerical digits first into the Matlab algorithm
so we understand the functions involved and the
types of data the functions expect. In this type of
a data set the images are 16x16 two dimensional
arrays. However the Matlab fitensemble function
expects the data to be in a row vector for each of
the classifications. So the data in this image is
reshaped to a 256 length row vector. A matrix of
row vectors would be created with all of the trials,
which in this case was 10,000 for training the bagged
decision tree classifier. In addition all of the rows have
know classifications which in this were the numerical digits {0,1,2,3,4,5,6,7,8,9}.
Knowing how the bagged decision tree algorithm expected the data, our time evolving histogram
trains will be partitioned similarly into the algorithm. Labels are created for all 136 trials, namely
{0,45,90,135,180,225,270,315} angles. This is the label matrix of all the trials. The data matrix
FP’s Exploring Neural Data Final Project
Number of angles = 8
Number of trials per angle = 17
Number of total trials = 136 (ie 8*17)
Number of neurons = 62
Number of time histograms = 4832 (ie 8*17*62)
Time extent per neuron = 500ms to 1000ms
Figure 11. Numerical character digits.
Fall 2014 Project
that we construct will be the time evolved histogram vector for all 62 neurons. Just as in the
character recognition problem these will be row matrices. The time histograms of all of the
neurons were concatenated in a single row per trial. So we had 136 rows of all of the time
histograms of all the neurons as the data set into the learning algorithm. The neuron classification
problem was turned into a 2 dimensional problem, just as the image recognition problem was a 2
dimensional problem.
The steps in Matlab to use the Bagged Decision Tree algorithm are as follows.
1. Partition the set into a data matrix X and a classification matrix y. This was described above.
2. Randomly partition the data into training and validation sets.
cv = cvpartition(y, 'holdout', .5);
% training set
Xtrain = X(cv.training,:);
Ytrain = y(cv.training,1);
% test set
Xtest = X(cv.test,:);
Ytest = y(cv.test,1);
3. Train and predict using bagged decision trees.
mdl = fitensemble(Xtrain,Ytrain,'bag',200,'tree','type','Classification');
ypred_bag = predict(mdl,Xtest);
Confmat_bag = confusionmat(Ytest,ypred_bag);
Those are the complete set of steps to use the function. The key is getting the data into a correct
form and understanding the context of the classification problem, as we have learned in the
paper.
Figure 12 shows the that the
performance of the bagged decision
classifier did indeed converge by
exponentially decaying. Utilizing
temporal evolution on the entire
population of 62 neurons without
throwing any out of the mixture to
estimate angles was successful.
The accuracy of the angle estimates
using this approach achieved 84%
correct decisions of angles.
FP’s Exploring Neural Data Final Project
Figure 12. Bagged decision tree classification performance
for the neuron trial position estimates using time evolution
from start of movement to reaching target.
Fall 2014 Project
INTERESTING PROGRAMMING TRICKS
Some interesting programming tricks have been discussed already in the paper.
1. The discrete time shifting bin algorithm has been discussed.
2. Creating data in uniform matrices that could be stored in matlab data files has been discussed.
3. Calling the Bagged Decision Tree algorithm in Matlab and the procedure for doing can be
referred to above.
4. The transformation of Python data structures is described in the next section.
PROBLEMS ENCOUNTERED
The main problem that was encountered was how to manage the data and all of the calculations
and store them in python data structures that were used to create the plots for this paper.
Additionally the storage of this data had to be preserved to eventually store to files for use in
matlab.
This problem was solved by creating a side dictionary database that mapped the original data set
provided by Dr. Donoghue’s to one that indexed all of the data on a trial basis. The original data
set stored all the data arrays. The transformed database dictionary that was created to code this
project created an array of dictionaries per trial.
For example to access the trial_go time for trial 0, the following syntax could be used,
trials_database_vec[0]['go']. To access all of the time histograms, the follownig command is
issued, trials_database_vec[trials_0_indices[0]]['neurons_time_histograms_vec']. This last
example allowed the plotting of Figure 10 in one single command, rather that iterating for each
plot.
FOLLOW UPANALYSIS
Currently the approach used in this paper can achieve an 84% correct decision accuracy of
angles. Can this performance be improved? Because data from all 62 neurons in the population
are used, mainly to examine the temporal diversity question, can some of these neurons be
dropped from the set? Will that improve performance because they are acting as noise sources
into the classification algorithm. One proposal to making the data set more sparse prior to
running the machine learning algorithm is to rank the neurons with the highest average firing
rates. Choose the top 23, for example, and throw away the data from all the other lower firing
rate neurons.
Also given that we had performed population averaging analysis, could a hybrid approach be
created. We analyzed both the temporal data histograms and on the patterns we discussed using
average firing rates. In both cases visual patterns developed from which we gained insight.
Would it be possible to run both data sets into either combined or parallel classifiers to increase
the performance of detecting the target angles.
FP’s Exploring Neural Data Final Project
BIBLIOGRAPHY
1. Rao, N. G., & Donoghue, J. P. (2014). Cue to action processing in motor cortex populations.
Journal of Neurophysiology, 111(2), 441–53. doi:10.1152/jn.00274.2013, Brown University
2. Prof. Mark Churchland, Columbia University
http://thesciencenetwork.org/programs/tdlc-all-hands-meeting-2013/the-neural-dynamics-of-
movement-generation
Fall 2014 Project
FP’s Exploring Neural Data Final Project

More Related Content

Viewers also liked (6)

Animales ingeniosos
Animales ingeniososAnimales ingeniosos
Animales ingeniosos
 
Respiration
Respiration Respiration
Respiration
 
Tues_2_1105_Gal
Tues_2_1105_GalTues_2_1105_Gal
Tues_2_1105_Gal
 
Monetary policy and_gdp
Monetary policy and_gdpMonetary policy and_gdp
Monetary policy and_gdp
 
Леонардо да Винчи
Леонардо да ВинчиЛеонардо да Винчи
Леонардо да Винчи
 
Shih Wei Chieh-Year of light
Shih Wei Chieh-Year of lightShih Wei Chieh-Year of light
Shih Wei Chieh-Year of light
 

Similar to ExploringNeuralData_DiscussionGroup_FinalProject

Object Tracking using Artificial Neural Network
Object Tracking using Artificial Neural NetworkObject Tracking using Artificial Neural Network
Object Tracking using Artificial Neural NetworkAnwar Jameel
 
Summary Of Thesis
Summary Of ThesisSummary Of Thesis
Summary Of Thesisguestb452d6
 
Christopher Johnson Bachelor's Thesis
Christopher Johnson Bachelor's ThesisChristopher Johnson Bachelor's Thesis
Christopher Johnson Bachelor's ThesisBagpipesJohnson
 
Final report wearable haptics
Final report   wearable hapticsFinal report   wearable haptics
Final report wearable hapticsApurva Gupta
 
JAKBOS.COM | Nonton Film Online, Streaming Movie Indonesia
JAKBOS.COM | Nonton Film Online, Streaming Movie IndonesiaJAKBOS.COM | Nonton Film Online, Streaming Movie Indonesia
JAKBOS.COM | Nonton Film Online, Streaming Movie Indonesiajakbos
 
NeurSciACone
NeurSciAConeNeurSciACone
NeurSciAConeAdam Cone
 
A Novel Single-Trial Analysis Scheme for Characterizing the Presaccadic Brain...
A Novel Single-Trial Analysis Scheme for Characterizing the Presaccadic Brain...A Novel Single-Trial Analysis Scheme for Characterizing the Presaccadic Brain...
A Novel Single-Trial Analysis Scheme for Characterizing the Presaccadic Brain...konmpoz
 
Poster RITS motion_correction
Poster RITS motion_correctionPoster RITS motion_correction
Poster RITS motion_correctionRania BERRADA
 
Sensorimotor Network Development During Early Postnatal Life in the Awake and...
Sensorimotor Network Development During Early Postnatal Life in the Awake and...Sensorimotor Network Development During Early Postnatal Life in the Awake and...
Sensorimotor Network Development During Early Postnatal Life in the Awake and...InsideScientific
 
poster_2015_Diener
poster_2015_Dienerposter_2015_Diener
poster_2015_DienerZach Diener
 
Wavelet-based EEG processing for computer-aided seizure detection and epileps...
Wavelet-based EEG processing for computer-aided seizure detection and epileps...Wavelet-based EEG processing for computer-aided seizure detection and epileps...
Wavelet-based EEG processing for computer-aided seizure detection and epileps...IJERA Editor
 
1-s2.0-S0960982214014274-main
1-s2.0-S0960982214014274-main1-s2.0-S0960982214014274-main
1-s2.0-S0960982214014274-mainAmy Jolly
 
Neuron based time optimal controller of horizontal saccadic eye movements
Neuron based time optimal controller of horizontal saccadic eye movementsNeuron based time optimal controller of horizontal saccadic eye movements
Neuron based time optimal controller of horizontal saccadic eye movementsAlireza Ghahari
 
Spike timing dependent plasticity to make robot navigation more intelligent. ...
Spike timing dependent plasticity to make robot navigation more intelligent. ...Spike timing dependent plasticity to make robot navigation more intelligent. ...
Spike timing dependent plasticity to make robot navigation more intelligent. ...Lietuvos kompiuterininkų sąjunga
 

Similar to ExploringNeuralData_DiscussionGroup_FinalProject (20)

Object Tracking using Artificial Neural Network
Object Tracking using Artificial Neural NetworkObject Tracking using Artificial Neural Network
Object Tracking using Artificial Neural Network
 
Summary Of Thesis
Summary Of ThesisSummary Of Thesis
Summary Of Thesis
 
Christopher Johnson Bachelor's Thesis
Christopher Johnson Bachelor's ThesisChristopher Johnson Bachelor's Thesis
Christopher Johnson Bachelor's Thesis
 
Final report wearable haptics
Final report   wearable hapticsFinal report   wearable haptics
Final report wearable haptics
 
JAKBOS.COM | Nonton Film Online, Streaming Movie Indonesia
JAKBOS.COM | Nonton Film Online, Streaming Movie IndonesiaJAKBOS.COM | Nonton Film Online, Streaming Movie Indonesia
JAKBOS.COM | Nonton Film Online, Streaming Movie Indonesia
 
Thesis
ThesisThesis
Thesis
 
189084.full
189084.full189084.full
189084.full
 
Bx36449453
Bx36449453Bx36449453
Bx36449453
 
Neural Networks
Neural NetworksNeural Networks
Neural Networks
 
NeurSciACone
NeurSciAConeNeurSciACone
NeurSciACone
 
Reflex Arc Lab
Reflex Arc LabReflex Arc Lab
Reflex Arc Lab
 
A Novel Single-Trial Analysis Scheme for Characterizing the Presaccadic Brain...
A Novel Single-Trial Analysis Scheme for Characterizing the Presaccadic Brain...A Novel Single-Trial Analysis Scheme for Characterizing the Presaccadic Brain...
A Novel Single-Trial Analysis Scheme for Characterizing the Presaccadic Brain...
 
Poster RITS motion_correction
Poster RITS motion_correctionPoster RITS motion_correction
Poster RITS motion_correction
 
Sensorimotor Network Development During Early Postnatal Life in the Awake and...
Sensorimotor Network Development During Early Postnatal Life in the Awake and...Sensorimotor Network Development During Early Postnatal Life in the Awake and...
Sensorimotor Network Development During Early Postnatal Life in the Awake and...
 
poster_2015_Diener
poster_2015_Dienerposter_2015_Diener
poster_2015_Diener
 
Wavelet-based EEG processing for computer-aided seizure detection and epileps...
Wavelet-based EEG processing for computer-aided seizure detection and epileps...Wavelet-based EEG processing for computer-aided seizure detection and epileps...
Wavelet-based EEG processing for computer-aided seizure detection and epileps...
 
1-s2.0-S0960982214014274-main
1-s2.0-S0960982214014274-main1-s2.0-S0960982214014274-main
1-s2.0-S0960982214014274-main
 
Neuron based time optimal controller of horizontal saccadic eye movements
Neuron based time optimal controller of horizontal saccadic eye movementsNeuron based time optimal controller of horizontal saccadic eye movements
Neuron based time optimal controller of horizontal saccadic eye movements
 
NCP_Thesis_Francesca_Bocca.pdf
NCP_Thesis_Francesca_Bocca.pdfNCP_Thesis_Francesca_Bocca.pdf
NCP_Thesis_Francesca_Bocca.pdf
 
Spike timing dependent plasticity to make robot navigation more intelligent. ...
Spike timing dependent plasticity to make robot navigation more intelligent. ...Spike timing dependent plasticity to make robot navigation more intelligent. ...
Spike timing dependent plasticity to make robot navigation more intelligent. ...
 

Recently uploaded

Stunning ➥8448380779▻ Call Girls In Panchshil Enclave Delhi NCR
Stunning ➥8448380779▻ Call Girls In Panchshil Enclave Delhi NCRStunning ➥8448380779▻ Call Girls In Panchshil Enclave Delhi NCR
Stunning ➥8448380779▻ Call Girls In Panchshil Enclave Delhi NCRDelhi Call girls
 
Lucknow 💋 Russian Call Girls Lucknow Finest Escorts Service 8923113531 Availa...
Lucknow 💋 Russian Call Girls Lucknow Finest Escorts Service 8923113531 Availa...Lucknow 💋 Russian Call Girls Lucknow Finest Escorts Service 8923113531 Availa...
Lucknow 💋 Russian Call Girls Lucknow Finest Escorts Service 8923113531 Availa...anilsa9823
 
Cultivation of KODO MILLET . made by Ghanshyam pptx
Cultivation of KODO MILLET . made by Ghanshyam pptxCultivation of KODO MILLET . made by Ghanshyam pptx
Cultivation of KODO MILLET . made by Ghanshyam pptxpradhanghanshyam7136
 
Unlocking the Potential: Deep dive into ocean of Ceramic Magnets.pptx
Unlocking  the Potential: Deep dive into ocean of Ceramic Magnets.pptxUnlocking  the Potential: Deep dive into ocean of Ceramic Magnets.pptx
Unlocking the Potential: Deep dive into ocean of Ceramic Magnets.pptxanandsmhk
 
Biological Classification BioHack (3).pdf
Biological Classification BioHack (3).pdfBiological Classification BioHack (3).pdf
Biological Classification BioHack (3).pdfmuntazimhurra
 
Formation of low mass protostars and their circumstellar disks
Formation of low mass protostars and their circumstellar disksFormation of low mass protostars and their circumstellar disks
Formation of low mass protostars and their circumstellar disksSérgio Sacani
 
Pests of cotton_Sucking_Pests_Dr.UPR.pdf
Pests of cotton_Sucking_Pests_Dr.UPR.pdfPests of cotton_Sucking_Pests_Dr.UPR.pdf
Pests of cotton_Sucking_Pests_Dr.UPR.pdfPirithiRaju
 
Recombinant DNA technology (Immunological screening)
Recombinant DNA technology (Immunological screening)Recombinant DNA technology (Immunological screening)
Recombinant DNA technology (Immunological screening)PraveenaKalaiselvan1
 
Broad bean, Lima Bean, Jack bean, Ullucus.pptx
Broad bean, Lima Bean, Jack bean, Ullucus.pptxBroad bean, Lima Bean, Jack bean, Ullucus.pptx
Broad bean, Lima Bean, Jack bean, Ullucus.pptxjana861314
 
Nanoparticles synthesis and characterization​ ​
Nanoparticles synthesis and characterization​  ​Nanoparticles synthesis and characterization​  ​
Nanoparticles synthesis and characterization​ ​kaibalyasahoo82800
 
Grafana in space: Monitoring Japan's SLIM moon lander in real time
Grafana in space: Monitoring Japan's SLIM moon lander  in real timeGrafana in space: Monitoring Japan's SLIM moon lander  in real time
Grafana in space: Monitoring Japan's SLIM moon lander in real timeSatoshi NAKAHIRA
 
Labelling Requirements and Label Claims for Dietary Supplements and Recommend...
Labelling Requirements and Label Claims for Dietary Supplements and Recommend...Labelling Requirements and Label Claims for Dietary Supplements and Recommend...
Labelling Requirements and Label Claims for Dietary Supplements and Recommend...Lokesh Kothari
 
Green chemistry and Sustainable development.pptx
Green chemistry  and Sustainable development.pptxGreen chemistry  and Sustainable development.pptx
Green chemistry and Sustainable development.pptxRajatChauhan518211
 
PossibleEoarcheanRecordsoftheGeomagneticFieldPreservedintheIsuaSupracrustalBe...
PossibleEoarcheanRecordsoftheGeomagneticFieldPreservedintheIsuaSupracrustalBe...PossibleEoarcheanRecordsoftheGeomagneticFieldPreservedintheIsuaSupracrustalBe...
PossibleEoarcheanRecordsoftheGeomagneticFieldPreservedintheIsuaSupracrustalBe...Sérgio Sacani
 
TEST BANK For Radiologic Science for Technologists, 12th Edition by Stewart C...
TEST BANK For Radiologic Science for Technologists, 12th Edition by Stewart C...TEST BANK For Radiologic Science for Technologists, 12th Edition by Stewart C...
TEST BANK For Radiologic Science for Technologists, 12th Edition by Stewart C...ssifa0344
 
GFP in rDNA Technology (Biotechnology).pptx
GFP in rDNA Technology (Biotechnology).pptxGFP in rDNA Technology (Biotechnology).pptx
GFP in rDNA Technology (Biotechnology).pptxAleenaTreesaSaji
 
Is RISC-V ready for HPC workload? Maybe?
Is RISC-V ready for HPC workload? Maybe?Is RISC-V ready for HPC workload? Maybe?
Is RISC-V ready for HPC workload? Maybe?Patrick Diehl
 
Spermiogenesis or Spermateleosis or metamorphosis of spermatid
Spermiogenesis or Spermateleosis or metamorphosis of spermatidSpermiogenesis or Spermateleosis or metamorphosis of spermatid
Spermiogenesis or Spermateleosis or metamorphosis of spermatidSarthak Sekhar Mondal
 
Discovery of an Accretion Streamer and a Slow Wide-angle Outflow around FUOri...
Discovery of an Accretion Streamer and a Slow Wide-angle Outflow around FUOri...Discovery of an Accretion Streamer and a Slow Wide-angle Outflow around FUOri...
Discovery of an Accretion Streamer and a Slow Wide-angle Outflow around FUOri...Sérgio Sacani
 

Recently uploaded (20)

Stunning ➥8448380779▻ Call Girls In Panchshil Enclave Delhi NCR
Stunning ➥8448380779▻ Call Girls In Panchshil Enclave Delhi NCRStunning ➥8448380779▻ Call Girls In Panchshil Enclave Delhi NCR
Stunning ➥8448380779▻ Call Girls In Panchshil Enclave Delhi NCR
 
Lucknow 💋 Russian Call Girls Lucknow Finest Escorts Service 8923113531 Availa...
Lucknow 💋 Russian Call Girls Lucknow Finest Escorts Service 8923113531 Availa...Lucknow 💋 Russian Call Girls Lucknow Finest Escorts Service 8923113531 Availa...
Lucknow 💋 Russian Call Girls Lucknow Finest Escorts Service 8923113531 Availa...
 
Cultivation of KODO MILLET . made by Ghanshyam pptx
Cultivation of KODO MILLET . made by Ghanshyam pptxCultivation of KODO MILLET . made by Ghanshyam pptx
Cultivation of KODO MILLET . made by Ghanshyam pptx
 
Unlocking the Potential: Deep dive into ocean of Ceramic Magnets.pptx
Unlocking  the Potential: Deep dive into ocean of Ceramic Magnets.pptxUnlocking  the Potential: Deep dive into ocean of Ceramic Magnets.pptx
Unlocking the Potential: Deep dive into ocean of Ceramic Magnets.pptx
 
Biological Classification BioHack (3).pdf
Biological Classification BioHack (3).pdfBiological Classification BioHack (3).pdf
Biological Classification BioHack (3).pdf
 
Formation of low mass protostars and their circumstellar disks
Formation of low mass protostars and their circumstellar disksFormation of low mass protostars and their circumstellar disks
Formation of low mass protostars and their circumstellar disks
 
Pests of cotton_Sucking_Pests_Dr.UPR.pdf
Pests of cotton_Sucking_Pests_Dr.UPR.pdfPests of cotton_Sucking_Pests_Dr.UPR.pdf
Pests of cotton_Sucking_Pests_Dr.UPR.pdf
 
Recombinant DNA technology (Immunological screening)
Recombinant DNA technology (Immunological screening)Recombinant DNA technology (Immunological screening)
Recombinant DNA technology (Immunological screening)
 
Broad bean, Lima Bean, Jack bean, Ullucus.pptx
Broad bean, Lima Bean, Jack bean, Ullucus.pptxBroad bean, Lima Bean, Jack bean, Ullucus.pptx
Broad bean, Lima Bean, Jack bean, Ullucus.pptx
 
Nanoparticles synthesis and characterization​ ​
Nanoparticles synthesis and characterization​  ​Nanoparticles synthesis and characterization​  ​
Nanoparticles synthesis and characterization​ ​
 
Grafana in space: Monitoring Japan's SLIM moon lander in real time
Grafana in space: Monitoring Japan's SLIM moon lander  in real timeGrafana in space: Monitoring Japan's SLIM moon lander  in real time
Grafana in space: Monitoring Japan's SLIM moon lander in real time
 
Labelling Requirements and Label Claims for Dietary Supplements and Recommend...
Labelling Requirements and Label Claims for Dietary Supplements and Recommend...Labelling Requirements and Label Claims for Dietary Supplements and Recommend...
Labelling Requirements and Label Claims for Dietary Supplements and Recommend...
 
Green chemistry and Sustainable development.pptx
Green chemistry  and Sustainable development.pptxGreen chemistry  and Sustainable development.pptx
Green chemistry and Sustainable development.pptx
 
PossibleEoarcheanRecordsoftheGeomagneticFieldPreservedintheIsuaSupracrustalBe...
PossibleEoarcheanRecordsoftheGeomagneticFieldPreservedintheIsuaSupracrustalBe...PossibleEoarcheanRecordsoftheGeomagneticFieldPreservedintheIsuaSupracrustalBe...
PossibleEoarcheanRecordsoftheGeomagneticFieldPreservedintheIsuaSupracrustalBe...
 
The Philosophy of Science
The Philosophy of ScienceThe Philosophy of Science
The Philosophy of Science
 
TEST BANK For Radiologic Science for Technologists, 12th Edition by Stewart C...
TEST BANK For Radiologic Science for Technologists, 12th Edition by Stewart C...TEST BANK For Radiologic Science for Technologists, 12th Edition by Stewart C...
TEST BANK For Radiologic Science for Technologists, 12th Edition by Stewart C...
 
GFP in rDNA Technology (Biotechnology).pptx
GFP in rDNA Technology (Biotechnology).pptxGFP in rDNA Technology (Biotechnology).pptx
GFP in rDNA Technology (Biotechnology).pptx
 
Is RISC-V ready for HPC workload? Maybe?
Is RISC-V ready for HPC workload? Maybe?Is RISC-V ready for HPC workload? Maybe?
Is RISC-V ready for HPC workload? Maybe?
 
Spermiogenesis or Spermateleosis or metamorphosis of spermatid
Spermiogenesis or Spermateleosis or metamorphosis of spermatidSpermiogenesis or Spermateleosis or metamorphosis of spermatid
Spermiogenesis or Spermateleosis or metamorphosis of spermatid
 
Discovery of an Accretion Streamer and a Slow Wide-angle Outflow around FUOri...
Discovery of an Accretion Streamer and a Slow Wide-angle Outflow around FUOri...Discovery of an Accretion Streamer and a Slow Wide-angle Outflow around FUOri...
Discovery of an Accretion Streamer and a Slow Wide-angle Outflow around FUOri...
 

ExploringNeuralData_DiscussionGroup_FinalProject

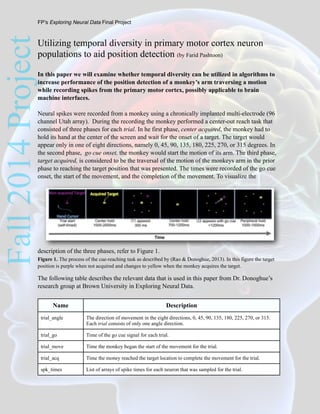
  • 1. Fall2014ProjectUtilizing temporal diversity in primary motor cortex neuron populations to aid position detection (by Farid Pashtoon) In this paper we will examine whether temporal diversity can be utilized in algorithms to increase performance of the position detection of a monkey’s arm traversing a motion while recording spikes from the primary motor cortex, possibly applicable to brain machine interfaces. Neural spikes were recorded from a monkey using a chronically implanted multi-electrode (96 channel Utah array). During the recording the monkey performed a center-out reach task that consisted of three phases for each trial. In he first phase, center acquired, the monkey had to hold its hand at the center of the screen and wait for the onset of a target. The target would appear only in one of eight directions, namely 0, 45, 90, 135, 180, 225, 270, or 315 degrees. In the second phase, go cue onset, the monkey would start the motion of its arm. The third phase, target acquired, is considered to be the traversal of the motion of the monkeys arm in the prior phase to reaching the target position that was presented. The times were recorded of the go cue onset, the start of the movement, and the completion of the movement. To visualize the description of the three phases, refer to Figure 1. Figure 1. The process of the cue-reaching task as described by (Rao & Donoghue, 2013). In this figure the target position is purple when not acquired and changes to yellow when the monkey acquires the target. The following table describes the relevant data that is used in this paper from Dr. Donoghue’s research group at Brown University in Exploring Neural Data. Name Description trial_angle The direction of movement in the eight directions, 0, 45, 90, 135, 180, 225, 270, or 315. Each trial consists of only one angle direction. trial_go Time of the go cue signal for each trial. trial_move Time the monkey began the start of the movement for the trial. trial_acq Time the money reached the target location to complete the movement for the trial. spk_times List of arrays of spike times for each neuron that was sampled for the trial. FP’s Exploring Neural Data Final Project
  • 2. Fall 2014 ProjectIn this paper we will be concerned only with the start of the movement of the monkey until it reached the target location. The entire extent of the motion will be considered while the traversal movement was being recorded and the arm was moving. This extent will allow us to analyze temporal activity because the motion is occurring over a time interval. But before delving into the temporal activity let gain some intuition about the activity in the 62 neuron population using simple averaging statistics and scientific visualizations. STATIC TIME INTERVALAVERAGING Figure 2 to the right depicts the average neuron firing rates of the 62 neurons over the 136 trials that were performed. This is a good starting point to start Exploring Neural Data. Each trial has an arbitrary angle assigned for the motion. They do not occur consecutively. The first three trials for example have targets of 270, 135 and 315 degrees in the dataset. Despite this composition, we certainly can see a great deal of regularity in the image. There looks to be good activity in the population firings for neurons 0 to10 and the streak above neuron 50. It is critical to reiterate that the averaging calculations were performed during the entire sweep of the arm movement from the start of the move to reaching the target. It’s time to add color into the organization. Color can reveal important changes in magnitude in the data set. Additionally we haven’t yet explored the magnitudes of the firing rates. Figures 3 and 4 should add that additional component of insight. We clearly see that neurons 0 to 10 and around 50 have a greater average firing rate. 30-40 spikes/sec would be a good number to attribute to the highest spiking neurons, on average. FP’s Exploring Neural Data Final Project Figure 2. Average neuron firing rates during the arm sweep from starting the moving to reaching the target. Figure 3. Top level color map view of average firing rates. Figure 4. Isometric color map view of average firing rates. (spikes/sec)
  • 3. Fall 2014 ProjectWe continue to have much chaos in the plots in the previous page to make sense of the neuron population.. 17 trials were run for each of the angles. However the trials that are being plotted have arbitrary position angle targets. For each angle the plots will be modified to place the angles consecutively to see if we find any visual patterns. Let’s get started on this step of the analysis. Figure 5 is the same plot as in figure 1 but a color map has been applied. Next to it is figure 6. The differences between the two plots is that figure 6 has all of the angle trials sorted so that the 17 consecutive trials related to any individual angle are plotted adjacent to one another. The first 17 vertical cross sections are all the neuron firing for angle 0. To see this pattern better, figure 7 shows the strips for each of the angles for comparison to each other. Each of these subplots in figure 7 show their own local colors. So the coloring has changed and more patterns have emerged. The reader can view the plot to look for unique patterns to identify each of the angles. One example, Between neurons 24-28, at angle 315 a green rectangle is identifiable that is unique to this angle alone! FP’s Exploring Neural Data Final Project Figure 5. Color map version of average neuron firing rates in figure 1. Figure 6. Consecutively placed angles compared to those shown in figure 5. Figure 7. Layering of the figure 6 plot into subplots to identify each angle separately. 0 45 90 135 180 270 225 315
  • 4. Fall 2014 Project It is clear from this that patterns emerge that are attributable to set of neurons that are unique to each angle. However we could question, is this robust? How does it change over time? Will the same neurons function the same way if the monkey has gone to sleep and the same test applied one week later? What would happen if the implant were to shift slightly in the brain of the primate, would not this mechanism of estimating angles from neuron activity fail? ADD IN TEMPORAL DIVERSITY TO THE MIX Let’s investigate adding changes in firing rate that the neurons undergo from the time the monkey started the motion to reaching the target. Can we add time as another dimension so that we can treat the entire neural population (62 in our case), as a whole cluster. This would allow us to divert from the idea of investigating individual or small set of neurons in trying to generate the angle estimates. The goal here is to use the entire population of 62 neurons. To perform this analysis we will develop a discrete time shifted bin based algorithm that sweeps time and performs moving average calculations on all 62 neurons spike time series. The calculations were performed on 100ms to the right and 100ms to the left of the time centered point for a total of 200ms. Then the time centered point was shifted by 10ms and the average taken across the 200ms extent. As these calculations were performed they were appended to a list and converted to a numpy array to generate a time histogram vector. Let’s take a look at some of these time histograms. The time histograms that were calculated and stored in vectors for one trial (a single angle motion) are all plotted in Figure 8. These time shifted bin based averaging calculations in time reveal that the firing rates can range anywhere from 0 to 70 spikes/sec. (This compares well with 30-40 spikes/sec average we calculated in the static time interval section). The neurons all start with a good deal activity because we are considering the time from the start of the motion, not the center acquired phase mentioned on the first page. So we would expect that firings have started. After the target has been reached, the firing decay. Also let’s note that the zero’s at the end of the waveforms FP’s Exploring Neural Data Final Project Figure 8. The legend for this plot represents the firing rate of individual neurons plotted with their time histograms across the movement.
  • 5. Fall2014Project was zero padding applied to make all trials equal length so the data could be stored in a uniform matrix structure. Figure 9 represents the same data as figure 8, but the data has been plotted in individual planes per neuron for better identification and visualization. FP’s Exploring Neural Data Final Project Figure 9. Temporal neuron firing rates plotted individually per neuron in separate plane. Time evolution of individual neurons Figure 10. The figure also reflects time revolution. For each neuron the change in firing rate has been plotted. The legend for this plot would be time intervals. What was the firing rate of a particular neuron as it evolved in time for the movement of a single trial, a single angle reach.
  • 6. Fall 2014 ProjectFigure 10 is the key to answering the question this paper addresses. Can neural firings in the primary motor cortex be used to estimate the angle of reach of a limb in a primate? This plot is similar to a plot we generated in figure 7. In that figure we partitioned average neural activity separately to search for patterns that we unique. In Figure 10 we are doing the a similar construction. We have partitioned temporal variations into angles to search for patterns. Visually examining the figure the reader can find generalizations that appear for each angle that might allow for unique identification. TIME EVOLVED PATTERN RECOGNITION USING MACHINE LEARNING The motivation for using a machine learning algorithm to search for patterns in the time evolving patterns in Figure 10 is that the problem is difficult. The combinatorics of the problem are: To create an algorithm to handle these difficult combinatorics and correlations in the data would be a very time consuming task. Additionally we only have 136 trials of limited data to generalize from. To make life easy for us, machine learning is a useful technique. The machine learning algorithm that will be used is the Bagged Decision Tree in Matlab. To prepare the data we will use character recognition of numerical digits first into the Matlab algorithm so we understand the functions involved and the types of data the functions expect. In this type of a data set the images are 16x16 two dimensional arrays. However the Matlab fitensemble function expects the data to be in a row vector for each of the classifications. So the data in this image is reshaped to a 256 length row vector. A matrix of row vectors would be created with all of the trials, which in this case was 10,000 for training the bagged decision tree classifier. In addition all of the rows have know classifications which in this were the numerical digits {0,1,2,3,4,5,6,7,8,9}. Knowing how the bagged decision tree algorithm expected the data, our time evolving histogram trains will be partitioned similarly into the algorithm. Labels are created for all 136 trials, namely {0,45,90,135,180,225,270,315} angles. This is the label matrix of all the trials. The data matrix FP’s Exploring Neural Data Final Project Number of angles = 8 Number of trials per angle = 17 Number of total trials = 136 (ie 8*17) Number of neurons = 62 Number of time histograms = 4832 (ie 8*17*62) Time extent per neuron = 500ms to 1000ms Figure 11. Numerical character digits.
  • 7. Fall 2014 Project that we construct will be the time evolved histogram vector for all 62 neurons. Just as in the character recognition problem these will be row matrices. The time histograms of all of the neurons were concatenated in a single row per trial. So we had 136 rows of all of the time histograms of all the neurons as the data set into the learning algorithm. The neuron classification problem was turned into a 2 dimensional problem, just as the image recognition problem was a 2 dimensional problem. The steps in Matlab to use the Bagged Decision Tree algorithm are as follows. 1. Partition the set into a data matrix X and a classification matrix y. This was described above. 2. Randomly partition the data into training and validation sets. cv = cvpartition(y, 'holdout', .5); % training set Xtrain = X(cv.training,:); Ytrain = y(cv.training,1); % test set Xtest = X(cv.test,:); Ytest = y(cv.test,1); 3. Train and predict using bagged decision trees. mdl = fitensemble(Xtrain,Ytrain,'bag',200,'tree','type','Classification'); ypred_bag = predict(mdl,Xtest); Confmat_bag = confusionmat(Ytest,ypred_bag); Those are the complete set of steps to use the function. The key is getting the data into a correct form and understanding the context of the classification problem, as we have learned in the paper. Figure 12 shows the that the performance of the bagged decision classifier did indeed converge by exponentially decaying. Utilizing temporal evolution on the entire population of 62 neurons without throwing any out of the mixture to estimate angles was successful. The accuracy of the angle estimates using this approach achieved 84% correct decisions of angles. FP’s Exploring Neural Data Final Project Figure 12. Bagged decision tree classification performance for the neuron trial position estimates using time evolution from start of movement to reaching target.
  • 8. Fall 2014 Project INTERESTING PROGRAMMING TRICKS Some interesting programming tricks have been discussed already in the paper. 1. The discrete time shifting bin algorithm has been discussed. 2. Creating data in uniform matrices that could be stored in matlab data files has been discussed. 3. Calling the Bagged Decision Tree algorithm in Matlab and the procedure for doing can be referred to above. 4. The transformation of Python data structures is described in the next section. PROBLEMS ENCOUNTERED The main problem that was encountered was how to manage the data and all of the calculations and store them in python data structures that were used to create the plots for this paper. Additionally the storage of this data had to be preserved to eventually store to files for use in matlab. This problem was solved by creating a side dictionary database that mapped the original data set provided by Dr. Donoghue’s to one that indexed all of the data on a trial basis. The original data set stored all the data arrays. The transformed database dictionary that was created to code this project created an array of dictionaries per trial. For example to access the trial_go time for trial 0, the following syntax could be used, trials_database_vec[0]['go']. To access all of the time histograms, the follownig command is issued, trials_database_vec[trials_0_indices[0]]['neurons_time_histograms_vec']. This last example allowed the plotting of Figure 10 in one single command, rather that iterating for each plot. FOLLOW UPANALYSIS Currently the approach used in this paper can achieve an 84% correct decision accuracy of angles. Can this performance be improved? Because data from all 62 neurons in the population are used, mainly to examine the temporal diversity question, can some of these neurons be dropped from the set? Will that improve performance because they are acting as noise sources into the classification algorithm. One proposal to making the data set more sparse prior to running the machine learning algorithm is to rank the neurons with the highest average firing rates. Choose the top 23, for example, and throw away the data from all the other lower firing rate neurons. Also given that we had performed population averaging analysis, could a hybrid approach be created. We analyzed both the temporal data histograms and on the patterns we discussed using average firing rates. In both cases visual patterns developed from which we gained insight. Would it be possible to run both data sets into either combined or parallel classifiers to increase the performance of detecting the target angles. FP’s Exploring Neural Data Final Project
  • 9. BIBLIOGRAPHY 1. Rao, N. G., & Donoghue, J. P. (2014). Cue to action processing in motor cortex populations. Journal of Neurophysiology, 111(2), 441–53. doi:10.1152/jn.00274.2013, Brown University 2. Prof. Mark Churchland, Columbia University http://thesciencenetwork.org/programs/tdlc-all-hands-meeting-2013/the-neural-dynamics-of- movement-generation Fall 2014 Project FP’s Exploring Neural Data Final Project