SlideShare a Scribd company logo
1 of 29
Download to read offline
A CONTENT ANALYSIS OF SELECTED JOURNAL PAPERS
(Elsevier Publishers as a Case Study)
FALAIYE Mayowa Williams
TP13/14/H/1016
Department of Computer Science and Engineering Obafemi Awolowo University, Ile-Ife, Osun
State, Nigeria
Email: mayoasia@yahoo.com / mayowa.w.falaiye@gmail.com
Abstract
To publish a good paper it must comply with a standard for checking parameters of a good journal
with has to do with the five important sections of the paper (title, abstract, introduction,
methodology, results and discussions) to ascertain its standardization. Content analysis is the
process of collecting data from a published paper using an evaluation criterion and analyzing the
data with a view of identifying certain characteristics present within the paper. This paper is aimed
at collecting data from five parts of a research paper and using this data to describe the papers and
make sound judgments on the contents of the paper. 25 articles collected from Elsevier publishers
were analyzed using a content analysis matrix table provided in a research methodology course
using tables, graphs and charts. The results of the analysis were presented – most of the papers
lacked most of the expected units of each section especially in paper introduction, methodology and
results. The ability of authors to present the findings of their study in a clearly defined form will
help present better to acceptance of the standard of paper in a study.
Keywords: content analysis, research methodology, journal.
INTRODUCTION
Content analysis is indigenous to communication research and is potentially one of the most
important research techniques in the social sciences. It seeks to analyze data within a specific
context in view of the meanings someone- a group or a culture-attribute to them (Kippendorff,
1980). Content analysis is a set of procedures for collecting and organizing information in a
standardized format that allows analysts to make inferences about the characteristics and meaning
of written and other recorded material (Kippendorff, 1980). As the number of articles and papers
published by authors increase; the accessibility of papers is important and this has made content
analysis useful in making numerical comparison among and within such documents (Harwood et al,
2003).
The purpose of this study it to attain a condensed and broad description of the content analysis of
journal papers by using criteria defined in the course of CSC 626 – a post graduate course taken by
Computer Science, Master’s degree students of Obafemi Awolowo University, Ile-Ife, Osun State,
Nigeria. For this study, it is important to answer a number of questions about research papers:
What are the components present in a paper? Are these components available in published paper?
What is the distribution of occurrence? Based on the answers to these questions can one be able to
make certain conclusions on the quality of papers that are published in a specific journal. This
research is limited in scope by the number of documents used and the journal from which papers
are selected; 25 papers were collected from the Journal of Advances in Engineering Software - open
access journals made available to Obafemi Awolowo University, Ile-Ife by Elsevier publishers. In
addition, the papers are not referred to explicitly rather using a numeric integer to describe the data
as shown in Table A1 in Appendix I.
Materials and Methods -This study is necessitated by the need to evaluate the contents of selected
research papers via the use of a model provided by Professor Fakorede of the Faculty of Agriculture
during the course of CSC626 in the Harmattan semester of the 2013/14 academic session. The data
consists of 25 papers selected from the Journal of Advances in Engineering Software (see Table A1 in
Appendix IThe most important task is to read and critic the contents of the journal papers and
record the findings in in a content analysis matrix table provided in the CSC 626 course as the
required criteria/selection model chosen for this study. Each paper was divided into five (5)
sections: paper title, abstract, introduction, methodology and results, discussions and references
such that each has its own content analysis matrix table. The total score for each paper was
recorded with the results expressed as a percentage (see Appendix II for scored of each section).
After generating the data from the content analysis tables for each section, the data is analyzed
using graphs and charts in order to determine the frequency and proportion of distribution with
measures of central tendencies and dispersion (mean and standard deviations) are also calculated
where necessary. The results of the methods are then used to make necessary judgments about the
contents of the journal papers selected and analyzed for this study.
Results and discussions
Following the description of the materials and methods and the process required for generating the
necessary data needed for analyses. The five (5) contents analyzed in each paper were presented in
graphs and tables for easy interpretation of the results. Following is the result gathered from the
analyses of the paper.
CONTENT ANALYSIS OF PAPER TITLE
The paper title is the first section of any paper and consists of four (4) sections namely: brief, catchy,
Keywords and Synchronize. To be brief means that the title contains only a few words that cannot
be expressed in any lesser way without losing the context of the title; the papers that satisfy the
criteria include papers: 3, 4, 5, 7, 8, 10, 12, 13, 15, 16,17,18,20, 21, 23 and 24. To be catchy means
to be instantly appealing and easy to remember; the papers that satisfy this criteria include papers:
3, 4, 5, 7, 8, 10, 12, 13, 15, 16, 17, 19, 20, 21, 22, 23, 24 and 25. A keyword means a word or idea
that is of great importance; the papers that satisfy the criteria include papers:
2,3,4,5,6,7,8,9,10,11,12,13,15,16,17,18,19,20,21,22,23 and 24. To synchronize means for two things
to do/imply the same thing, which in this case are the abstract and the paper title; the papers that
synchronize include all 25 papers. Table 1 gives a description of the result of the content analysis of
the paper title for all 25 papers while Figure 1 shows the distribution of the number of papers and
the percentage of papers which provide the sections described for a paper title.
Table 1 Content analysis of paper title
Figure 1
Content Number
of
papers
%
coverage
Brief 16 64
Catchy 18 72
Keyword 22 88
Synchronize 25 100
From the results presented above, it can be seen that out of all the 25 papers, 16 papers (64%) have
brief titles while the remaining 9 (36%) don’t have brief titles, 18 papers (72%) tiles are catchy while
the remaining 7 papers (28%) are not catchy, 22 papers (88%) have keywords while the remaining 3
papers (12%) do not have keywords. It is observed that all 25 papers synchronize with their
abstracts. Hence, authors need to be also concerned in making their paper title briefer, catchy and
use of appropriate keywords which will also improve the acceptability of such papers.
CONTENT ANALYSIS OF PAPER ABSTRACT
The abstract is the second section of importance in a paper; it gives a summary of the whole paper
and consists of five criteria which include: justification, Objectives, methodology, results and
conclusions. The justification gives a description of the motivation for the work and the papers that
have objectives include papers: 1, 5,9,13,15,18,20 and 21. The objectives give a description of the
things that need to be done or simply the purpose of the work and the papers that have objectives
include the papers: 4, 5, 7, 9, 13, 14 and 22. The methodology gives a description of the materials
and methods needed for the achievement of the stated objectives and the papers with
methodologies includes all the papers. The results give the outcome of the methodology that was
used in achieving the objectives and it includes papers: 1,2,3,4,5,6,9,10,11,13,16,18,22 and 25. The
conclusion gives a description of the final remarks that were made based on the results of the
research work and the papers that were observed to have conclusions include papers:
1,2,3,4,5,6,7,8,9,10,11,12,13,14,15,17,18,19,21,22 and 25.
papers (out of 25)
% of 25 papers0
10
20
30
40
50
60
70
80
90
100
Brief
Catchy
Keyword
Synchronize
Paper Title
papers (out of 25) % of 25 papers
Table 2 gives a description of the result of the content analysis of the paper title for all 25 papers
while Figure 2 shows the distribution of the number of papers and the percentage of papers which
provide the sections described for a paper title.
Table 2: Content analysis of the paper Abstract
papers
(out of
25)
% of 25
papers
Justification 10 40
Objectives 7 28
Methodology 25 100
Results 14 56
Conclusions 21 84
From the results presented above, it can be observed that authors 5,9 and 13 (100%) are able to
describe their justification, objectives, methodology, results and conclusion perfectly in the abstract.
10 (40%) papers were observed to have the justification, 7 (28%) papers have objective, 25 (100%)
have methodology, 14(60%) have results and 21 (88%) have conclusions of the papers available in
the abstract. Abstracts give a summary of the whole paper and it is expected to contain all 5 units
described else the essence of the paper is lost as a reader goes through the paper abstract; a lack of
important areas limits the reader from finding the paper relevant else, the reader will have to read
the whole document to grasp the documented information. Needless to say, a reader does not
need to read the whole document when the abstract can be read first.
Figure 2 Distribution of the paper abstract contents
CONTENT ANALYSIS OF PAPER INTRODUCTION
The introduction is the third important part of any research paper. It introduces the paper to the
reader and gives an eye opener on the things expected and what should be done; it consists of the
following criteria: background information, justification, statement of the problem, research
objective(s), scope and limitations and abbreviations and acronyms. The background information
gives detailed information on the facts that are needed in order to gain a better understanding of
the research area via the definition of important terms and areas of importance, the papers that
have a background information of their research include this papers
1,2,3,5,6,7,8,9,10,11,12,13,15,16,18,19,20,21,22,23,24,25. The justification of the research gives
the motivation for performing the study/research and the papers discovered to have justifications
includes all papers except 8,16,19 and 24. The statement of problem gives an account of the
problem that the research intends to solve and most papers addressed the issue of the statement of
problem except 2,3,6,7,8,20,23. The research objectives gives a description of the process involved
in achieving the stated problems and most papers were discovered to address this issue except
3,6,8,11,15. The research questions are questions that arise as a result of the research objectives of
the research and it was discovered that only 7,10 and 12 of the 25 papers was able to address any
research question. The research hypothesis is an idea/theory which is used to test the viability of
papers (out of 25)
% of 25 papers
0
20
40
60
80
100
Justification
Objectives
Methodology
Results
Conclusions
Abstract
papers (out of 25) % of 25 papers
the research question and are usually done using statistical tests; it was also discovered that papers
3,5,6,9,11,12,14 and 20 addressed the research hypothesis. Scope and limitations gives a
description of the drawbacks or how far the research work was able to go with meeting the stated
research objectives and it was discovered that papers: 17 papers (68%) stated the scope and
limitation of the research papers. The abbreviations and acronyms involves the description of any
word that is abbreviated or first letters of words used to identify long words which may also be
technical terms in the knowledge area of the research work, it was discovered that papers: 23
papers addressed the acronyms and abbreviations.
Table 3 gives a description of the result of the content analysis of the paper introduction for all 25
papers while Figure 3 shows the distribution of the number of papers and the percentage of papers
which provide the sections described for a paper introduction.
From the results, it is very clear that all 25 papers consist of research background, justification,
problem statement and objectives. Research question scored the lowest score.
Table 3 Content analysis of paper introduction
Content Number
of
papers
%
coverage
Background 22 88
Justification 21 84
Problem Statement 18 72
Objectives
Questions
Hypothesis
Scope&Limitations
Acroynms & Abbreviations
20
4
8
17
23
80
16
32
68
92
Figure 3 Distribution of the paper introduction contents
CONTENT ANALYSIS OF PAPER METHODOLOGY
The methodology is the fourth part of a paper to be addressed for criticism and it gives a detailed
description of how the research is conducted and the tools used in performing the necessary
methods. The methodology usually consists of the following: study location, methodology design,
data collection, requirement analysis/data analysis, experimental set-up/tools,
simulation/implementation, testing/.validation and reproducibility. The study location
Table 4 gives a description of the result of the content analysis of the paper methodology for all 25
papers while Figure 4 shows the distribution of the number of papers and the percentage of papers
which provide the sections described for a paper methodology.
papers (out of 25)
% of 25 papers
0
10
20
30
40
50
60
70
80
90
100
Introduction
papers (out of 25) % of 25 papers
Table 4 Content analysis of paper methodology
papers
(out of
25)
% of 25
papers
Study Location 11 44
Method. Design 24 96
Data Collect. 19 76
Req. Analysis or Data
Analysis I 24 96
Expet. Set-up or Tools 22 88
Simul. Or Implement. 23 92
Testing/Valid. 15 60
Reprod. 2 8
The results show that all papers have requirement analysis, experimental set-up and
simulations/implementations which help to understand the process of methods but 24 (96%) also
describe the data collection method used. An average of 18 (72%) gave a description of the study
location, testing/validation and are found reproducible; a lack in any of this information affects the
acceptability of the results presented in any paper since a description of the process is not enough
to accept the results but a description of where data is collected from and the results of the test
helps in accepting the results and conclusions presented by the author of the paper. Only 5 (20%) of
the papers gave a description of the methodology design which is a summary of the whole
methodology process.
Figure 4 Distribution of the paper methodology contents
Content analysis of paper results, discussions and references
The results, discussion and the references are the last part of the paper. They results are usually
expressed in Tables, figures and plates and they usually satisfy the following: completeness,
sequential, referred to in text, state statistical test used and tally with objectives. All 25 papers were
observed to satisfy the completeness of the tables/figures/plates used via titling and numbering, all
25 papers were discovered to be sequential since the numberings were done in the order in which
they appear and the 25 papers were all referred to in the text. The statistical test is used to the test
that hypothesis stated in the introduction (if any) but, none of the 25 papers stated any statistical
test owing to the fact that no hypothesis was tested in the papers. All 25 papers was discovered to
have results that were noticed to tally with the stated objectives of the research paper.
Table 5 gives a description of the result of the content analysis of the paper results, discussions and
references for all 25 papers while Figure 5 shows the distribution of the number of papers and the
percentage of papers which provide the sections described for a paper results, discussions and
references.
papers (out of 25)
% of 25 papers
0
10
20
30
40
50
60
70
80
90
100
Methodology
papers (out of 25) % of 25 papers
Table 5 Content analysis of paper results, discussions and references Number of Papers % coverage
Tables and/or figures
Table 5: Content analysis of results, discussions and referrences
Figure 5 Distribution of the contents for results, discussions and references
papers (out of 25)
% of 25 papers
0
20
40
60
80
100
Sequen
Complet
Referredtointext
Stattestused
Tallywithobj
LinkedtoLit
Identflaws
Impli
Summ
Tables and/or figures
Discussion
Ref. in
alpha
order
Results, Discussions and References
papers (out of 25) % of 25 papers
papers
(out of
25)
% of 25
papers
Tables
and/or
figures
Sequen 25 100
Complet 22 88
Referred to in text 25 100
Stat test used 7 28
Tally with obj 23 92
Discussion
Linked to Lit 24 96
Ident flaws 17 68
Impli 24 96
Summ 23 92
Ref. in alpha order 11 44
The results show that all 25 papers have well-documented tables which satisfy all the requirements
for a table except that there was no indication of statistical test used – which is hardly the case in
most computer science papers. The tables of results of the 25 papers was observed to tally with the
objectives of the paper, there were all shown in sequence, were all referred to within the text of the
paper. None of the tables gave a description of the statistical test used – it was indicated in the
methodology that no test was stated.
Mean and standard deviation of the content analysis
After performing the expected analysis of the respective contents of the 5 sections of the 25 papers;
it was expedient to observe the central tendencies and the dispersion of the results so as to attain a
generalization or a normalization of the data collected from the analysis of the 25 papers.
Content mean standard deviation
Title 81.78695144 20.95140034
Abstract 80.5727482 21.58613803
Introduction 79.35854497 22.8947105
Methodology 83.06339485 20.37202672
Results, Discussion & References 81.68729785 21.00511447
Table 7 gives a description of the average score for each paper: taking the average score of the 5
sections analyzed after which the mean and the standard deviation of each section was determined.
Using the data presented in Table 7; Figure 7 gives a trend of each section (all 5 of them) for all 25
papers showing the distribution of each sections for all 2s papers. The distribution shows clearly the
similarities and differences between each individual paper analyzed.
Figure 6 Mean and standard deviation of content scores
Table 7 Average score for 25 papers
Paper Title Abstract Introduction Methodology Results, Discussions and references
Paper
Title Abstract Introduction Methodology
Results,
Discussions
and
references
avearge
score for
each
paper
1 25 80 75 87.5 90 71.5
2 50 60 37.5 50 80 55.5
3 100 60 50 87.5 90 77.5
4 100 80 62.5 50 90 76.5
5 100 100 87.5 87.5 90 93
6 50 60 62.5 37.5 80 58
7 100 80 75 87.5 90 86.5
8 100 60 25 62.5 70 63.5
9 50 100 87.5 50 90 75.5
10 100 60 87.5 62.5 80 78
mean
standard deviation
0
20
40
60
80
100
Title
Abstract
Introduction
Methodology
Results,
discussions
and
references
Mean and Standard deviation of each section for the 25 papers
mean standard deviation
11 50 60 62.5 87.5 80 68
12 100 40 100 62.5 80 76.5
13 100 100 75 75 70 84
14 25 60 75 87.5 90 67.5
15 100 60 62.5 50 70 68.5
16 100 40 50 62.5 80 66.5
17 100 40 50 50 90 66
18 75 80 75 87.5 100 83.5
19 75 40 50 50 80 59
20 100 40 75 87.5 70 74.5
21 100 60 62.5 87.5 60 74
22 75 80 75 62.5 80 74.5
23 100 20 62.5 50 70 60.5
24 100 60 62.5 62.5 80 73
25 50 60 75 100 70 71
average
score for
each
section 82.29166667 63.33333333 66.14583333 67.70833333 81.25
Std
deviation 26.2995564 20.55885859 16.81703006 18.08544535 9.539392014
Conclusions In this study, an attempt has been made to analyze the content of 25 journals selected
from the Journal of Advances in Engineering Software by Elsevier publishers. The 25 papers were
analyzed for 5 different contents using certain units described for each section as a measure of
evaluation. The data collected using the content analysis matrix table were used as primary data for
another analysis of the trend and distribution of the contents for each paper. The results were
presented and it was discovered that authors need to put more effort into the documentation of
their abstract and introduction part of their paper. Although, a good percentage present their
abstracts, methodology and results it was however discovered that a good number still deter from
this practice while documenting their works.
This study is expected to help provide a means of evaluating the kind of papers available for
publication by different publishers and may provide a means of recommending journals which have
a sound collection of research papers.
REFERENCES
Harwood, T.G., Garry, T. (2003). An overview of content analysis. The Marketing Review3, 479– 498
Krippendorff, K. (1980). Content Analysis: An Introduction to its Methodology. Sage Publications,
Newbury Park.
APPENDIX 1
Surname of Student…FALAIYE……………..……………….. Initials…M.W…….. Dept. COMPUTER SCIENCE AND
ENGINEERING…. Reg. No. …TP13/14/H/1016…
Name of Journal…ADVANCES IN ENGINEERING SOFTWARE…………………………….. Volume……41………….
Year……2010………………… Issue …4, 5, 6……….
Table A1 in Appendix 1
Content Analysis of Journal Paper Title
Paper Author(s) & Title Paper
1 Nie, H.J.; Hopkins, D.A.; Chen, Y.T. and Hsieh,
H.T.
Development of an object-oriented finite
element program with adaptive mesh
refinement for multi-physics applications
1
2 Gurkan Altan and Muzaffer Topcu
Thermo-elastic stress of a metal-matrix
composite disc under linearly-increasing
temperature loading by analytical and FEM
analysis
2
3 Abdulkadir Cevik; Tolga Gogus M.; Ibrahim H.
Guzelbey and Huzeyin Filiz
Soft computing based formulation for strength
enhancement of CFRP confined concrete
cylinders
3
4 Gasparetto, A. and Zanotto, V.
Optimal trajectory planning for industrial
robots
4
5 Yongtae Jun and Kulwoon Choi
Design of patient-specific hip implants based on
5
the 3D geometry of the human femur.
6 Omer Civalek; Armagan Korkmaz and Cigdem
Demir
Discrete singular convolution approach for
buckling analysis of rectangular Kirchhoff
plats subjected to compressive loads on two-
opposite edges.
6
7 Dahai Guo; Xuedong Yan; Janusz Zalewski and
Calude Villiers
Visualization of road geometries based on
CADD design standards
7
8 Ismail Farajpour
Constrained optimization of structures with
displacement constraints under various loading
conditions.
8
9 Jiaqing Yu; Jianzhong Cha; Yiping Lu; Wensheng
Xu and Sobolewski, M.
A CAE-integrated distributed collaborative
design system for finite element analysis of
complex product based on SOOA
9
10 Christine Bersch; Adrian P. Cisilino and Nestor
Calvo
Topology optimization of three-dimensional
load-bearing structures using boundary
elements.
10
11 Abdulkadir Cevik; Tolga Gogus M.; Ibrahim H.
GuzelbeY and Huzeyin Filiz
A new formulation for longitudinally stiffened
webs subjected to patch loading using stepwise
regression method
11
12 Phill-Seung Lee and Klaus-jurgen Bathe 12
The quadratic MITC plate and MITC shell
elements in plate bending
13 Wenjun Xu; Zude Zhou and Quan Liu
Hybrid one-way delay estimation for
networked control system
13
14 Baylar, A. and Batan, M.
Usage of artificial intelligence methods in free
flowing gated closed conduits for estimation of
oxygen transfer efficiency
14
15 Antonio Coronato and Giuseppe De Peitro
Formal design and implementation of
constraints in software components.
15
16 Granville Sewell
Solving PDEs in non-rectangular 3D regions
using a collocation finite element method.
16
17 Roberto Augusto Gomez Loenzo; Pedro Daniel
Alaniz Lumbreras; Rene de Jesus Romero
Troncoso and Gilberto Herrera Ruiz
An object-oriented architecture for sensorless
cutting force feedback for CNC milling process
monitoring and control
17
18 Adel Mellit
ANN-based GA for generating the sizing curve
of stand-alone photocoltaic systems
18
19 Taner Altunok and Tanyel Cakmak
A technology readiness levels (TRLs) calculator
software for systems engineering and
technology management tool
19
20 David P. Gutzwiller and Mark G. Turner
Rapid low fidelity turbomachinery disk
optimization
20
21 Fikret Kocabas and Serap Unal
Compared techniques for the critical
submergence of an intake in water flow
21
22 Andrea Bolognesi; Cristiana Bragalli; Angela
Marchi and Sandro Artina
Genetic Heritage Evolution by Stochastic
Transmission in the optimal design of water
distribution networks.
22
23 Shabnam Rezapour and Reza Zanjirani Farahani
Strategic design of competing centralized
supply chain networks for markets with
deterministic demands
23
24 Glodez, Z.; Jezernik, N; Kramberger, J. and
Lassen, T.
Numerical modelling of fatigue crack initiation
of martensitic steel
24
25 Nader Larbi and Jamel Bessrour
Measurement and simulation of pollutant
emissions from marine diesel combustion
engine and their reduction by water injection
25
APPENDIX II
Surname of Student…FALAIYE……………..……………….. Initials…M.W…….. Dept. COMPUTER SCIENCE AND
ENGINEERING…. Reg. No. …TP13/14/H/1016…
Name of Journal…ADVANCES IN ENGINEERING SOFTWARE…………………………….. Volume……41………….
Year……2010………………… Issue …4, 5, 6……….
Table A2 Appendix II
Content Analysis of Journal Paper Title
Paper Brief Catchy Keywords Synchronize Total (max=4) % of total
1 0 0 0 1 1 25
2 0 0 1 1 2 50
3 1 1 1 1 4 100
4 1 1 1 1 4 100
5 1 1 1 1 4 100
6 0 0 1 1 2 50
7 1 1 1 1 4 100
8 1 1 1 1 4 100
9 0 0 1 1 2 50
10 1 1 1 1 4 100
11 0 0 1 1 2 50
12 1 1 1 1 4 100
13 1 1 1 1 4 100
14 0 0 0 1 1 25
15 1 1 1 1 4 100
16 1 1 1 1 4 100
17 1 1 1 1 4 100
18 1 0 1 1 3 75
19 0 1 1 1 3 75
20 1 1 1 1 4 100
21 1 1 1 1 4 100
22 0 1 1 1 3 75
23 1 1 1 1 4 100
24 1 1 1 1 4 100
25 0 1 0 1 2 50
Surname of Student…FALAIYE……………..……………….. Initials…M.W…….. Dept. COMPUTER SCIENCE AND
ENGINEERING…. Reg. No. …TP13/14/H/1016…
Name of Journal…ADVANCES IN ENGINEERING SOFTWARE…………………………….. Volume……41………….
Year……2010………………… Issue …4, 5, 6……….
Content Analysis of Abstract of Journal Papers in Computer
Science
Paper J O M R C Total (max=5) % of total
1 1 0 1 1 1 4 80
2 0 0 1 1 1 3 60
3 0 0 1 1 1 3 60
4 0 1 1 1 1 4 80
5 1 1 1 1 1 5 100
6 0 0 1 1 1 3 60
7 1 1 1 0 1 4 80
8 1 0 1 0 1 3 60
9 1 1 1 1 1 5 100
10 0 0 1 1 1 3 60
11 0 0 1 1 1 3 60
12 0 0 1 0 1 2 40
13 1 1 1 1 1 5 100
14 0 1 1 0 1 3 60
15 1 0 1 0 1 3 60
16 0 0 1 1 0 2 40
17 0 0 1 0 1 2 40
18 1 0 1 1 1 4 80
19 0 0 1 0 1 2 40
20 1 0 1 0 0 2 40
21 1 0 1 0 1 3 60
22 0 1 1 1 1 4 80
23 0 0 1 0 0 1 20
24 0 0 1 0 0 1 20
25 0 0 1 1 1 3 60
J = Justification O = Objective(s) M = Methodology R = Results C = Conclusion
Surname of Student…FALAIYE……………..……………….. Initials…M.W…….. Dept. COMPUTER SCIENCE AND
ENGINEERING…. Reg. No. …TP13/14/H/1016…
Name of Journal…ADVANCES IN ENGINEERING SOFTWARE…………………………….. Volume……41………….
Year……2010………………… Issue …4, 5, 6……….
INTRODUCTION
Paper B J P O Q H S&L A&A Total (max=8) % of total
1 1 1 1 1 0 0 1 1 6 75
2 1 1 0 1 0 0 0 0 3 37.5
3 1 1 0 0 0 1 0 1 4 50
4 0 1 1 1 0 0 1 1 5 62.5
5 1 1 1 1 0 1 1 1 7 87.5
6 1 1 0 0 0 1 1 1 5 62.5
7 1 1 0 1 1 0 1 1 6 75
8 1 0 0 0 0 0 1 0 2 25
9 1 1 1 1 0 1 1 1 7 87.5
10 1 1 1 1 1 0 1 1 7 87.5
11 1 1 1 0 0 1 0 1 5 62.5
12 1 1 1 1 1 1 1 1 8 100
13 1 1 1 1 0 0 1 1 6 75
14 0 1 1 1 0 1 1 1 6 75
15 1 1 1 0 0 0 1 1 5 62.5
16 1 0 1 1 0 0 0 1 4 50
17 0 1 1 1 0 0 0 1 4 50
18 1 1 1 1 0 0 1 1 6 75
B=Background Information J=Justification P=Statement of the Problem
O=Research Objective(s)
Q=Research Questions H=Research Hypothesis (es) S&L=Scope and Limitations
A&A=Abbreviations and Acronyms
19 1 0 1 1 0 0 0 1 4 50
20 1 1 0 1 0 1 1 1 6 75
21 1 1 1 1 0 0 0 1 5 62.5
22 1 1 1 1 0 0 1 1 6 75
23 1 1 0 1 1 0 0 1 5 62.5
24 1 0 1 1 0 0 1 1 5 62.5
25 1 1 1 1 0 0 1 1 6 75
Surname of Student…FALAIYE……………..……………….. Initials…M.W…….. Dept. COMPUTER SCIENCE AND
ENGINEERING…. Reg. No. …TP13/14/H/1016…
Name of Journal…ADVANCES IN ENGINEERING SOFTWARE…………………………….. Volume……41………….
Year……2010………………… Issue …4, 5, 6……….
METHODOLOGY
Paper SL MD DC RA/DA ES S/I T/V R Total %Total
1 1 1 1 1 1 1 1 0 7 87.5
2 1 1 0 1 1 0 0 0 4 50
3 1 1 1 1 1 1 1 0 7 87.5
4 0 0 0 1 1 1 1 0 4 50
5 1 1 1 1 1 1 1 0 7 87.5
6 0 1 1 1 0 0 0 0 3 37.5
7 1 1 1 1 1 1 1 0 7 87.5
8 0 1 1 1 0 1 1 0 5 62.5
9 0 1 0 1 1 1 0 0 4 50
10 0 1 1 1 1 1 1 0 6 62.5
11 1 1 1 1 1 1 1 0 7 87.5
12 0 1 1 1 0 1 1 0 5 62.5
13 0 1 1 1 1 1 1 0 6 75
14 0 1 1 1 1 1 1 1 7 87.5
15 0 1 0 1 1 1 0 0 4 50
16 0 1 1 1 1 1 0 0 5 62.5
17 0 1 0 1 1 1 0 0 4 50
18 1 1 1 1 1 1 1 0 7 87.5
19 0 1 0 1 1 1 0 0 4 50
20 1 1 1 1 1 1 1 0 7 87.5
21 1 1 1 1 1 1 1 0 7 87.5
22 1 1 1 1 1 1 0 0 6 62.5
23 0 1 1 0 1 1 0 0 4 50
24 0 1 1 1 1 1 0 0 5 62.5
25 1 1 1 1 1 1 1 1 8 100
Study Location (SL) - where, population, sample size etc.
Methodology Design (MD) - UML, architecture model etc.
Data Collection (DC) – means of collecting data (if any)
Requirement Analysis or Data Analysis (RA/DA) – method of gathering information on requirements/initial
data analysis performed
Experimental Set-up/Tools (ES) – software, hardware, development environment etc.
Simulation/Implementation(S/I) – the technical solution provided
Testing/Validation (T/V) – the necessary statistical tests used/test performed on the implemented system
Reproducibility(R) –possibility of re-creation
Surname of Student…FALAIYE……………..……………….. Initials…M.W…….. Dept. COMPUTER SCIENCE AND
ENGINEERING…. Reg. No. …TP13/14/H/1016…
Name of Journal…ADVANCES IN ENGINEERING SOFTWARE…………………………….. Volume……41………….
Year……2010………………… Issue …4, 5, 6……….
RESULTS, DISCUSSIONS & REFERENCES
Paper Tables and/or figures Discussion Ref.
in
alpha
order
Total
(max=10)
% of
TotalSequen Complet Referred
to in text
Stat
test
used
Tally
with
obj
Linked
to Lit
Ident
flaws
Impli Summ
1 1 1 1 0 1 1 1 1 1 1 9 90
2 1 1 1 0 1 1 1 0 1 1 8 80
3 1 1 1 1 1 1 1 1 1 0 9 90
4 1 1 1 0 1 1 1 1 1 1 9 90
5 1 1 1 0 1 1 1 1 1 1 9 90
6 1 1 1 0 1 1 1 1 1 0 8 80
7 1 1 1 0 1 1 1 1 1 1 9 90
8 1 0 1 0 1 1 0 1 1 1 7 70
9 1 1 1 0 1 1 1 1 1 1 9 90
10 1 1 1 0 1 1 1 1 1 0 8 80
11 1 1 1 0 1 1 1 1 1 0 8 80
12 1 1 1 1 0 1 1 1 1 0 8 80
13 1 1 1 0 1 1 0 1 1 0 7 70
14 1 1 1 1 1 1 0 1 1 1 9 90
15 1 1 1 0 1 1 0 1 1 0 7 70
16 1 1 1 0 1 1 1 1 1 0 8 80
17 1 1 1 1 1 1 0 1 1 1 9 90
18 1 1 1 1 1 1 1 1 1 1 10 100
19 1 1 1 0 1 1 0 1 1 1 8 80
20 1 1 1 0 1 1 1 1 0 0 7 70
21 1 1 1 1 0 0 0 1 1 0 6 60
22 1 0 1 1 1 1 1 1 1 0 8 80
23 1 0 1 0 1 1 1 1 1 0 7 70
24 1 1 1 0 1 1 1 1 1 0 8 80
25 1 1 1 0 1 1 0 1 1 0 7 70
Sequen - Tables and figures are numbered sequentially as they are presented in the text
Complet – Tables and figures are complete. For both of them, complete means they are numbered, with self-
explanatory titles and units of measures as necessary. For tables, entries are well aligned, each column has a
heading and unit of measure as necessary, no vertical or horizontal lines, footnotes are supplied where needed and
statistical test of hypothesis clearly indicated.
Referred to in text – The table or figure is not just put in the paper, but is presented to the reader by the author calling
attention of the reader to some specific points on the table or figure
Stat test used – The author(s) clearly applied statistical test such as LSD, DNMRT, SE, SEM, t-test, F-test, Chi-square
test. In figures, error bars are included for hypothesis testing.
Tally with obj. – tables, figures and manner of presentation of results tally well with the objectives of the study
Linked to Lit. – The discussion must link the results to the existing literature related to the subject of the research.
Indenti flaws – Identifies the flaws in the research; explains results that seem to differ what is generally believed as the
state of knowledge in the subject-matter area, proposes possible reasons for such deviations.
Impli – Implication or practical application of the results is discussed.
Summary – The study provides a summary highlighting major findings. This MUST be different from the abstract.
Ref. in alpha order – References are listed in alphabetical order, or are numbered as they occur in the text if number
system are used.

More Related Content

What's hot

An Introduction to writing an Systematic review of literature - Scientific re...
An Introduction to writing an Systematic review of literature - Scientific re...An Introduction to writing an Systematic review of literature - Scientific re...
An Introduction to writing an Systematic review of literature - Scientific re...Pubrica
 
L15 rm writing research report
L15 rm writing research reportL15 rm writing research report
L15 rm writing research reportDr Ghaiath Hussein
 
Contents Of A Research Repor Tppt
Contents Of A Research Repor TpptContents Of A Research Repor Tppt
Contents Of A Research Repor TpptNeeru Sharma
 
Final dissertation format-updated.3
Final dissertation format-updated.3Final dissertation format-updated.3
Final dissertation format-updated.3Krishna M M
 
Research Report Writing
Research Report WritingResearch Report Writing
Research Report WritingMeghana Sudhir
 
Week8 writing the results
Week8  writing the resultsWeek8  writing the results
Week8 writing the resultsHafizul Mukhlis
 
Methodology chapter
Methodology chapterMethodology chapter
Methodology chapterengrhassan21
 
How to write Good Research Report
How to write Good Research ReportHow to write Good Research Report
How to write Good Research Reportcommercesndtmumbai
 
Marketing Research: Research Format/Template
Marketing Research: Research Format/TemplateMarketing Research: Research Format/Template
Marketing Research: Research Format/TemplateDr. John V. Padua
 
Study on Report Writing.pptx
Study on Report Writing.pptxStudy on Report Writing.pptx
Study on Report Writing.pptxMd Fahimuzzaman
 
Research Methods Chapter- Masters' Dissertation
Research Methods Chapter- Masters' DissertationResearch Methods Chapter- Masters' Dissertation
Research Methods Chapter- Masters' DissertationAyat A. Saleh
 
How to write your dissertation data analysis chapters.
How to write your dissertation data analysis chapters.How to write your dissertation data analysis chapters.
How to write your dissertation data analysis chapters.The Free School
 
Presentation on interpretation and report writing
Presentation on interpretation and report writingPresentation on interpretation and report writing
Presentation on interpretation and report writingSafiullah Rifat
 
Guideline for master's thesis evaluation
Guideline for master's thesis evaluationGuideline for master's thesis evaluation
Guideline for master's thesis evaluationSalman Khan
 
Lecture 3. planning data analysis
Lecture 3. planning data analysisLecture 3. planning data analysis
Lecture 3. planning data analysisHau Pham
 

What's hot (20)

An Introduction to writing an Systematic review of literature - Scientific re...
An Introduction to writing an Systematic review of literature - Scientific re...An Introduction to writing an Systematic review of literature - Scientific re...
An Introduction to writing an Systematic review of literature - Scientific re...
 
L15 rm writing research report
L15 rm writing research reportL15 rm writing research report
L15 rm writing research report
 
Finance research
Finance researchFinance research
Finance research
 
Contents Of A Research Repor Tppt
Contents Of A Research Repor TpptContents Of A Research Repor Tppt
Contents Of A Research Repor Tppt
 
Final dissertation format-updated.3
Final dissertation format-updated.3Final dissertation format-updated.3
Final dissertation format-updated.3
 
Research Report Writing
Research Report WritingResearch Report Writing
Research Report Writing
 
Week8 writing the results
Week8  writing the resultsWeek8  writing the results
Week8 writing the results
 
Methodology chapter
Methodology chapterMethodology chapter
Methodology chapter
 
Thesis writing apa format
Thesis writing apa formatThesis writing apa format
Thesis writing apa format
 
How to write Good Research Report
How to write Good Research ReportHow to write Good Research Report
How to write Good Research Report
 
Research Paper Rubrics 2020
Research Paper Rubrics 2020Research Paper Rubrics 2020
Research Paper Rubrics 2020
 
Marketing Research: Research Format/Template
Marketing Research: Research Format/TemplateMarketing Research: Research Format/Template
Marketing Research: Research Format/Template
 
Study on Report Writing.pptx
Study on Report Writing.pptxStudy on Report Writing.pptx
Study on Report Writing.pptx
 
Research Methods Chapter- Masters' Dissertation
Research Methods Chapter- Masters' DissertationResearch Methods Chapter- Masters' Dissertation
Research Methods Chapter- Masters' Dissertation
 
Writing research report
Writing research reportWriting research report
Writing research report
 
How to write your dissertation data analysis chapters.
How to write your dissertation data analysis chapters.How to write your dissertation data analysis chapters.
How to write your dissertation data analysis chapters.
 
Presentation on interpretation and report writing
Presentation on interpretation and report writingPresentation on interpretation and report writing
Presentation on interpretation and report writing
 
Guideline for master's thesis evaluation
Guideline for master's thesis evaluationGuideline for master's thesis evaluation
Guideline for master's thesis evaluation
 
Lesson 7 chapter 5
Lesson 7   chapter 5Lesson 7   chapter 5
Lesson 7 chapter 5
 
Lecture 3. planning data analysis
Lecture 3. planning data analysisLecture 3. planning data analysis
Lecture 3. planning data analysis
 

Similar to Falaiye mayowa

MELJUN CORTES research lectures_apa_format_terminal_reports
MELJUN CORTES research lectures_apa_format_terminal_reportsMELJUN CORTES research lectures_apa_format_terminal_reports
MELJUN CORTES research lectures_apa_format_terminal_reportsMELJUN CORTES
 
research report.docx
research report.docxresearch report.docx
research report.docxTUTH
 
PurposeThe purpose of this paper is to interpret the two artic.docx
PurposeThe purpose of this paper is to interpret the two artic.docxPurposeThe purpose of this paper is to interpret the two artic.docx
PurposeThe purpose of this paper is to interpret the two artic.docxsimonlbentley59018
 
reading and writing RESEARCH REPORT.pptx
reading and writing RESEARCH REPORT.pptxreading and writing RESEARCH REPORT.pptx
reading and writing RESEARCH REPORT.pptxevafecampanado1
 
School of Business, Economic, and TechnologyCampbellsville U.docx
School of Business, Economic, and TechnologyCampbellsville U.docxSchool of Business, Economic, and TechnologyCampbellsville U.docx
School of Business, Economic, and TechnologyCampbellsville U.docxanhlodge
 
Research Report Guide A Guide for BA634 Students .docx
Research Report Guide A Guide for BA634 Students .docxResearch Report Guide A Guide for BA634 Students .docx
Research Report Guide A Guide for BA634 Students .docxgholly1
 
ResearchReport Guide Table of Contents.docx
ResearchReport Guide Table of Contents.docxResearchReport Guide Table of Contents.docx
ResearchReport Guide Table of Contents.docxronak56
 
Contents of research report
Contents of research reportContents of research report
Contents of research reportAbhinav Kp
 
SYLLABUSCOURSE NUMBER NGR 5110COURSE TITLE Nursing Research.docx
SYLLABUSCOURSE NUMBER NGR 5110COURSE TITLE Nursing Research.docxSYLLABUSCOURSE NUMBER NGR 5110COURSE TITLE Nursing Research.docx
SYLLABUSCOURSE NUMBER NGR 5110COURSE TITLE Nursing Research.docxmabelf3
 
Call for Papers - Educational Administration: Theory and Practice, E-ISSN: 21...
Call for Papers - Educational Administration: Theory and Practice, E-ISSN: 21...Call for Papers - Educational Administration: Theory and Practice, E-ISSN: 21...
Call for Papers - Educational Administration: Theory and Practice, E-ISSN: 21...Christo Ananth
 
Asmita thesis writing
Asmita thesis writingAsmita thesis writing
Asmita thesis writingmagareasmi
 
1 Assessment 1 Context In order for research to have s.docx
1 Assessment 1 Context In order for research to have s.docx1 Assessment 1 Context In order for research to have s.docx
1 Assessment 1 Context In order for research to have s.docxoswald1horne84988
 
Preparation of Research Reports
Preparation of Research Reports Preparation of Research Reports
Preparation of Research Reports Vasanthagopal R
 
837 Unit 9 Report Writing Dr. Zaheer Ahmad.pptx
837 Unit 9 Report Writing Dr. Zaheer Ahmad.pptx837 Unit 9 Report Writing Dr. Zaheer Ahmad.pptx
837 Unit 9 Report Writing Dr. Zaheer Ahmad.pptxSubhanullahTutorial
 
research proposal writting chapter 2
research proposal writting chapter 2research proposal writting chapter 2
research proposal writting chapter 2EthioJohn
 
Unit5_Report writing.ppt
Unit5_Report writing.pptUnit5_Report writing.ppt
Unit5_Report writing.pptPraveen Kumar
 
Research paper & Thesis.pptx
Research paper & Thesis.pptxResearch paper & Thesis.pptx
Research paper & Thesis.pptxShovonAhmed17
 

Similar to Falaiye mayowa (20)

MELJUN CORTES research lectures_apa_format_terminal_reports
MELJUN CORTES research lectures_apa_format_terminal_reportsMELJUN CORTES research lectures_apa_format_terminal_reports
MELJUN CORTES research lectures_apa_format_terminal_reports
 
Structure of synopsis
Structure of synopsisStructure of synopsis
Structure of synopsis
 
research report.docx
research report.docxresearch report.docx
research report.docx
 
PurposeThe purpose of this paper is to interpret the two artic.docx
PurposeThe purpose of this paper is to interpret the two artic.docxPurposeThe purpose of this paper is to interpret the two artic.docx
PurposeThe purpose of this paper is to interpret the two artic.docx
 
reading and writing RESEARCH REPORT.pptx
reading and writing RESEARCH REPORT.pptxreading and writing RESEARCH REPORT.pptx
reading and writing RESEARCH REPORT.pptx
 
School of Business, Economic, and TechnologyCampbellsville U.docx
School of Business, Economic, and TechnologyCampbellsville U.docxSchool of Business, Economic, and TechnologyCampbellsville U.docx
School of Business, Economic, and TechnologyCampbellsville U.docx
 
Research Report Guide A Guide for BA634 Students .docx
Research Report Guide A Guide for BA634 Students .docxResearch Report Guide A Guide for BA634 Students .docx
Research Report Guide A Guide for BA634 Students .docx
 
ResearchReport Guide Table of Contents.docx
ResearchReport Guide Table of Contents.docxResearchReport Guide Table of Contents.docx
ResearchReport Guide Table of Contents.docx
 
Lecture 8.ppt
Lecture 8.pptLecture 8.ppt
Lecture 8.ppt
 
Lecture 8.ppt
Lecture 8.pptLecture 8.ppt
Lecture 8.ppt
 
Contents of research report
Contents of research reportContents of research report
Contents of research report
 
SYLLABUSCOURSE NUMBER NGR 5110COURSE TITLE Nursing Research.docx
SYLLABUSCOURSE NUMBER NGR 5110COURSE TITLE Nursing Research.docxSYLLABUSCOURSE NUMBER NGR 5110COURSE TITLE Nursing Research.docx
SYLLABUSCOURSE NUMBER NGR 5110COURSE TITLE Nursing Research.docx
 
Call for Papers - Educational Administration: Theory and Practice, E-ISSN: 21...
Call for Papers - Educational Administration: Theory and Practice, E-ISSN: 21...Call for Papers - Educational Administration: Theory and Practice, E-ISSN: 21...
Call for Papers - Educational Administration: Theory and Practice, E-ISSN: 21...
 
Asmita thesis writing
Asmita thesis writingAsmita thesis writing
Asmita thesis writing
 
1 Assessment 1 Context In order for research to have s.docx
1 Assessment 1 Context In order for research to have s.docx1 Assessment 1 Context In order for research to have s.docx
1 Assessment 1 Context In order for research to have s.docx
 
Preparation of Research Reports
Preparation of Research Reports Preparation of Research Reports
Preparation of Research Reports
 
837 Unit 9 Report Writing Dr. Zaheer Ahmad.pptx
837 Unit 9 Report Writing Dr. Zaheer Ahmad.pptx837 Unit 9 Report Writing Dr. Zaheer Ahmad.pptx
837 Unit 9 Report Writing Dr. Zaheer Ahmad.pptx
 
research proposal writting chapter 2
research proposal writting chapter 2research proposal writting chapter 2
research proposal writting chapter 2
 
Unit5_Report writing.ppt
Unit5_Report writing.pptUnit5_Report writing.ppt
Unit5_Report writing.ppt
 
Research paper & Thesis.pptx
Research paper & Thesis.pptxResearch paper & Thesis.pptx
Research paper & Thesis.pptx
 

Recently uploaded

Sociology 101 Demonstration of Learning Exhibit
Sociology 101 Demonstration of Learning ExhibitSociology 101 Demonstration of Learning Exhibit
Sociology 101 Demonstration of Learning Exhibitjbellavia9
 
HMCS Vancouver Pre-Deployment Brief - May 2024 (Web Version).pptx
HMCS Vancouver Pre-Deployment Brief - May 2024 (Web Version).pptxHMCS Vancouver Pre-Deployment Brief - May 2024 (Web Version).pptx
HMCS Vancouver Pre-Deployment Brief - May 2024 (Web Version).pptxmarlenawright1
 
On National Teacher Day, meet the 2024-25 Kenan Fellows
On National Teacher Day, meet the 2024-25 Kenan FellowsOn National Teacher Day, meet the 2024-25 Kenan Fellows
On National Teacher Day, meet the 2024-25 Kenan FellowsMebane Rash
 
Python Notes for mca i year students osmania university.docx
Python Notes for mca i year students osmania university.docxPython Notes for mca i year students osmania university.docx
Python Notes for mca i year students osmania university.docxRamakrishna Reddy Bijjam
 
TỔNG ÔN TẬP THI VÀO LỚP 10 MÔN TIẾNG ANH NĂM HỌC 2023 - 2024 CÓ ĐÁP ÁN (NGỮ Â...
TỔNG ÔN TẬP THI VÀO LỚP 10 MÔN TIẾNG ANH NĂM HỌC 2023 - 2024 CÓ ĐÁP ÁN (NGỮ Â...TỔNG ÔN TẬP THI VÀO LỚP 10 MÔN TIẾNG ANH NĂM HỌC 2023 - 2024 CÓ ĐÁP ÁN (NGỮ Â...
TỔNG ÔN TẬP THI VÀO LỚP 10 MÔN TIẾNG ANH NĂM HỌC 2023 - 2024 CÓ ĐÁP ÁN (NGỮ Â...Nguyen Thanh Tu Collection
 
Micro-Scholarship, What it is, How can it help me.pdf
Micro-Scholarship, What it is, How can it help me.pdfMicro-Scholarship, What it is, How can it help me.pdf
Micro-Scholarship, What it is, How can it help me.pdfPoh-Sun Goh
 
How to Add New Custom Addons Path in Odoo 17
How to Add New Custom Addons Path in Odoo 17How to Add New Custom Addons Path in Odoo 17
How to Add New Custom Addons Path in Odoo 17Celine George
 
Jual Obat Aborsi Hongkong ( Asli No.1 ) 085657271886 Obat Penggugur Kandungan...
Jual Obat Aborsi Hongkong ( Asli No.1 ) 085657271886 Obat Penggugur Kandungan...Jual Obat Aborsi Hongkong ( Asli No.1 ) 085657271886 Obat Penggugur Kandungan...
Jual Obat Aborsi Hongkong ( Asli No.1 ) 085657271886 Obat Penggugur Kandungan...ZurliaSoop
 
Basic Civil Engineering first year Notes- Chapter 4 Building.pptx
Basic Civil Engineering first year Notes- Chapter 4 Building.pptxBasic Civil Engineering first year Notes- Chapter 4 Building.pptx
Basic Civil Engineering first year Notes- Chapter 4 Building.pptxDenish Jangid
 
Understanding Accommodations and Modifications
Understanding  Accommodations and ModificationsUnderstanding  Accommodations and Modifications
Understanding Accommodations and ModificationsMJDuyan
 
The basics of sentences session 3pptx.pptx
The basics of sentences session 3pptx.pptxThe basics of sentences session 3pptx.pptx
The basics of sentences session 3pptx.pptxheathfieldcps1
 
This PowerPoint helps students to consider the concept of infinity.
This PowerPoint helps students to consider the concept of infinity.This PowerPoint helps students to consider the concept of infinity.
This PowerPoint helps students to consider the concept of infinity.christianmathematics
 
Google Gemini An AI Revolution in Education.pptx
Google Gemini An AI Revolution in Education.pptxGoogle Gemini An AI Revolution in Education.pptx
Google Gemini An AI Revolution in Education.pptxDr. Sarita Anand
 
NO1 Top Black Magic Specialist In Lahore Black magic In Pakistan Kala Ilam Ex...
NO1 Top Black Magic Specialist In Lahore Black magic In Pakistan Kala Ilam Ex...NO1 Top Black Magic Specialist In Lahore Black magic In Pakistan Kala Ilam Ex...
NO1 Top Black Magic Specialist In Lahore Black magic In Pakistan Kala Ilam Ex...Amil baba
 
SOC 101 Demonstration of Learning Presentation
SOC 101 Demonstration of Learning PresentationSOC 101 Demonstration of Learning Presentation
SOC 101 Demonstration of Learning Presentationcamerronhm
 
Unit 3 Emotional Intelligence and Spiritual Intelligence.pdf
Unit 3 Emotional Intelligence and Spiritual Intelligence.pdfUnit 3 Emotional Intelligence and Spiritual Intelligence.pdf
Unit 3 Emotional Intelligence and Spiritual Intelligence.pdfDr Vijay Vishwakarma
 
Key note speaker Neum_Admir Softic_ENG.pdf
Key note speaker Neum_Admir Softic_ENG.pdfKey note speaker Neum_Admir Softic_ENG.pdf
Key note speaker Neum_Admir Softic_ENG.pdfAdmir Softic
 
Exploring_the_Narrative_Style_of_Amitav_Ghoshs_Gun_Island.pptx
Exploring_the_Narrative_Style_of_Amitav_Ghoshs_Gun_Island.pptxExploring_the_Narrative_Style_of_Amitav_Ghoshs_Gun_Island.pptx
Exploring_the_Narrative_Style_of_Amitav_Ghoshs_Gun_Island.pptxPooja Bhuva
 
Single or Multiple melodic lines structure
Single or Multiple melodic lines structureSingle or Multiple melodic lines structure
Single or Multiple melodic lines structuredhanjurrannsibayan2
 
Towards a code of practice for AI in AT.pptx
Towards a code of practice for AI in AT.pptxTowards a code of practice for AI in AT.pptx
Towards a code of practice for AI in AT.pptxJisc
 

Recently uploaded (20)

Sociology 101 Demonstration of Learning Exhibit
Sociology 101 Demonstration of Learning ExhibitSociology 101 Demonstration of Learning Exhibit
Sociology 101 Demonstration of Learning Exhibit
 
HMCS Vancouver Pre-Deployment Brief - May 2024 (Web Version).pptx
HMCS Vancouver Pre-Deployment Brief - May 2024 (Web Version).pptxHMCS Vancouver Pre-Deployment Brief - May 2024 (Web Version).pptx
HMCS Vancouver Pre-Deployment Brief - May 2024 (Web Version).pptx
 
On National Teacher Day, meet the 2024-25 Kenan Fellows
On National Teacher Day, meet the 2024-25 Kenan FellowsOn National Teacher Day, meet the 2024-25 Kenan Fellows
On National Teacher Day, meet the 2024-25 Kenan Fellows
 
Python Notes for mca i year students osmania university.docx
Python Notes for mca i year students osmania university.docxPython Notes for mca i year students osmania university.docx
Python Notes for mca i year students osmania university.docx
 
TỔNG ÔN TẬP THI VÀO LỚP 10 MÔN TIẾNG ANH NĂM HỌC 2023 - 2024 CÓ ĐÁP ÁN (NGỮ Â...
TỔNG ÔN TẬP THI VÀO LỚP 10 MÔN TIẾNG ANH NĂM HỌC 2023 - 2024 CÓ ĐÁP ÁN (NGỮ Â...TỔNG ÔN TẬP THI VÀO LỚP 10 MÔN TIẾNG ANH NĂM HỌC 2023 - 2024 CÓ ĐÁP ÁN (NGỮ Â...
TỔNG ÔN TẬP THI VÀO LỚP 10 MÔN TIẾNG ANH NĂM HỌC 2023 - 2024 CÓ ĐÁP ÁN (NGỮ Â...
 
Micro-Scholarship, What it is, How can it help me.pdf
Micro-Scholarship, What it is, How can it help me.pdfMicro-Scholarship, What it is, How can it help me.pdf
Micro-Scholarship, What it is, How can it help me.pdf
 
How to Add New Custom Addons Path in Odoo 17
How to Add New Custom Addons Path in Odoo 17How to Add New Custom Addons Path in Odoo 17
How to Add New Custom Addons Path in Odoo 17
 
Jual Obat Aborsi Hongkong ( Asli No.1 ) 085657271886 Obat Penggugur Kandungan...
Jual Obat Aborsi Hongkong ( Asli No.1 ) 085657271886 Obat Penggugur Kandungan...Jual Obat Aborsi Hongkong ( Asli No.1 ) 085657271886 Obat Penggugur Kandungan...
Jual Obat Aborsi Hongkong ( Asli No.1 ) 085657271886 Obat Penggugur Kandungan...
 
Basic Civil Engineering first year Notes- Chapter 4 Building.pptx
Basic Civil Engineering first year Notes- Chapter 4 Building.pptxBasic Civil Engineering first year Notes- Chapter 4 Building.pptx
Basic Civil Engineering first year Notes- Chapter 4 Building.pptx
 
Understanding Accommodations and Modifications
Understanding  Accommodations and ModificationsUnderstanding  Accommodations and Modifications
Understanding Accommodations and Modifications
 
The basics of sentences session 3pptx.pptx
The basics of sentences session 3pptx.pptxThe basics of sentences session 3pptx.pptx
The basics of sentences session 3pptx.pptx
 
This PowerPoint helps students to consider the concept of infinity.
This PowerPoint helps students to consider the concept of infinity.This PowerPoint helps students to consider the concept of infinity.
This PowerPoint helps students to consider the concept of infinity.
 
Google Gemini An AI Revolution in Education.pptx
Google Gemini An AI Revolution in Education.pptxGoogle Gemini An AI Revolution in Education.pptx
Google Gemini An AI Revolution in Education.pptx
 
NO1 Top Black Magic Specialist In Lahore Black magic In Pakistan Kala Ilam Ex...
NO1 Top Black Magic Specialist In Lahore Black magic In Pakistan Kala Ilam Ex...NO1 Top Black Magic Specialist In Lahore Black magic In Pakistan Kala Ilam Ex...
NO1 Top Black Magic Specialist In Lahore Black magic In Pakistan Kala Ilam Ex...
 
SOC 101 Demonstration of Learning Presentation
SOC 101 Demonstration of Learning PresentationSOC 101 Demonstration of Learning Presentation
SOC 101 Demonstration of Learning Presentation
 
Unit 3 Emotional Intelligence and Spiritual Intelligence.pdf
Unit 3 Emotional Intelligence and Spiritual Intelligence.pdfUnit 3 Emotional Intelligence and Spiritual Intelligence.pdf
Unit 3 Emotional Intelligence and Spiritual Intelligence.pdf
 
Key note speaker Neum_Admir Softic_ENG.pdf
Key note speaker Neum_Admir Softic_ENG.pdfKey note speaker Neum_Admir Softic_ENG.pdf
Key note speaker Neum_Admir Softic_ENG.pdf
 
Exploring_the_Narrative_Style_of_Amitav_Ghoshs_Gun_Island.pptx
Exploring_the_Narrative_Style_of_Amitav_Ghoshs_Gun_Island.pptxExploring_the_Narrative_Style_of_Amitav_Ghoshs_Gun_Island.pptx
Exploring_the_Narrative_Style_of_Amitav_Ghoshs_Gun_Island.pptx
 
Single or Multiple melodic lines structure
Single or Multiple melodic lines structureSingle or Multiple melodic lines structure
Single or Multiple melodic lines structure
 
Towards a code of practice for AI in AT.pptx
Towards a code of practice for AI in AT.pptxTowards a code of practice for AI in AT.pptx
Towards a code of practice for AI in AT.pptx
 

Falaiye mayowa

  • 1. A CONTENT ANALYSIS OF SELECTED JOURNAL PAPERS (Elsevier Publishers as a Case Study) FALAIYE Mayowa Williams TP13/14/H/1016 Department of Computer Science and Engineering Obafemi Awolowo University, Ile-Ife, Osun State, Nigeria Email: mayoasia@yahoo.com / mayowa.w.falaiye@gmail.com Abstract To publish a good paper it must comply with a standard for checking parameters of a good journal with has to do with the five important sections of the paper (title, abstract, introduction, methodology, results and discussions) to ascertain its standardization. Content analysis is the process of collecting data from a published paper using an evaluation criterion and analyzing the data with a view of identifying certain characteristics present within the paper. This paper is aimed at collecting data from five parts of a research paper and using this data to describe the papers and make sound judgments on the contents of the paper. 25 articles collected from Elsevier publishers were analyzed using a content analysis matrix table provided in a research methodology course using tables, graphs and charts. The results of the analysis were presented – most of the papers lacked most of the expected units of each section especially in paper introduction, methodology and results. The ability of authors to present the findings of their study in a clearly defined form will help present better to acceptance of the standard of paper in a study. Keywords: content analysis, research methodology, journal. INTRODUCTION Content analysis is indigenous to communication research and is potentially one of the most important research techniques in the social sciences. It seeks to analyze data within a specific context in view of the meanings someone- a group or a culture-attribute to them (Kippendorff, 1980). Content analysis is a set of procedures for collecting and organizing information in a standardized format that allows analysts to make inferences about the characteristics and meaning
  • 2. of written and other recorded material (Kippendorff, 1980). As the number of articles and papers published by authors increase; the accessibility of papers is important and this has made content analysis useful in making numerical comparison among and within such documents (Harwood et al, 2003). The purpose of this study it to attain a condensed and broad description of the content analysis of journal papers by using criteria defined in the course of CSC 626 – a post graduate course taken by Computer Science, Master’s degree students of Obafemi Awolowo University, Ile-Ife, Osun State, Nigeria. For this study, it is important to answer a number of questions about research papers: What are the components present in a paper? Are these components available in published paper? What is the distribution of occurrence? Based on the answers to these questions can one be able to make certain conclusions on the quality of papers that are published in a specific journal. This research is limited in scope by the number of documents used and the journal from which papers are selected; 25 papers were collected from the Journal of Advances in Engineering Software - open access journals made available to Obafemi Awolowo University, Ile-Ife by Elsevier publishers. In addition, the papers are not referred to explicitly rather using a numeric integer to describe the data as shown in Table A1 in Appendix I. Materials and Methods -This study is necessitated by the need to evaluate the contents of selected research papers via the use of a model provided by Professor Fakorede of the Faculty of Agriculture during the course of CSC626 in the Harmattan semester of the 2013/14 academic session. The data consists of 25 papers selected from the Journal of Advances in Engineering Software (see Table A1 in Appendix IThe most important task is to read and critic the contents of the journal papers and record the findings in in a content analysis matrix table provided in the CSC 626 course as the required criteria/selection model chosen for this study. Each paper was divided into five (5) sections: paper title, abstract, introduction, methodology and results, discussions and references such that each has its own content analysis matrix table. The total score for each paper was recorded with the results expressed as a percentage (see Appendix II for scored of each section). After generating the data from the content analysis tables for each section, the data is analyzed using graphs and charts in order to determine the frequency and proportion of distribution with measures of central tendencies and dispersion (mean and standard deviations) are also calculated where necessary. The results of the methods are then used to make necessary judgments about the contents of the journal papers selected and analyzed for this study. Results and discussions Following the description of the materials and methods and the process required for generating the necessary data needed for analyses. The five (5) contents analyzed in each paper were presented in
  • 3. graphs and tables for easy interpretation of the results. Following is the result gathered from the analyses of the paper. CONTENT ANALYSIS OF PAPER TITLE The paper title is the first section of any paper and consists of four (4) sections namely: brief, catchy, Keywords and Synchronize. To be brief means that the title contains only a few words that cannot be expressed in any lesser way without losing the context of the title; the papers that satisfy the criteria include papers: 3, 4, 5, 7, 8, 10, 12, 13, 15, 16,17,18,20, 21, 23 and 24. To be catchy means to be instantly appealing and easy to remember; the papers that satisfy this criteria include papers: 3, 4, 5, 7, 8, 10, 12, 13, 15, 16, 17, 19, 20, 21, 22, 23, 24 and 25. A keyword means a word or idea that is of great importance; the papers that satisfy the criteria include papers: 2,3,4,5,6,7,8,9,10,11,12,13,15,16,17,18,19,20,21,22,23 and 24. To synchronize means for two things to do/imply the same thing, which in this case are the abstract and the paper title; the papers that synchronize include all 25 papers. Table 1 gives a description of the result of the content analysis of the paper title for all 25 papers while Figure 1 shows the distribution of the number of papers and the percentage of papers which provide the sections described for a paper title. Table 1 Content analysis of paper title Figure 1 Content Number of papers % coverage Brief 16 64 Catchy 18 72 Keyword 22 88 Synchronize 25 100
  • 4. From the results presented above, it can be seen that out of all the 25 papers, 16 papers (64%) have brief titles while the remaining 9 (36%) don’t have brief titles, 18 papers (72%) tiles are catchy while the remaining 7 papers (28%) are not catchy, 22 papers (88%) have keywords while the remaining 3 papers (12%) do not have keywords. It is observed that all 25 papers synchronize with their abstracts. Hence, authors need to be also concerned in making their paper title briefer, catchy and use of appropriate keywords which will also improve the acceptability of such papers. CONTENT ANALYSIS OF PAPER ABSTRACT The abstract is the second section of importance in a paper; it gives a summary of the whole paper and consists of five criteria which include: justification, Objectives, methodology, results and conclusions. The justification gives a description of the motivation for the work and the papers that have objectives include papers: 1, 5,9,13,15,18,20 and 21. The objectives give a description of the things that need to be done or simply the purpose of the work and the papers that have objectives include the papers: 4, 5, 7, 9, 13, 14 and 22. The methodology gives a description of the materials and methods needed for the achievement of the stated objectives and the papers with methodologies includes all the papers. The results give the outcome of the methodology that was used in achieving the objectives and it includes papers: 1,2,3,4,5,6,9,10,11,13,16,18,22 and 25. The conclusion gives a description of the final remarks that were made based on the results of the research work and the papers that were observed to have conclusions include papers: 1,2,3,4,5,6,7,8,9,10,11,12,13,14,15,17,18,19,21,22 and 25. papers (out of 25) % of 25 papers0 10 20 30 40 50 60 70 80 90 100 Brief Catchy Keyword Synchronize Paper Title papers (out of 25) % of 25 papers
  • 5. Table 2 gives a description of the result of the content analysis of the paper title for all 25 papers while Figure 2 shows the distribution of the number of papers and the percentage of papers which provide the sections described for a paper title. Table 2: Content analysis of the paper Abstract papers (out of 25) % of 25 papers Justification 10 40 Objectives 7 28 Methodology 25 100 Results 14 56 Conclusions 21 84 From the results presented above, it can be observed that authors 5,9 and 13 (100%) are able to describe their justification, objectives, methodology, results and conclusion perfectly in the abstract. 10 (40%) papers were observed to have the justification, 7 (28%) papers have objective, 25 (100%) have methodology, 14(60%) have results and 21 (88%) have conclusions of the papers available in the abstract. Abstracts give a summary of the whole paper and it is expected to contain all 5 units described else the essence of the paper is lost as a reader goes through the paper abstract; a lack of important areas limits the reader from finding the paper relevant else, the reader will have to read the whole document to grasp the documented information. Needless to say, a reader does not need to read the whole document when the abstract can be read first.
  • 6. Figure 2 Distribution of the paper abstract contents CONTENT ANALYSIS OF PAPER INTRODUCTION The introduction is the third important part of any research paper. It introduces the paper to the reader and gives an eye opener on the things expected and what should be done; it consists of the following criteria: background information, justification, statement of the problem, research objective(s), scope and limitations and abbreviations and acronyms. The background information gives detailed information on the facts that are needed in order to gain a better understanding of the research area via the definition of important terms and areas of importance, the papers that have a background information of their research include this papers 1,2,3,5,6,7,8,9,10,11,12,13,15,16,18,19,20,21,22,23,24,25. The justification of the research gives the motivation for performing the study/research and the papers discovered to have justifications includes all papers except 8,16,19 and 24. The statement of problem gives an account of the problem that the research intends to solve and most papers addressed the issue of the statement of problem except 2,3,6,7,8,20,23. The research objectives gives a description of the process involved in achieving the stated problems and most papers were discovered to address this issue except 3,6,8,11,15. The research questions are questions that arise as a result of the research objectives of the research and it was discovered that only 7,10 and 12 of the 25 papers was able to address any research question. The research hypothesis is an idea/theory which is used to test the viability of papers (out of 25) % of 25 papers 0 20 40 60 80 100 Justification Objectives Methodology Results Conclusions Abstract papers (out of 25) % of 25 papers
  • 7. the research question and are usually done using statistical tests; it was also discovered that papers 3,5,6,9,11,12,14 and 20 addressed the research hypothesis. Scope and limitations gives a description of the drawbacks or how far the research work was able to go with meeting the stated research objectives and it was discovered that papers: 17 papers (68%) stated the scope and limitation of the research papers. The abbreviations and acronyms involves the description of any word that is abbreviated or first letters of words used to identify long words which may also be technical terms in the knowledge area of the research work, it was discovered that papers: 23 papers addressed the acronyms and abbreviations. Table 3 gives a description of the result of the content analysis of the paper introduction for all 25 papers while Figure 3 shows the distribution of the number of papers and the percentage of papers which provide the sections described for a paper introduction. From the results, it is very clear that all 25 papers consist of research background, justification, problem statement and objectives. Research question scored the lowest score. Table 3 Content analysis of paper introduction Content Number of papers % coverage Background 22 88 Justification 21 84 Problem Statement 18 72 Objectives Questions Hypothesis Scope&Limitations Acroynms & Abbreviations 20 4 8 17 23 80 16 32 68 92
  • 8. Figure 3 Distribution of the paper introduction contents CONTENT ANALYSIS OF PAPER METHODOLOGY The methodology is the fourth part of a paper to be addressed for criticism and it gives a detailed description of how the research is conducted and the tools used in performing the necessary methods. The methodology usually consists of the following: study location, methodology design, data collection, requirement analysis/data analysis, experimental set-up/tools, simulation/implementation, testing/.validation and reproducibility. The study location Table 4 gives a description of the result of the content analysis of the paper methodology for all 25 papers while Figure 4 shows the distribution of the number of papers and the percentage of papers which provide the sections described for a paper methodology. papers (out of 25) % of 25 papers 0 10 20 30 40 50 60 70 80 90 100 Introduction papers (out of 25) % of 25 papers
  • 9. Table 4 Content analysis of paper methodology papers (out of 25) % of 25 papers Study Location 11 44 Method. Design 24 96 Data Collect. 19 76 Req. Analysis or Data Analysis I 24 96 Expet. Set-up or Tools 22 88 Simul. Or Implement. 23 92 Testing/Valid. 15 60 Reprod. 2 8 The results show that all papers have requirement analysis, experimental set-up and simulations/implementations which help to understand the process of methods but 24 (96%) also describe the data collection method used. An average of 18 (72%) gave a description of the study location, testing/validation and are found reproducible; a lack in any of this information affects the acceptability of the results presented in any paper since a description of the process is not enough to accept the results but a description of where data is collected from and the results of the test helps in accepting the results and conclusions presented by the author of the paper. Only 5 (20%) of the papers gave a description of the methodology design which is a summary of the whole methodology process.
  • 10. Figure 4 Distribution of the paper methodology contents Content analysis of paper results, discussions and references The results, discussion and the references are the last part of the paper. They results are usually expressed in Tables, figures and plates and they usually satisfy the following: completeness, sequential, referred to in text, state statistical test used and tally with objectives. All 25 papers were observed to satisfy the completeness of the tables/figures/plates used via titling and numbering, all 25 papers were discovered to be sequential since the numberings were done in the order in which they appear and the 25 papers were all referred to in the text. The statistical test is used to the test that hypothesis stated in the introduction (if any) but, none of the 25 papers stated any statistical test owing to the fact that no hypothesis was tested in the papers. All 25 papers was discovered to have results that were noticed to tally with the stated objectives of the research paper. Table 5 gives a description of the result of the content analysis of the paper results, discussions and references for all 25 papers while Figure 5 shows the distribution of the number of papers and the percentage of papers which provide the sections described for a paper results, discussions and references. papers (out of 25) % of 25 papers 0 10 20 30 40 50 60 70 80 90 100 Methodology papers (out of 25) % of 25 papers
  • 11. Table 5 Content analysis of paper results, discussions and references Number of Papers % coverage Tables and/or figures Table 5: Content analysis of results, discussions and referrences Figure 5 Distribution of the contents for results, discussions and references papers (out of 25) % of 25 papers 0 20 40 60 80 100 Sequen Complet Referredtointext Stattestused Tallywithobj LinkedtoLit Identflaws Impli Summ Tables and/or figures Discussion Ref. in alpha order Results, Discussions and References papers (out of 25) % of 25 papers papers (out of 25) % of 25 papers Tables and/or figures Sequen 25 100 Complet 22 88 Referred to in text 25 100 Stat test used 7 28 Tally with obj 23 92 Discussion Linked to Lit 24 96 Ident flaws 17 68 Impli 24 96 Summ 23 92 Ref. in alpha order 11 44
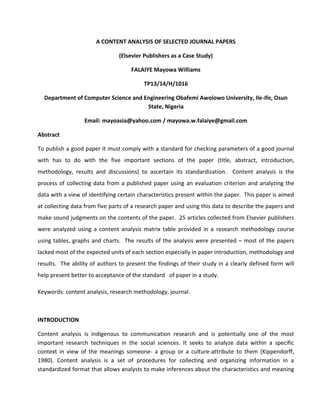
  • 12. The results show that all 25 papers have well-documented tables which satisfy all the requirements for a table except that there was no indication of statistical test used – which is hardly the case in most computer science papers. The tables of results of the 25 papers was observed to tally with the objectives of the paper, there were all shown in sequence, were all referred to within the text of the paper. None of the tables gave a description of the statistical test used – it was indicated in the methodology that no test was stated. Mean and standard deviation of the content analysis After performing the expected analysis of the respective contents of the 5 sections of the 25 papers; it was expedient to observe the central tendencies and the dispersion of the results so as to attain a generalization or a normalization of the data collected from the analysis of the 25 papers. Content mean standard deviation Title 81.78695144 20.95140034 Abstract 80.5727482 21.58613803 Introduction 79.35854497 22.8947105 Methodology 83.06339485 20.37202672 Results, Discussion & References 81.68729785 21.00511447 Table 7 gives a description of the average score for each paper: taking the average score of the 5 sections analyzed after which the mean and the standard deviation of each section was determined. Using the data presented in Table 7; Figure 7 gives a trend of each section (all 5 of them) for all 25 papers showing the distribution of each sections for all 2s papers. The distribution shows clearly the similarities and differences between each individual paper analyzed.
  • 13. Figure 6 Mean and standard deviation of content scores Table 7 Average score for 25 papers Paper Title Abstract Introduction Methodology Results, Discussions and references Paper Title Abstract Introduction Methodology Results, Discussions and references avearge score for each paper 1 25 80 75 87.5 90 71.5 2 50 60 37.5 50 80 55.5 3 100 60 50 87.5 90 77.5 4 100 80 62.5 50 90 76.5 5 100 100 87.5 87.5 90 93 6 50 60 62.5 37.5 80 58 7 100 80 75 87.5 90 86.5 8 100 60 25 62.5 70 63.5 9 50 100 87.5 50 90 75.5 10 100 60 87.5 62.5 80 78 mean standard deviation 0 20 40 60 80 100 Title Abstract Introduction Methodology Results, discussions and references Mean and Standard deviation of each section for the 25 papers mean standard deviation
  • 14. 11 50 60 62.5 87.5 80 68 12 100 40 100 62.5 80 76.5 13 100 100 75 75 70 84 14 25 60 75 87.5 90 67.5 15 100 60 62.5 50 70 68.5 16 100 40 50 62.5 80 66.5 17 100 40 50 50 90 66 18 75 80 75 87.5 100 83.5 19 75 40 50 50 80 59 20 100 40 75 87.5 70 74.5 21 100 60 62.5 87.5 60 74 22 75 80 75 62.5 80 74.5 23 100 20 62.5 50 70 60.5 24 100 60 62.5 62.5 80 73 25 50 60 75 100 70 71 average score for each section 82.29166667 63.33333333 66.14583333 67.70833333 81.25 Std deviation 26.2995564 20.55885859 16.81703006 18.08544535 9.539392014 Conclusions In this study, an attempt has been made to analyze the content of 25 journals selected from the Journal of Advances in Engineering Software by Elsevier publishers. The 25 papers were analyzed for 5 different contents using certain units described for each section as a measure of evaluation. The data collected using the content analysis matrix table were used as primary data for another analysis of the trend and distribution of the contents for each paper. The results were presented and it was discovered that authors need to put more effort into the documentation of their abstract and introduction part of their paper. Although, a good percentage present their abstracts, methodology and results it was however discovered that a good number still deter from this practice while documenting their works. This study is expected to help provide a means of evaluating the kind of papers available for publication by different publishers and may provide a means of recommending journals which have a sound collection of research papers.
  • 15. REFERENCES Harwood, T.G., Garry, T. (2003). An overview of content analysis. The Marketing Review3, 479– 498 Krippendorff, K. (1980). Content Analysis: An Introduction to its Methodology. Sage Publications, Newbury Park.
  • 16. APPENDIX 1 Surname of Student…FALAIYE……………..……………….. Initials…M.W…….. Dept. COMPUTER SCIENCE AND ENGINEERING…. Reg. No. …TP13/14/H/1016… Name of Journal…ADVANCES IN ENGINEERING SOFTWARE…………………………….. Volume……41…………. Year……2010………………… Issue …4, 5, 6………. Table A1 in Appendix 1 Content Analysis of Journal Paper Title Paper Author(s) & Title Paper 1 Nie, H.J.; Hopkins, D.A.; Chen, Y.T. and Hsieh, H.T. Development of an object-oriented finite element program with adaptive mesh refinement for multi-physics applications 1 2 Gurkan Altan and Muzaffer Topcu Thermo-elastic stress of a metal-matrix composite disc under linearly-increasing temperature loading by analytical and FEM analysis 2 3 Abdulkadir Cevik; Tolga Gogus M.; Ibrahim H. Guzelbey and Huzeyin Filiz Soft computing based formulation for strength enhancement of CFRP confined concrete cylinders 3 4 Gasparetto, A. and Zanotto, V. Optimal trajectory planning for industrial robots 4 5 Yongtae Jun and Kulwoon Choi Design of patient-specific hip implants based on 5
  • 17. the 3D geometry of the human femur. 6 Omer Civalek; Armagan Korkmaz and Cigdem Demir Discrete singular convolution approach for buckling analysis of rectangular Kirchhoff plats subjected to compressive loads on two- opposite edges. 6 7 Dahai Guo; Xuedong Yan; Janusz Zalewski and Calude Villiers Visualization of road geometries based on CADD design standards 7 8 Ismail Farajpour Constrained optimization of structures with displacement constraints under various loading conditions. 8 9 Jiaqing Yu; Jianzhong Cha; Yiping Lu; Wensheng Xu and Sobolewski, M. A CAE-integrated distributed collaborative design system for finite element analysis of complex product based on SOOA 9 10 Christine Bersch; Adrian P. Cisilino and Nestor Calvo Topology optimization of three-dimensional load-bearing structures using boundary elements. 10 11 Abdulkadir Cevik; Tolga Gogus M.; Ibrahim H. GuzelbeY and Huzeyin Filiz A new formulation for longitudinally stiffened webs subjected to patch loading using stepwise regression method 11 12 Phill-Seung Lee and Klaus-jurgen Bathe 12
  • 18. The quadratic MITC plate and MITC shell elements in plate bending 13 Wenjun Xu; Zude Zhou and Quan Liu Hybrid one-way delay estimation for networked control system 13 14 Baylar, A. and Batan, M. Usage of artificial intelligence methods in free flowing gated closed conduits for estimation of oxygen transfer efficiency 14 15 Antonio Coronato and Giuseppe De Peitro Formal design and implementation of constraints in software components. 15 16 Granville Sewell Solving PDEs in non-rectangular 3D regions using a collocation finite element method. 16 17 Roberto Augusto Gomez Loenzo; Pedro Daniel Alaniz Lumbreras; Rene de Jesus Romero Troncoso and Gilberto Herrera Ruiz An object-oriented architecture for sensorless cutting force feedback for CNC milling process monitoring and control 17 18 Adel Mellit ANN-based GA for generating the sizing curve of stand-alone photocoltaic systems 18 19 Taner Altunok and Tanyel Cakmak A technology readiness levels (TRLs) calculator software for systems engineering and technology management tool 19 20 David P. Gutzwiller and Mark G. Turner Rapid low fidelity turbomachinery disk optimization 20
  • 19. 21 Fikret Kocabas and Serap Unal Compared techniques for the critical submergence of an intake in water flow 21 22 Andrea Bolognesi; Cristiana Bragalli; Angela Marchi and Sandro Artina Genetic Heritage Evolution by Stochastic Transmission in the optimal design of water distribution networks. 22 23 Shabnam Rezapour and Reza Zanjirani Farahani Strategic design of competing centralized supply chain networks for markets with deterministic demands 23 24 Glodez, Z.; Jezernik, N; Kramberger, J. and Lassen, T. Numerical modelling of fatigue crack initiation of martensitic steel 24 25 Nader Larbi and Jamel Bessrour Measurement and simulation of pollutant emissions from marine diesel combustion engine and their reduction by water injection 25 APPENDIX II Surname of Student…FALAIYE……………..……………….. Initials…M.W…….. Dept. COMPUTER SCIENCE AND ENGINEERING…. Reg. No. …TP13/14/H/1016…
  • 20. Name of Journal…ADVANCES IN ENGINEERING SOFTWARE…………………………….. Volume……41…………. Year……2010………………… Issue …4, 5, 6………. Table A2 Appendix II Content Analysis of Journal Paper Title Paper Brief Catchy Keywords Synchronize Total (max=4) % of total 1 0 0 0 1 1 25 2 0 0 1 1 2 50 3 1 1 1 1 4 100 4 1 1 1 1 4 100 5 1 1 1 1 4 100 6 0 0 1 1 2 50 7 1 1 1 1 4 100 8 1 1 1 1 4 100 9 0 0 1 1 2 50 10 1 1 1 1 4 100 11 0 0 1 1 2 50 12 1 1 1 1 4 100 13 1 1 1 1 4 100 14 0 0 0 1 1 25 15 1 1 1 1 4 100 16 1 1 1 1 4 100 17 1 1 1 1 4 100 18 1 0 1 1 3 75 19 0 1 1 1 3 75 20 1 1 1 1 4 100 21 1 1 1 1 4 100 22 0 1 1 1 3 75 23 1 1 1 1 4 100
  • 21. 24 1 1 1 1 4 100 25 0 1 0 1 2 50
  • 22. Surname of Student…FALAIYE……………..……………….. Initials…M.W…….. Dept. COMPUTER SCIENCE AND ENGINEERING…. Reg. No. …TP13/14/H/1016… Name of Journal…ADVANCES IN ENGINEERING SOFTWARE…………………………….. Volume……41…………. Year……2010………………… Issue …4, 5, 6………. Content Analysis of Abstract of Journal Papers in Computer Science Paper J O M R C Total (max=5) % of total 1 1 0 1 1 1 4 80 2 0 0 1 1 1 3 60 3 0 0 1 1 1 3 60 4 0 1 1 1 1 4 80 5 1 1 1 1 1 5 100 6 0 0 1 1 1 3 60 7 1 1 1 0 1 4 80 8 1 0 1 0 1 3 60 9 1 1 1 1 1 5 100 10 0 0 1 1 1 3 60 11 0 0 1 1 1 3 60 12 0 0 1 0 1 2 40 13 1 1 1 1 1 5 100 14 0 1 1 0 1 3 60 15 1 0 1 0 1 3 60 16 0 0 1 1 0 2 40 17 0 0 1 0 1 2 40 18 1 0 1 1 1 4 80 19 0 0 1 0 1 2 40 20 1 0 1 0 0 2 40 21 1 0 1 0 1 3 60
  • 23. 22 0 1 1 1 1 4 80 23 0 0 1 0 0 1 20 24 0 0 1 0 0 1 20 25 0 0 1 1 1 3 60 J = Justification O = Objective(s) M = Methodology R = Results C = Conclusion
  • 24. Surname of Student…FALAIYE……………..……………….. Initials…M.W…….. Dept. COMPUTER SCIENCE AND ENGINEERING…. Reg. No. …TP13/14/H/1016… Name of Journal…ADVANCES IN ENGINEERING SOFTWARE…………………………….. Volume……41…………. Year……2010………………… Issue …4, 5, 6………. INTRODUCTION Paper B J P O Q H S&L A&A Total (max=8) % of total 1 1 1 1 1 0 0 1 1 6 75 2 1 1 0 1 0 0 0 0 3 37.5 3 1 1 0 0 0 1 0 1 4 50 4 0 1 1 1 0 0 1 1 5 62.5 5 1 1 1 1 0 1 1 1 7 87.5 6 1 1 0 0 0 1 1 1 5 62.5 7 1 1 0 1 1 0 1 1 6 75 8 1 0 0 0 0 0 1 0 2 25 9 1 1 1 1 0 1 1 1 7 87.5 10 1 1 1 1 1 0 1 1 7 87.5 11 1 1 1 0 0 1 0 1 5 62.5 12 1 1 1 1 1 1 1 1 8 100 13 1 1 1 1 0 0 1 1 6 75 14 0 1 1 1 0 1 1 1 6 75 15 1 1 1 0 0 0 1 1 5 62.5 16 1 0 1 1 0 0 0 1 4 50 17 0 1 1 1 0 0 0 1 4 50 18 1 1 1 1 0 0 1 1 6 75
  • 25. B=Background Information J=Justification P=Statement of the Problem O=Research Objective(s) Q=Research Questions H=Research Hypothesis (es) S&L=Scope and Limitations A&A=Abbreviations and Acronyms 19 1 0 1 1 0 0 0 1 4 50 20 1 1 0 1 0 1 1 1 6 75 21 1 1 1 1 0 0 0 1 5 62.5 22 1 1 1 1 0 0 1 1 6 75 23 1 1 0 1 1 0 0 1 5 62.5 24 1 0 1 1 0 0 1 1 5 62.5 25 1 1 1 1 0 0 1 1 6 75
  • 26. Surname of Student…FALAIYE……………..……………….. Initials…M.W…….. Dept. COMPUTER SCIENCE AND ENGINEERING…. Reg. No. …TP13/14/H/1016… Name of Journal…ADVANCES IN ENGINEERING SOFTWARE…………………………….. Volume……41…………. Year……2010………………… Issue …4, 5, 6………. METHODOLOGY Paper SL MD DC RA/DA ES S/I T/V R Total %Total 1 1 1 1 1 1 1 1 0 7 87.5 2 1 1 0 1 1 0 0 0 4 50 3 1 1 1 1 1 1 1 0 7 87.5 4 0 0 0 1 1 1 1 0 4 50 5 1 1 1 1 1 1 1 0 7 87.5 6 0 1 1 1 0 0 0 0 3 37.5 7 1 1 1 1 1 1 1 0 7 87.5 8 0 1 1 1 0 1 1 0 5 62.5 9 0 1 0 1 1 1 0 0 4 50 10 0 1 1 1 1 1 1 0 6 62.5 11 1 1 1 1 1 1 1 0 7 87.5 12 0 1 1 1 0 1 1 0 5 62.5 13 0 1 1 1 1 1 1 0 6 75 14 0 1 1 1 1 1 1 1 7 87.5 15 0 1 0 1 1 1 0 0 4 50 16 0 1 1 1 1 1 0 0 5 62.5 17 0 1 0 1 1 1 0 0 4 50 18 1 1 1 1 1 1 1 0 7 87.5 19 0 1 0 1 1 1 0 0 4 50
  • 27. 20 1 1 1 1 1 1 1 0 7 87.5 21 1 1 1 1 1 1 1 0 7 87.5 22 1 1 1 1 1 1 0 0 6 62.5 23 0 1 1 0 1 1 0 0 4 50 24 0 1 1 1 1 1 0 0 5 62.5 25 1 1 1 1 1 1 1 1 8 100 Study Location (SL) - where, population, sample size etc. Methodology Design (MD) - UML, architecture model etc. Data Collection (DC) – means of collecting data (if any) Requirement Analysis or Data Analysis (RA/DA) – method of gathering information on requirements/initial data analysis performed Experimental Set-up/Tools (ES) – software, hardware, development environment etc. Simulation/Implementation(S/I) – the technical solution provided Testing/Validation (T/V) – the necessary statistical tests used/test performed on the implemented system Reproducibility(R) –possibility of re-creation
  • 28. Surname of Student…FALAIYE……………..……………….. Initials…M.W…….. Dept. COMPUTER SCIENCE AND ENGINEERING…. Reg. No. …TP13/14/H/1016… Name of Journal…ADVANCES IN ENGINEERING SOFTWARE…………………………….. Volume……41…………. Year……2010………………… Issue …4, 5, 6………. RESULTS, DISCUSSIONS & REFERENCES Paper Tables and/or figures Discussion Ref. in alpha order Total (max=10) % of TotalSequen Complet Referred to in text Stat test used Tally with obj Linked to Lit Ident flaws Impli Summ 1 1 1 1 0 1 1 1 1 1 1 9 90 2 1 1 1 0 1 1 1 0 1 1 8 80 3 1 1 1 1 1 1 1 1 1 0 9 90 4 1 1 1 0 1 1 1 1 1 1 9 90 5 1 1 1 0 1 1 1 1 1 1 9 90 6 1 1 1 0 1 1 1 1 1 0 8 80 7 1 1 1 0 1 1 1 1 1 1 9 90 8 1 0 1 0 1 1 0 1 1 1 7 70 9 1 1 1 0 1 1 1 1 1 1 9 90 10 1 1 1 0 1 1 1 1 1 0 8 80 11 1 1 1 0 1 1 1 1 1 0 8 80 12 1 1 1 1 0 1 1 1 1 0 8 80 13 1 1 1 0 1 1 0 1 1 0 7 70 14 1 1 1 1 1 1 0 1 1 1 9 90 15 1 1 1 0 1 1 0 1 1 0 7 70 16 1 1 1 0 1 1 1 1 1 0 8 80 17 1 1 1 1 1 1 0 1 1 1 9 90
  • 29. 18 1 1 1 1 1 1 1 1 1 1 10 100 19 1 1 1 0 1 1 0 1 1 1 8 80 20 1 1 1 0 1 1 1 1 0 0 7 70 21 1 1 1 1 0 0 0 1 1 0 6 60 22 1 0 1 1 1 1 1 1 1 0 8 80 23 1 0 1 0 1 1 1 1 1 0 7 70 24 1 1 1 0 1 1 1 1 1 0 8 80 25 1 1 1 0 1 1 0 1 1 0 7 70 Sequen - Tables and figures are numbered sequentially as they are presented in the text Complet – Tables and figures are complete. For both of them, complete means they are numbered, with self- explanatory titles and units of measures as necessary. For tables, entries are well aligned, each column has a heading and unit of measure as necessary, no vertical or horizontal lines, footnotes are supplied where needed and statistical test of hypothesis clearly indicated. Referred to in text – The table or figure is not just put in the paper, but is presented to the reader by the author calling attention of the reader to some specific points on the table or figure Stat test used – The author(s) clearly applied statistical test such as LSD, DNMRT, SE, SEM, t-test, F-test, Chi-square test. In figures, error bars are included for hypothesis testing. Tally with obj. – tables, figures and manner of presentation of results tally well with the objectives of the study Linked to Lit. – The discussion must link the results to the existing literature related to the subject of the research. Indenti flaws – Identifies the flaws in the research; explains results that seem to differ what is generally believed as the state of knowledge in the subject-matter area, proposes possible reasons for such deviations. Impli – Implication or practical application of the results is discussed. Summary – The study provides a summary highlighting major findings. This MUST be different from the abstract. Ref. in alpha order – References are listed in alphabetical order, or are numbered as they occur in the text if number system are used.