Model Call Girl in Bikash Puri Delhi reach out to us at 🔝9953056974🔝
Journal of Adhesive Dentistry
1. n
fo r
Effect of Photoactivation Mode on the Hardness
and Bond Strength of Methacrylate- and Silorane
Monomer-based Composites
William C. Brandta / Renata F. S. Lacerdab / Eduardo J. C. Souza-Juniorc /
Mario A. C. Sinhoretid
Purpose: To evaluate the Knoop hardness (KH) and the bond strength (BS) at the tooth/restoration interface of
conventional methacrylate- (Filtek Supreme) and silorane-based (Filtek P90) composites photoactivated by different methods using an LED Freelight 2.
Materials and Methods: Bond strength was tested in a universal testing machine by the “push-out” test in restored cavities measuring 2 × 1.5 × 2 mm with a C-factor of 2.2, prepared in 60 bovine teeth. To restore the
cavities, the respective adhesive system of each composite was used (Single Bond 2 and P90 system adhesives). The composites were photoactivated by 3 different methods: continuous light: 40 s at 1000 mW/cm2;
soft-start: 10 s at 150 mW/cm2 + 38 s at 1000 mW/cm2; pulse delay: 5 s at 150 mW/cm2, followed by a 3-min
wait (without photoactivation) and 39 s at 1000 mW/cm2. Before the push-out test was performed, the KH was
analyzed at the top and bottom of the restorations. Data were statistically anaylzed using ANOVA and Tukey’s
test.
Results: The photoactivation methods produced no differences in BS or KH in the same composite, while Filtek
P90 (28.0 MPa) showed higher BS values than Filtek Supreme (22.3 MPa) and a lower KH.
Conclusion: The composite Filtek P90 was capable of increasing bond strength, but presented lower Knoop
hardness.
Keywords: resin composite, photoactivation, bond strength, silorane, methacrylate.
J Adhes Dent 2012;14:7pages
XXX
L
ight-cured resin composites are commonly used in
daily clinical practice to restore anterior and posterior teeth because of their many advantages: good
esthetics, bonding to tooth structure, and mechanical
properties. However, these materials undergo significant
volumetric shrinkage when polymerized.9 In vitro measurements of polymerization shrinkage of resin composites range from 0.9% to 2.8% by volume.18
a
Professor, Department of Prosthodontics, Dentistry School, University of Taubaté, Taubaté, SP, Brazil. Idea, experimental design, hypothesis, performed
push-out test, wrote manuscript.
b
MS Student, Department of Prosthodontics, Dentistry School, University of
Taubaté, Taubaté, SP, Brazil. Cleaned and preparated bovine teeth, performed hardness test.
c
PhD Student, Department of Restorative Dentistry, Dental Materials Area,
Piracicaba School of Dentistry, State University of Campinas, SP, Brazil. Contributed substantially to discussion and review.
d
Professor, Department of Restorative Dentistry, Dental Materials Area, Piracicaba School of Dentistry, State University of Campinas, SP, Brazil. Idea,
hypothesis, statistical analysis.
Correspondence: William Cunha Brandt, Department of Prosthodontics, Dentistry School, University of Taubaté, UNITAU, Rua Expedicionário Ernesto
Pereira, 110, 12020-330, Taubaté, SP, Brazil. Tel: +55-12-3625-4149, Fax:
+55-12-3632-4968. e-mail: williamcbrandt@yahoo.com.br
Vol 14, No X, 2012
Submitted for publication: 17.05.11; accepted for publication: 28.12.11
As part of bonded preparations, the contraction of
these composites induces the development of mechanical stress inside the material.9 The stress is transmitted
via bonded interfaces to tooth structures. In light-curing
composites, fast conversion induces a fast increase in
composite stiffness, causing high shrinkage stress at
the interface.4 Such stress may disrupt the bond between the composite and the cavity walls or may even
cause cohesive failure of the restorative material or the
surrounding tooth tissue, in addition to postoperative
sensitivity.28
The rate of monomer conversion depends upon many
factors, such as photoinitiator chemistry, filler morphology, pigments, and irradiance (mW/cm2). The role
played by the irradiance applied to the composite is fundamental, because it is a factor that can be controlled by the
operator through modulated photoactivation methods, as
opposed to the other factors just mentioned. The higher
the irradiance is, the faster the monomer conversion and
the higher the stress generation. Photoactivation using
low irradiance could reduce the stress, because it would
allow flow during the earlier stages of polymerization and
enable a certain degree of polymer chain relaxation before
reaching the rubbery stage.4,11,27
1
ot
Q ui
by N
ht
pyrig
No Co
t fo
rP
ub
lica
tio
n
te
ss e n c e
2. ot
n
fo r
2
Q ui
Studies on alternative photoactivation methods have
shown the beneficial effects of modulated polymerization, including the decrease of shrinkage stress. Many
photoactivation methods, such pulse-delay and soft-start
modes, have been examined for their ability to reduce the
shrinkage stress of dental composites.1,4
Modulation of the light energy, as in the soft-start and
pulse-delay methods, has been shown to be effective
in decreasing the shrinkage stress of dental composite
polymerization, but its clinical use is difficult, because it
increases the clinical time and is dependent on the irradiance of the light-curing unit, which the dentist does not
usually know. Although manufacturers have incorporated
soft-start mode in the light-curing units (LCUs), they have
not increased the total curing time, wich can cause an
incomplete polymerization of composite resin. Moreover,
these methods can reduce the stress, but they do not
reduce the final shrinkage of the material.1,4,9,27
Therefore, with the objective of decreasing polymerization shrinkage and, consequently, the stress generated
at the tooth/restoration interface, new monomers have
been studied and introduced into the composition of dental composites. The monomers bis-GMA, bis-EMA, UDMA,
and TEG-DMA can be substituted by alternative monomers
that have low polymerization shrinkage.10,21,29
Recently, a silorane-based composite (Filtek P90), a
synthesized monomer starting from oxirane and siloxane,
was introduced on the market. Silorane-based composites differ from the methacrylate-based composites due
to the polymerization process that occurs via a cationic
ring-opening reaction, which decreases the volumetric
contraction of the composite when compared with other
methacrylate-based composites, in which polymerization proceeds by addition.29 Another difference between
silorane-based composites and methacrylate-based
composites is related to the adhesive system used. The
adhesives currently available on the market have been
developed for traditional methacrylate materials and will,
therefore, lead to insufficient results in combination with
Filtek P90 restorative.29
When methacrylate monomers are replaced by silorane,
not only can the polymerization shrinkage be reduced, but
also the stress caused by it.12,29 Thus, many problems
related to composite restorations, such as microleakage,
marginal staining, secondary caries, and postoperative
sensitivity, can be overcome.5
However, few studies have verified the effectiveness
of silorane-based composites regarding their properties
and benefits in terms of bond strength when different
photoactivation methods were used. Therefore, the aim
of this study was to evaluate the Knoop hardness and
bond strength between the tooth and restoration of conventional methacrylate- and silorane-based composites
photoactivated by different methods. The bond strength
was evaluated with the push-out test, which is very useful
for verifying the effect of polymerization shrinkage on composite restorations and its influence on bond strength.15
Knoop hardness was performed to indirectly assess the
degree of conversion of composite restorations.24 Therefore, because of the difference in composition between
by N
ht
Brandt et al
pyrig
No Co
t fo
rP
ub
li
the composite resins analyzed, they may have differentcatio
n
te
behaviors. Thus,the hypotheses tested were:
ss e n c e
1. The photoactivation methods can influence the tooth/
restoration bond strength for restorations made with
a methacrylate-based composite (Filtek Supreme),
but not for restorations made with a silorane-based
composite (Filtek P90);
2. The silorane-based composite can produce higher
tooth/restoration bond strength than the methacrylate-based composite, regardless of the photoactivation method used;
3. The methacrylate-based composites will obtain higher
Knoop hardness values than silorane-based composites, regardless of the photoactivation method used.
MATERIALS AND METHODS
Restorative Procedures
Sixty bovine incisors were obtained, cleaned, and stored
in 0.5% chloramine-T solution at 4°C for a week. After
removing the root portions, the buccal aspects were
wet ground with 400-, 600- and 1200-grit SiC abrasive
papers to obtain flat surfaces in dentin. Standardized
conical cavities (approximately 2 mm top diameter ×
1.5 mm bottom diameter × 2 mm height) were then
prepared, using #3131 diamond burs (KG Sorensen; Barueri, SP, Brazil) at high speed under air-water cooling. A
custom made preparation device allowed the cavity dimensions to be standardized. A digital caliper (Mitutoyo;
Kawasaki, Japan) was used to check the dimensions
of the cavities. The burs were replaced after every five
preparations. In order to expose the bottom surface of
the cavities, the lingual aspects were ground following
the same procedure described for flattening the buccal
aspects. By following these procedures, a cavity with
a C-factor of 2.2 was obtained, according to equation
1. The adhesive systems Single Bond 2 (3M ESPE; St
Paul, MN, USA, lot 8RW) and P90 System Adhesive (3M
ESPE, lots 7AF and 7AL) were then applied to the cavities, according to the manufacturer’s instructions. The
specimens were placed on a glass slab and the restorative procedures were carried out using the resin composites Filtek Supreme (3M ESPE, shade A3, lot 7KY)
and Filtek P90 (3M ESPE, shade A3, lot 8BL), which
were bulk inserted into each cavity from its wider side.
Table 1 shows the composition of the materials used.
Different photoactivation procedures, as described in
Table 2, were tested. For each method, 10 specimens
were prepared. Prior to the polymerization procedures,
the output power of the LED FreeLight 2 (3M ESPE) was
measured with a calibrated power meter (Ophir Optronics; Danvers, MA, USA), and the diameter of the lightguide tip was checked with a digital caliper (Mitutoyo).
Light irradiance (mW/cm2) was computed as the ratio
of the output power to the area of the tip. Different
polymerization times were used in order to maintain a
total radiant exposure of approximately 40 J/cm2 for all
samples. Irradiance at high light intensity (1000 mW/
cm2) was carried out with the light-guide tip positioned
The Journal of Adhesive Dentistry
3. Table 1 Composition of the composites and adhesive systems employed (manufacturer information)
n
fo r
Product
Composition
Photoinitiator
Filtek P90
Silorane resin and 76% by weight (mean: 0.47 μm) quartz and yttrium fluoride
Camphorquinone, iodonium
salt and electron donor
P90 self-etching primer
HEMA, bis-GMA, water, ethanol, phosphoric acid-methacryloxyhexylesters,
silane-treated silica, 1,6-hexanediol dimethacrylate, copolymer of acrylic and
itaconic acid, (dimethylamino)ethyl methacrylate
Camphorquinone, phosphine oxide
P90 Bond agent
Substituted dimethacrylate, silane-treated silica, TEG-DMA, phosphoric acid
methacryloxy-hexylesters, 1,6- hexanediol dimethacrylate
Camphorquinone
Filtek Supreme
Bis-GMA, bis-EMA, UDMA, TEG-DMA, 72.5% by weight (mean: 75 nm) silica
nanofiller and 0.6/1.4 μm clusters of silica
Camphorquinone and electron donor
Single Bond 2
Ethyl alcohol, silane-treated silica (nanofiller), bis-GMA, 2-hydroxyethyl
methacrylate, glycerol 1,3-dimethacrylate, copolymer of acrylic and itaconic
acids, water, diurethane dimethacrylate
Camphorquinone
Bis-EMA: ethoxylated bisphenol A dimethacrylate; bis-GMA: bisphenol A diglycidyl ether dimethacrylate; TEG-DMA: triethylene glycol dimethacrylate; HEMA:
2-hydroxyethyl methacrylate; UDMA: urethane dimethacrylate.
directly on the restoration, which had been previously
covered with a polyester strip. To produce an output of
150 mW/cm2, a standard black acrylic cylinder separator was used to allow the light-guide tip to be positioned
1.3 cm away from the restoration surface, and the irradiance was confirmed with the power meter. The different
times of photoactivation were controlled with a digital
watch. Additionally, the light spectrum profile emitted by
the curing unit was analyzed with a computer-controlled
spectrometer (USB 2000, Ocean Optics; Dunedin, FL,
USA).
Equation 1:
bonded area (π/2) × h × (D+d) ,
C-factor =
=
unbonded area
π(D/2)2 + π(d/2)2
Table 2 Description of the photoactivation methods
Photoactivation
method
Exposure protocol
Continuous light
1000 mW/cm2 for 40 s
Soft-start
150 mW/cm2 for 10 s + 1000 mW/cm2
for 38 s
Pulse-delay
150 mW/cm2 for 5 s (3 min without
photoactivation) + 1000 mW/cm2 for 39 s
where: h is the height of the cavity, D is the diameter of
the top and d is the diameter of the bottom surface.
Hardness Measurements
After light-curing procedures, the specimens were stored
in distilled water at 37°C for 24 h. Thereafter, both the
top and bottom surfaces were wet-polished with 1200grit SiC paper to obtain a flat surface. Knoop hardness
measurements were taken on both surfaces using an
indenter (HMV-2, Shimadzu; Tokyo, Japan) under a 0.49
N load (equivalent to 50 gf) for 15 s. Five readings were
performed for each surface. The Knoop hardness number (KHN, Kgf/mm2) for each surface was recorded as
the mean of the five indentations. Data were submitted
to three-way ANOVA (resin composite vs photoactivation
method vs surface) followed by Tukey’s test (α = 0.05).
Push-out Test
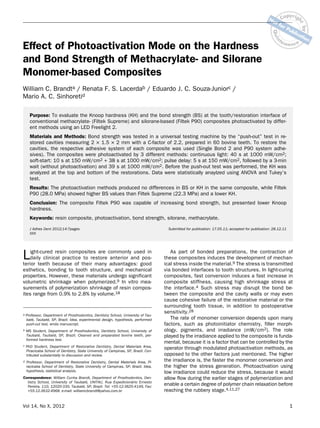
The push-out test (Fig 1) was performed in a universal testing machine (model 4411, Instron; Canton,
MA, USA). An acrylic device with a central orifice was
adapted to the base of the machine. Each specimen
was placed in the device with the top of its cavity
against the acrylic surface. The bottom surface of the
Vol 14, No X, 2012
C
B
A
D
E
F
Fig 1 Schematic representation of the push-out test. A: tooth
crown; B: preparation made using a specialized device on the
buccal face; C: lateral view of the cavity; D: lateral view of
the cavity with the lingual face ground; E: lateral view of the
restored specimen (2.0 mm in height, buccal diameter 2.0
mm, lingual diameter 1.5 mm); F: lateral view of the specimen
showing the direction of specimen push-out.
3
ot
Q ui
by N
ht
pyrig
No Co
t fo
Brandt et al
rP
ub
lica
tio
n
te
ss e n c e
4. Q ui
by N
ht
pyrig
No Co
t fo
Brandt et al
rP
ub
l
Table 3 Means (standard deviations) for top and bottom hardness (KHN, Kgf/mm2) of the resin composites Filtek icatio
n
te
Supreme and Filtek P90
ss e n c e
fo r
Region
Continuous light
Soft-start
Pulse delay
Filtek Supreme
Top
58.4 (3.6) A,a
61.4 (6.3) A,a
62.7 (3.0) A,a
Bottom
61.2 (3.4)
A,a
59.7 (4.8) A,a
63.9 (2.6) A,a
Top
42.8 (6.2) A,b
41.5 (4.5) A,b
38.6 (3.7) A,b
Bottom
40.0 (3.0)
A,b
40.6 (3.4) A,b
ot
n
Resin composite
40.7 (2.7) A,b
Filtek P90
Means followed by different superscript capital letters in the same line and small letters in the same column are significantly different (p 0.05).
Table 4 Means (standard deviations) for push-out test
(MPa)
Compositon
Continuous
light
Soft-start
Pulse delay
Filtek
Supreme
22.7 (9.4)
A,b
23.0 (7.9) A,b
21.1 (7.6) A,b
Filtek P90
29.4 (9.0)
A,a
26.9 (7.3) A,a
27.3 (4.8) A,a
Means followed by different superscript capital letters in the same line
and small letters in the same column are significantly different (p 0.05).
restoration was then loaded with a 1-mm-diameter cylindrical plunger at a crosshead speed of 0.5 mm/min
until failure of the tooth/composite bond in the lateral
walls of the cavity. The plunger tip was positioned so
that it touched only the filling material, without stressing
the surrounding walls. The load required for failure was
recorded by the testing machine and transformed into
MPa taking the area of each cavity into account. Data
were submitted to two-way ANOVA (resin composite vs
photoactivation method) and Tukey’s test (α = 0.05).
After testing, the fractured specimens were examined
using a stereomicroscope (Carl Zeiss; Manaus, AM, Brazil) at a magnification of 40X. Their failure modes were
classified as follows: adhesive failure, cohesive failure
within the composite or mixed failure involving adhesive, dentin and composite. Additionally, representative
fractured specimens were sputter coated with gold and
examined by SEM (JSM 5600LV, JEOL; Peabody, MA,
USA).
RESULTS
The Knoop hardness assessment means are summarized in Table 3. For top and bottom hardness, irrespective of the light-curing method, no significant differences
were detected. On the other hand, significant differences were detected between Filtek Supreme and Filtek
P90 for both top and bottom surfaces (p 0.05). Filtek
Supreme showed higher Knoop hardness means than
Filtek P90.
4
The push-out test values are shown in Table 4. Irrespective of the light-curing method, no significant differences
were detected in the bond strength. On the other hand,
significant differences were detected between the bond
strengths of Filtek Supreme and Filtek P90 (p 0.05).
Filtek P90 showed higher bond strength values than Filtek
Supreme.
Figures 2 and 3 depict the percentage of failure modes
in the push-out test for the resin composites Filtek Supreme and Filtek P90, respectively. For both Filtek Supreme and Filtek P90 photoactivated with continuous
light, more adhesive failures occurred. For soft-start and
pulse-delay photoactivation, adhesive failure was also the
most frequently observed mode, but with an increase in
the percentage of mixed and cohesive failure compared
to continuous-light photoactivation.
DISCUSSION
The push-out test is generally used to evaluate the
bond strength of endodontic cements in the radicular
dentin.17,22 However, in the present study, the pushout test was adapted to evaluate the bond strength
of restorative composites in a simulated Class I cavity.4,14,15,19
Other bond strength tests, eg, shear bond strength,
tensile bond strength, microshear bond strength, and
microtensile bond strength, are usually carried out to
evaluate the bond strength of resin composites. However,
these tests are generally performed on flat surfaces. In
this situation, the C-factor is very low and the development
of shrinkage stress is not directed to the bonding interface. The advantage of using the push-out test was that
the bond strength could be evaluated in a high C-factor
cavity (2.2), with high stress generation directed to the
bonding area.13 The entire bonding area was submitted
to the compressive force at the same time, allowing the
push-out bond strength to be evaluated in a cavity. In addition, the reliability of the push-out test was confirmed
by low variability of the data, since the results showed low
standard deviations.
The polymerization shrinkage of dental composites is
still the main cause of flaws in restorations. The shrinkage of the material can cause postoperative sensitivity
The Journal of Adhesive Dentistry
5. n
100%
fo r
90%
80%
70%
60%
Cohesive
50%
Mixed
40%
Adhesive
30%
20%
10%
Fig 2 Percentage of failure modes
using the push-out test for the resin
composite Filtek Supreme.
0%
Continuous light
Soft-start
Pulse delay
100%
90%
80%
70%
60%
Cohesive
50%
Mixed
40%
Adhesive
30%
20%
10%
Fig 3 Percentage of failure modes
using the push-out test for the resin
composite Filtek P90.
0%
Continuous light
and/or debonding, and consequently, marginal staining,
microleakage, and secondary caries.5 Thus, numerous
researchers have endeavored to reduce the shrinkage
stress with the objective of reducing the problems caused
by polymerization shrinkage, which is inherent to the material.1,4,6,27
One way to reduce the shrinkage stress is through
modulation of the light energy. Photoactivation methods
such as soft-start and pulse delay employ lower initial irradiation, thus decreasing the initial polymerization rate
of the composite and prolonging the viscous-elastic stage
of polymerization. This extends the viscous-elastic stage,
that is, more time is allowed for the composite to flow before reaching the rubbery stage. However, there are other
factors that influence stress generation. In addition to
Vol 14, No X, 2012
Soft-start
Pulse delay
decreasing the light energy, and consequently, decreasing
the rate of polymerization, the C-factor and volume of the
material are very important factors.3
In the present study, the different photoactivation methods did not produce differences in bond strength. Consequently, the first hypothesis was rejected. One of the reasons for this could be the small volume of material used.
Although the cavity had a high C-factor (2.2), it was equivalent to the use of a single increment (with a maximum thickness of 2 mm), which was probably not enough to create
differences in the bond strength.3 In the methacrylatebased resin composite (Filtek Supreme), the generation
of radical species is achieved by a two-component system
consisting of camphorquinone (CQ), which is the actual
photoinitiator, and a tertiary amine responsible for the
5
ot
Q ui
by N
ht
pyrig
No Co
t fo
Brandt et al
rP
ub
lica
tio
n
te
ss e n c e
6. ot
n
fo r
6
Q ui
hydrogen transfer reaction. In contrast, photoactivation in
the silorane-based composite (Filtek P90) is achieved with
a three-component initiating system consisting of camphorquinone, an iodonium salt, and an electron donor. In
spite of the inclusion of the iodonium salt to increase the
rate of polymerization, Filtek P90 still possesses a reduced
initial speed of polymerization reaction when compared
with traditional composites.29 Thus, it could be that the
modification of curing mode neither effectively interfered
in the polymerization of composites Filtek P90 and Filtek
Supreme nor increased the bond strength values.
Another fact is related to LCU used. The LED curing unit
FreeLight 2 emits light in the region of greater absorption
of the photoinitiator CQ. This good correlation between
the spectrum of emission of the LCU and the spectrum of
absorption of CQ may have provided a sufficient quantity
of protons to impair the decrease of the polymerization
rate of the composites used, the same as using a low initial irradiance. Because of this, the rate of polymerization
may not be sufficiently reduced, thus not prolonging the
viscous-elastic stage of polymerization, and not allowing
more time for the composite to flow before reaching the
rubbery stage. This might explain the absence of differences in the bond strength values.
Many studies demonstrated that the modulation of
the light energy could increase the bond strength values
in composite resin restorations, mainly when a halogen
LCU was used.4,9,11 When an LED light-curing unit is used
instead of a halogen LCU, those benefits are decreased,
or even lost, due to better correspondence between the
light-emission spectrum of LED LCUs and the light absorption spectrum of CQ, the most common photoinitiator.7,27
Differences in the degree of conversion may also influence the bond strength, because if a photoactivation
method produces a low degree of conversion, low polymerization shrinkage results, which improves the bond strength
values. However, the Knoop hardness at the top and bottom
of the samples showed no differences among the different
photoactivation methods within the same composite. In this
study, Knoop hardness was an indirect measure of the curing extent or degree of conversion.24 Lower values of Knoop
hardness or degree of conversion can influence not only the
properties of the material, but also the bond strength values, because a composite restoration with a lower degree
of conversion possesses low contraction and consequently,
lower shrinkage stress which can improve the bond strength
values. The different irradiances in the modulated groups
were compensated by the long light-exposure time (mW/
cm2 × time in seconds) to maintain the total radiant exposure of approximately 40 J/cm2 for all samples. This result
is in agreement with those of previous studies.4,8,28
Although the bond strength values showed no differences among the different photoactivation methods,
there was a decrease in the prevalence of adhesive failures when soft-start and pulse-delay modes were used
instead of continuous light. The decrease in adhesive failures could be an indication of a better adaptation of the
composite to the cavity walls, consequently increasing the
prevalence of mixed and even cohesive failures, in spite of
not being sufficient to increase the bond strength values.
by N
ht
Brandt et al
pyrig
No Co
t fo
rP
ub
li
Although the Knoop hardness values did not differcatio
te
between the photoactivation methods, another explana-e n
ss e n c
tion for the higher prevalence of failure within the composite may be due to lower mechanical properties for
composites photoactivated with soft-start and pulse-delay
modes. Some studies have shown that these photoactivation methods produce polymers with lower cross-linking
density, which consequently affects their mechanical
properties.4 Composite Filtek P90 showed higher bond
strength values than Filtek Supreme. Thus, the second
null hypothesis was accepted.
The silorane network is generated by the cationic
ring-opening polymerization of the cycloaliphatic oxirane
moieties, which are known for their low shrinkage and
low polymerization stress. The low polymerization shrinkage and shrinkage stress can lead to an increase in the
bond strength.4 The failure mode also showed differences
between Filtek Supreme and Filtek P90 (Figs 2 and 3).
Composite Filtek P90 yielded a larger number of cohesive
failures. This might have occurred due to the lower stress
caused by Filtek P90, better adaptation between the composite and the cavity walls, and therefore a better bond
between the tooth/restoration was obtained, producing a
bond that was stronger than the cohesive strength of the
material. The Knoop hardness results support this explanation: Filtek P90 presented lower mean Knoop hardness values than did Filtek Supreme, which could suggest reduced
mechanical properties and therefore an increase in cohesive failures. Thus, the third hypothesis was accepted.
This higher bond strength values of Filtek P90 in relation to Filtek Supreme could also be a result of better
monomer cross-linking in the case of Filtek Supreme, as
indicated by the higher Knoop hardness. Better crosslinking is known to result in a higher modulus of elasticity,
which in turn increases shrinkage stresses, thus interfering with the quality of the bond.29 An increased rigidity
may also directly influence the bond strength test itself,
in that it promotes stress formation along the adhesive
interface during the debonding test.16
Different adhesive systems were used. Filtek P90 has
its own adhesive system, because it possesses a different composition than the methacrylate-based composites
such as Filtek Supreme. The P90 system adhesive is a
self-etching adhesive, which differs from Single Bond 2 –
an etch-and-rinse adhesive – used with Filtek Supreme.
The use of different adhesive systems might have contributed to the differences found in the bond strength values.
Many studies show differences in the hybrid layer formed
by self-etching adhesives and etch-and-rinse adhesives.
In general, self-etching adhesives form a less pronounced
hybrid layer than do etch-and-rinse adhesives.25 However,
bond strength tests show similar results between them.2
As mentioned earlier, the use of different adhesive
systems influenced the results, which should be considered when comparing the results of the two restorative
systems investigated. However, as the P90 System Adhesive was developed for use with Filtek P90, it is difficult
to compare it with Filtek Supreme.29 The silorane-based
composite Filtek P90 presented lower Knoop hardness
that the methacrylate-based composite Filtek Supreme,
The Journal of Adhesive Dentistry
7. Vol 14, No X, 2012
fo r
1. Alonso RC, Cunha LG, Correr GM, Cunha Brandt W, Correr-Sobrinho L,
Sinhoreti MA. Relationship between bond strength and marginal and
internal adaptation of composite restorations photocured by different
methods. Acta Odontol Scand 2006;64:306-313.
2. Bradna P, Vrbova R, Dudek M, Roubickova A, Housova D. Comparison of
bonding performance of self-etching and etch-and-rinse adhesives on
human dentin using reliability analysis. J Adhes Dent 2008;10:423-429.
3. Braga RR, Boaro LC, Kuroe T, Azevedo CL, Singer JM. Influence of cavity
dimensions and their derivatives (volume and C-factor) on shrinkage
stress development and microleakage of composite restorations. Dent
Mater 2006;22:818-823.
4. Brandt WC, de Moraes RR, Correr-Sobrinho L, Sinhoreti MA, Consani S.
Effect of different photo-activation methods on push out force, hardness and cross-link density of resin composite restorations. Dent Mater
2008;24:846-850.
5. Burke FJ, Crisp RJ, James A, Mackenzie L, Pal A, Sands P, Thompson
O, Palin WM. Two year clinical evaluation of a low-shrink resin composite material in UK general dental practices. Dent Mater 2011;27:
622-30.
6. Cabrera E, Macorra JC. Microtensile bond strength distributions of three
composite materials with different polymerization shrinkages bonded to
dentin. J Adhes Dent 2011;13:39-48.
7. Cunha LG, Alonso RC, Neves AC, de Goes MF, Ferracane JL, Sinhoreti
MA. Degree of conversion and contraction stress development of a
resin composite irradiated using halogen and LED at two C-factor levels.
Oper Dent 2009;34:24-31.
8. Cunha LG, Alonso RC, Pfeifer CS, Correr-Sobrinho L, Ferracane JL, Sinhoreti MA. Modulated photoactivation methods: Influence on contraction
stress, degree of conversion and push-out bond strength of composite
restoratives. J Dent 2007;35:318-324.
Pinzino CS. Properties of silorane-based dental resins and composites containing a stress-reducing monomer. Dent Mater 2007;23:
1011-1017.
11. Emami N, Soderholm KJ, Berglund LA. Effect of light power density
variations on bulk curing properties of dental composites. J Dent
2003;31:189-196.
12. Ernst CP, Meyer GR, Klocker K, Willershausen B. Determination of polymerization shrinkage stress by means of a photoelastic investigation.
Dent Mater 2004;20:313-321.
13. Feilzer AJ, de Gee AJ, Davidson CL. Quantitative determination of stress
reduction by flow in composite restorations. Dent Mater 1990;6:
167-171.
14. Frankenberger R, Krämer N, Oberschachtsiek H, Petschelt A. Dentin
bond strength and marginal adaption after NaOCl pre-treatment. Oper
Dent 2000;25:40-45.
15. Frankenberger R, Krämer N, Petschelt A. Fatigue behaviour of different
dentin adhesives. Clin Oral Investig 1999;3:11-17.
16. Goracci C, Margvelashvili M, Apicella D, Sedda M, Magni E, Ferrari M.
Influence of resin composite mechanical properties on adhesive microtensile bond strength to dentin. J Adhes Dent 2010;4:323-331.
17. Kurtz JS, Perdigao J, Geraldeli S, Hodges JS, Bowles WR. Bond
strengths of tooth-colored posts, effect of sealer, dentin adhesive, and
root region. Am J Dent 2003;16:31A-36A.
18. Melo Monteiro GQ, Montes MA, Rolim TV, de Oliveira Mota CC, de
Barros Correia Kyotoku B, Gomes AS, de Freitas AZ. Alternative methods for determining shrinkage in restorative resin composites. Dent
Mater 2011;27:176-185.
19. Moll K, Fritzenschaft A, Haller B. In vitro comparison of dentin bonding systems: effect of testing method and operator. Quintessence
Int 2004;35:845-852.
20. Nakamichi I, Iwaru M, Fusayama T. Bovine teeth as possible substitutes
in the adhesion test. J Dent Res 1983;62:1076-1081.
21. Palin WM, Fleming GJ, Nathwani H, Burke FJ, Randall RC. In vitro cuspal
deflection and microleakage of maxillary premolars restored with novel
low-shrink dental composites. Dent Mater 2005;21:324-335.
22. Perdigao J, Geraldeli S, Lee IK. Push-out bond strengths of toothcolored posts bonded with different adhesive systems. Am J Dent
2004;17:422-426.
23. Reeves GW, Fitchie JG, Hembree JH Jr, Puckett AD. Microleakage of
new dentin bonding systems using human and bovine teeth. Oper Dent
1995;20:230-235.
24. Rueggeberg FA, Craig RG. Correlation of parameters used to estimate monomer conversion in a light-cured composite. J Dent Res
1988;67:932-937.
25. Santini A, Miletic V. Comparison of the hybrid layer formed by Silorane
adhesive, one-step self-etch and etch and rinse systems using confocal
micro-Raman spectroscopy and SEM. J Dent 2008;36:683-691.
26. Schilke R, Lisson JA, Bauss O, Geurtsen W. Comparison of the number and diameter of dentinal tubules in human and bovine dentine by
scanning electron microscopic investigation. Arch Oral Biol 2000;45:
355-361.
27. Segreto D, Brandt WC, Correr-Sobrinho L, Sinhoreti MA, Consani S. Influence of irradiance on the push-out bond strength of composite restorations photoactivated by LED. J Contemp Dent Pract 2008;9:89-96.
28. Tezvergil-Mutluay A, Lassila LV, Vallittu PK. Incremental layers bonding of silorane composite: the initial bonding properties. J Dent
2008;36:560-563.
29. Weinmann W, Thalacker C, Guggenberger R. Siloranes in dental composites. Dent Mater 2005;21:68-74.
Clinical relevance: The silorane-based composite
Filtek P90 in combination with its respective bonding system seems to achieve better bond strengths
to dentin when compared to a methacrylate-based
restorative system. However, the potential effects of
the lower mechanical properties of the silorane-based
on the longevity of posterior restorations remains to
be determined.
7
ot
REFERENCES
by N
ht
Under the limitations of this study, the photoactivation
methods produced no differences in bond strength or
Knoop hardness in the same composite when a small
volume of composite resin was used. However, the
higher prevalence of cohesive and mixed failures in composite cured with the soft-start and pulse-delay modes
may indicate lower mechanical properties of the composite resins used here.
The silorane-based composite (Filtek P90) used in
combination with its proprietary bonding system produced
higher push-out bond strengths than the methacrylatebased resin composite (Filtek Supreme) in combination
with a universal bonding system (Single Bond 2). The potential association between this difference in bond strength
and the lower mechanical properties of the silorane-based
composite compared with traditional methacrylate-based
resin composites as indicated by the hardness measurements should be the objective of further studies.
n
CONCLUSION
Q ui
which could suggest reduced mechanical properties. Further studies related to the properties exhibited by the
composite, such as wear and ultimate tensile strength,
should be conducted.
Finally, is important to point out some limitations of this
study. The use of bovine teeth requires caution in the interpretation of the results. The objective of this study was
to evaluate the effect of different photoactivation methods
on composite behavior under confinement conditions (eg,
in a prepared cavity). Nevertheless, the use of bovine incisors is supported by numerous authors.20,23,26
pyrig
No Co
t fo
Brandt et al
rP
ub
9. Davidson CL, de Gee AJ. Relaxation of polymerization contraction lica
tio
stresses by flow in dental composites. J Dent Res 1984;63:146-148.
n
te
s AG,
10. Eick JD, Kotha SP, Chappelow CC, Kilway KV, Giese GJ, Glaros s e n c e