
Recommended
More Related Content
Similar to X R D S • S U M M E R 2 0 1 1 • V O L . 1 7 • N O . 422.docx
Similar to X R D S • S U M M E R 2 0 1 1 • V O L . 1 7 • N O . 422.docx (20)
More from ericbrooks84875
More from ericbrooks84875 (20)
Recently uploaded
Recently uploaded (20)
X R D S • S U M M E R 2 0 1 1 • V O L . 1 7 • N O . 422.docx
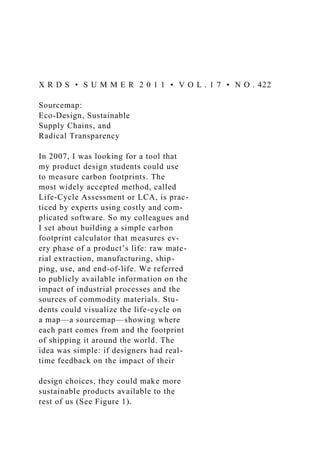
- 1. X R D S • S U M M E R 2 0 1 1 • V O L . 1 7 • N O . 422 Sourcemap: Eco-Design, Sustainable Supply Chains, and Radical Transparency In 2007, I was looking for a tool that my product design students could use to measure carbon footprints. The most widely accepted method, called Life-Cycle Assessment or LCA, is prac- ticed by experts using costly and com- plicated software. So my colleagues and I set about building a simple carbon footprint calculator that measures ev- ery phase of a product’s life: raw mate- rial extraction, manufacturing, ship- ping, use, and end-of-life. We referred to publicly available information on the impact of industrial processes and the sources of commodity materials. Stu- dents could visualize the life-cycle on a map—a sourcemap—showing where each part comes from and the footprint of shipping it around the world. The idea was simple: if designers had real- time feedback on the impact of their design choices, they could make more sustainable products available to the rest of us (See Figure 1).
- 2. ECO-DESIGN The life-cycle approach engaged stu- dents in social and environmental im- pact of design, leading to new kinds of sustainable products. LCA favors es- tablished approaches to environmen- tal sustainability: using less material or “lightweighting,” reducing energ y use, incorporating waste streams into manufacturing and extending the life of products through repair, reuse, and recycling. Adaptive reuse or “upcy- cling” was by far the favorite strateg y. Media Lab student Daniel Leithinger found a way to reuse old cellphones as roadside emergency call boxes. Archi- tect Ben Brady manufactured house- hold objects from a new compound made of crushed pistachio shells. An- other architect, Ayodh Kamath, cre- ated CAD/CAM software to manufac- ture dressers that would incorporate odd-sized drawers from old furniture. Two engineers, Heather Brundage and Brooke Jarrett, devised a useful second life for soda bottles discarded in the developing world: through a set of instructions printed on the inside of the label, the bottles could be con- verted into water filters and make po- table water once the bottle’s original contents are gone. It’s no accident that extending the life of products was such a popular choice: a more traditional
- 3. approach life lightweighting—a plastic bottle “with less plastic,” for example; saves some material without interrupt- W ith the human population growing faster than ever, the problem of sustainability is critical: how will we provide for future generations? There is growing recognition that business-as-usual is unsustainable, yet most of us go through life with little feedback on the social and environmental impact of our actions. Sourcemap is a suite of tools to support sustainable decision-making: a catalog of product origins and carbon footprints, a life-cycle assessment calculator, and a social network for sharing sustainable practices. This project brings together a variety of stakeholders in a sustainable future, from students to professionals, large corporations to farmer cooperatives. Their stories have provided valuable insight into the challenges and the opportunities of new media for sustainability. Industry and consumers need tools to help make decisions that are good for communities and for the environment. By Leo Bonanni D OI: 10.1145/19 61678 .19 616 81 Sourcemap: Eco-Design, Sustainable Supply Chains, and
- 4. Radical Transparency X R D S • S U M M E R 2 0 1 1 • V O L . 1 7 • N O . 4 23 ing the cycle of distribution and dis- posal. Extending the life of a product, on the other hand, multiplies its useful- ness and reduces its footprint to a frac- tion of what it would have been. Sourcemap helped the MIT stu- dents think about the life-cycle of products and come up with new ways to extend their useful life (see Figure 2). How would it be used by people with- out a technical background? A pilot version of Sourcemap was introduced to small businesses in northern Scot- land in partnership with a regional development group, the Highlands and Islands Enterprise. The studies re- vealed a demand for carbon footprint solutions aimed at small businesses. Caroline Gregory, a hotel owner, want- ed to ease her guests’ concern about their ecological footprint, so she of- fered to offset the carbon footprint of traveling to the hotel. She used Source- map to do the calculations and posted the map to her website to explain how she measured it. A butcher named Jock Gibson used Sourcemap to footprint his business, a specialty shop that sells native breeds of sheep, cattle, and pork. He assumed the proximity of the
- 5. farms to the butcher shop would re- duce his carbon footprint, but he dis- covered that raising the animals has a much greater impact than shipping, something that could be addressed by shifting to organic practices. Carbon footprint is an important indicator of environmental impact, but it is only one measure of sustain- ability. Many communities in the Highlands of Scotland are well-sup- plied with natural resources, including water and renewable power, but they are at risk of losing social capital in the form of investment and jobs. Sam Fair- cliff, who runs the organic Cairngorm Brewery, wanted to invest in the re- gion’s economic competitiveness. She explained that her industry is under- served by bottling plants: breweries in the Highlands must ship their product to central England for bottling—a one- way distance exceeding 9,000km for all 18 breweries. Building a new bot- tling plant at her facility would drop the total distance by two-thirds, to less than 3,100km. In doing so, she hopes to reduce shipping costs and carbon footprints, improve competitiveness, and create jobs in the region. Source- maps of this new plant and its impact on the region helped Sam obtain fund- ing; construction on the project has al- ready begun (see Figure 3).
- 6. SUSTAINABLE SUPPLY CHAINS The experience with Sam showed that it’s not enough to measure the foot- print of a single company: sometimes information needs to be shared be- tween competitors to guide sustain- able development. In recent years, pharmaceutical companies, apparel manufacturers, and the electronics industry have all established systems for sharing information about their suppliers to monitor quality, social, and environmental performance. Data-sharing initiatives have become commonplace because modern sup- ply chains can involve hundreds of suppliers around the world, making it very difficult for any one organization to keep track of them all. Highland butcher Jock Gibson knows all of his suppliers personally, but retailers like Walmart and Tesco—both of whom have vouched to put carbon footprint labels on their products—each have hundreds of thousands of suppli- Figure 1. A screenshot of Sourcemap showing the supply chain of a laptop computer on a map alongside a list of materials used to calculate the carbon footprint of raw material extraction, manufacturing, shipping, use and end-of-life. Figure 2. The life-cycle approach to eco-design
- 7. favors reuse and upcycling: an old cell phone becomes an emergency call box; custom cabinets fit discarded drawers; pistachio shells are molded into new objects; and a soda label provides instructions on how to make a water filter from the empty bottle. X R D S • S U M M E R 2 0 1 1 • V O L . 1 7 • N O . 4 24 ers. To measure the life-cycle impact of a single product, they will need to understand each supplier’s contribu- tion to the overall footprint. Here is another unmet need: communications channels that engage suppliers in LCA so that they can work together to build sustainable supply chains. There are important hurdles to the kind of transparency needed for sustainable supply chains. Some com- panies have a culture of confidential- ity, some consider their supply chains to be trade secrets, and many do not know the extent of their sourcing. But many companies already recognize the benefits of supply chain transpar- ency. The first user of Sourcemap was one such entrepreneur: chef Robert
- 8. Harris was starting a catering com- pany devoted to high-quality, locally sourced food. This was around the time that the word “locavore” ap- peared in the Oxford dictionary; every gourmet restaurant and supermarket began making some claim that food was being sourced locally “when possi- ble.” Robert had spent years cultivating a network of suppliers from the local farmers’ market; during the summer he was able to obtain more than 90% of his ingredients from farms within 400km (250 miles) of Boston. He made sourcemaps of his supplier farms and inserted them into menus to connect diners with the flavors—and the farm- ers—of the region (Figure 4). Those first maps were also a way to raise the expectations of clients, inspiring the Sourcemap mantra that “people have a right to know where things come from and what they’re made of.” The students and the entrepreneurs who used Sourcemap in its early stag- es showed that there was demand for information and tools to help under- stand the impact of products. Today there is too little information to sup- port sustainable decision-making: after all, if designers and businesses don’t have access to eco-design tools, how will sustainable products ever make it to market? Sourcemap was publicly launched in September 2009
- 9. to engage more people in sustainable design through a free, open source and open data platform. People from all walks of life can register on the site and put forward their best guess Figure 3. Sharing supply chains can be essential to making sustainable choices: in this case, 18 breweries in northern Scotland have to ship their product over 9,000 km one-way for bottling (left); a new plant would reduce that distance by nearly two-thirds (right). Figure 4. The first sourcemaps were made by local food chef Robert Harris and designed to give a complete sourc- ing picture by showing both lo- cally and globally sourced ingredi- ents. X R D S • S U M M E R 2 0 1 1 • V O L . 1 7 • N O . 4 25 about the impact of a product, even when manufacturers haven’t disclosed the footprint. In 18 months, the site has been visited by well over 300,000
- 10. people, 5,000 of whom have registered, creating more than 2,000 sourcemaps. The early users have provided insight into the kinds of products that people care about; it has also created a direct communication channel where pro- ducers can share their sustainability efforts transparently with consumers. If you visit w w w.sourcemap.org today, you’ll see a variety of maps cre- ated by a diverse group of users: stu- dents, experts, entrepreneurs, and professionals. One third of maps are about food: homemade meals, restau- rant menus, and globalized, industrial foodstuff. The popularity of food on Sourcemap points to a broad underly- ing interest in food-related informa- tion: people are already invested in the provenance of food for cultural, environmental, and health-related motives. We have barely scratched the surface on interfaces to help make sus- tainable decisions on the multiple di- mensions of food. Beyond food, there are maps describing the full range of consumer products from clothing and electronics to musical instruments and furniture. The most frequently asked ques- tion about Sourcemap is “How do we know if the information is accurate?” In the current vacuum of information on sustainability, the best guesses of
- 11. thousands of Sourcemap users repre- sent a significant step forward. Adding to that, producers and industry groups are beginning to make proprietary information available on Sourcemap in line with reporting standards such as the Greenhouse Gas Protocol and bearing links to independent verifica- tion such as the Carbon Trust’s. In the end, the mechanism to verify a source- map is the same for producers as it is for consumers: a footprint can only be trusted if there is enough visibility into a supply chain that anyone can confirm the social and environmental impact for themselves. RADICAL TRANSPARENCY When Sourcemap launched, supply chain mapping was just a curiosity— but web traffic exploded and major companies came forward to see how their supply chains look on the map. Global trade is actually a series of dis- crete transactions between buyers and sellers; no one has a clear picture of the entire life-cycle of a product. In a one case study, the supply chain be- hind a can of “California Tomatoes” was found to involve seven countries— some as “likely” sources—a fact that surprised the retailer (who commis- sioned the study) more than anyone. But a spate of disastrous recalls in
- 12. children’s toys, pharmaceuticals and foods—all due to contamination of the supply chain—show how valuable it is to know where things come from. And a number of companies have put con- siderable effort into building sustain- able supply chains. Recycled paper pio- neer Jeff Mendelsohn reached out to Sourcemap to give consumers unprec- edented visibility into the supply chain of recycled paper. Some products bear Figure 5. A map of the supply chain behind 100% post- consumer content recycled paper. “The idea was simple: if designers had real- time feedback on the impact of their design choices, they could make more sustainable products available to the rest of us.” labels asserting an eco-certification (such as, 100% Post-Consumer Content or Forestry Stewardship Council or FSC-certified) and in some cases even show the actual footprint of a product. These eco-labels are meant to inform conscious consumers, but they are lost in a sea of claims like “natural” and “green.” Sourcemap shows consum-
- 13. ers the footprint of a product; it also provides transparency into the supply chain and the footprint calculations to help consumers understand LCA. This is radical transparency: the idea that companies can share their prod- ucts’ environmental and social per- formance with their buyer and their buyer’s buyer all the way to the end consumer. It is a time-consuming pro- cess. The study of recycled paper took 18 months and involved five teams: the Carbon Trust, an eco-labeler; the MIT Materials Systems Lab, to perform the LCA; Office Depot, the paper retailer; New Leaf Paper, Jeff’s company; and Sourcemap—as well as representa- tives from every mill in the supply chain (see Figure 5). But now that it’s established, this social network will make it easier to maintain an up-to- date measure of the paper’s footprint. One day soon, consumers will be able to point their smartphone at a bar code on the box of paper and—thanks to radical transparency—retrieve a sourcemap showing the carbon foot- print and tracing the supply all the way to the waste paper collection points where the recycled paper originated. Sourcemap has already shown how important it is to engage more people in eco-design and sustainable supply chains—and this is only the beginning. As we saw in the High-
- 14. lands, transparency can have impor- tant benefits for the social conditions around supply chains. The same verifiable, shared supply chain infor- mation could one day transform the quality of life for some of the most disadvantaged participants in global trade. This year we started investigat- ing the Fair Trade cotton supply chain in India, from high-fashion retailers in Mumbai and Bangalore to cotton farmers earning less than two dollars a day in Maharashtra and Orissa. Fair Trade describes an extensive network of farmers, community groups, and organizations working to improve economic, social, and environmental standards. Like LCA, Fair Trade cer- tification is grounded in traceability: trades are not ‘Fair’ unless a receipt is issued to the farmer, for example. Traceability is only the first step, but it makes it possible to verify the price and quantity, as well as the conditions of a farm and the surrounding com- munity. Just as Sourcemap connects retail customers with the origins of re- cycled paper, the platform will one day connect consumers directly with the farmers behind the products we buy. Radical Transparency is a powerful engine for sustainability across supply chains, from farmers to manufacturers and retail consumers around the world.
- 15. It also presents a number of opportuni- ties for software, hardware, interaction design and new communications plat- forms. Interfaces that guide consumers in retail stores could remain useful over the life of a product to provide informa- tion on sustainable ways to use, repair and reuse products. At production sites, automated systems will one day track manufacturing processes for a real- time measure of product footprint. At the extremities of supply chains—the sites of material extraction and low- wage labor where so many problems occur—mobile and shared platforms can include some of the most disen- franchised participants in global trade. Imagine: one day, while you shop for a shirt at your local store, you’ll be able to take a look into its supply chain, under- stand its environmental and social con- text, receive real-time updates from the field, and maybe even meet the farmer who grew the cotton. Our experiences over the last two years revealed the important role that new media can enable sustainability. In the first release, Sourcemap sup- ported eco-design and helped small businesses account for their footprint and improve their performance. As it evolves, Sourcemap is revealing more opportunities to help re-organize supply chains for social and environ-
- 16. mental benefit. Today, the Sourcemap team is working to connect consum- ers and producers directly through radical transparency so that every pur- chasing decision can be informed by a trusted measure of sustainability. And this is only the beginning: how many more ways can we find to become in- formed on the impact of our choices so that — working together — producers and consumers can pave the way for a sustainable future? Biography Leo Bonanni is CEO and cofounder of Sourcemap, an MIT Media Lab spin-off based in Cambridge, MA. He holds a Ph.D. from the lab’s Tangible Media Group, an MS and a master’s of architecture from MIT and a BA from Columbia, and he teaches sustainable design at Parsons and at MIT. You can learn more about him by visiting leo.media.mit.edu and see Sourcemap live at w w w.sourcemap.org X R D S • S U M M E R 2 0 1 1 • V O L . 1 7 • N O . 426 “Sourcemap has already shown how important it is to engage more people in eco-design and sustainable supply chains—and this is only the beginning.” © 2011 ACM 1528-4972/11/0600 $10.00 ACRONYMS
- 17. ICT Information and Communication Technologies: A term that subsumes the usual notion of “Information Technology,” adding a focus upon communication, for example, with respect to the Internet or cellular phone networks. PUE Power Usage Effectiveness: A metric for the efficiency of a data center, obtained by dividing the facility’s total power consumption by the portion devoted to powering ICT equipment. V2G Vehicle-To-Grid: A concept for bidirectional energy flow between an alternative energy vehicle and its charging station, allowing the vehicle to give unused power back to the grid efficiently. Continued from page 12