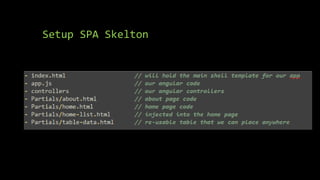
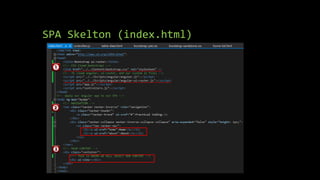
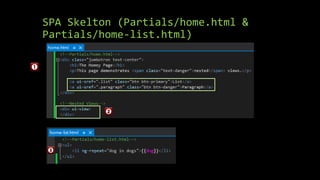
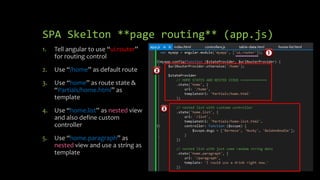
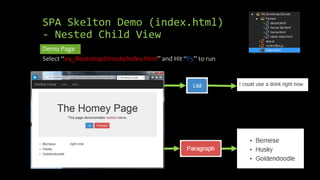
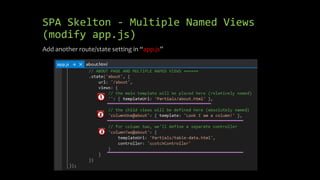
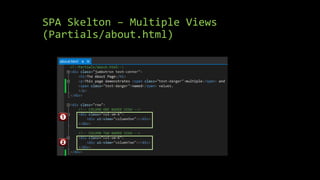
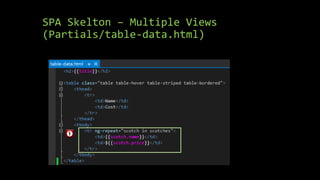
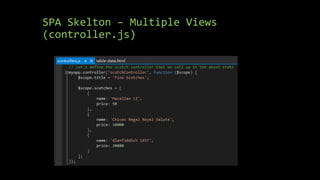
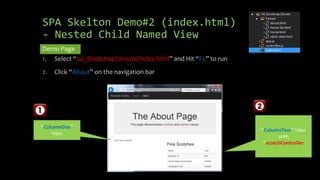
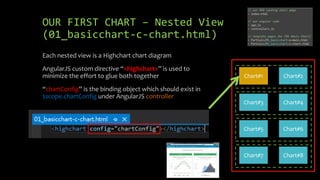
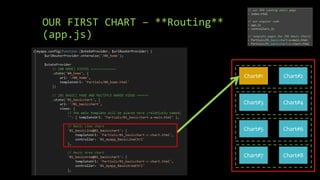
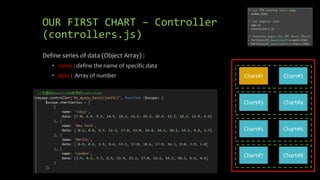
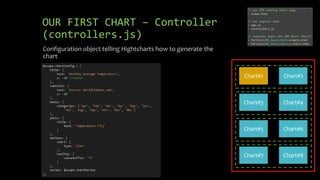
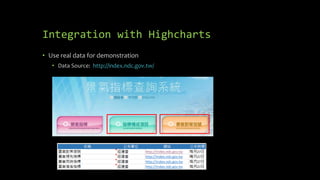
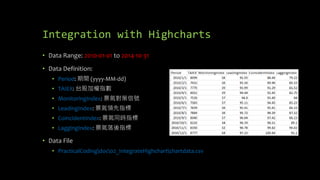
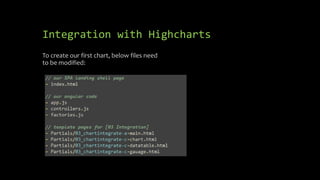
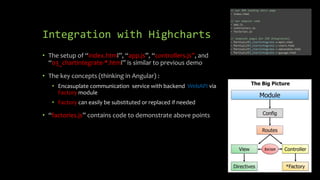
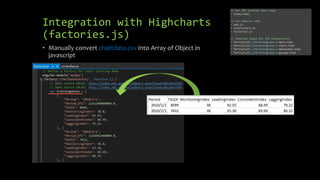
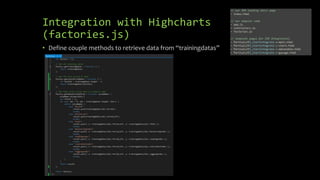
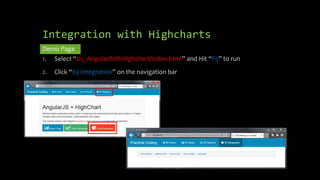
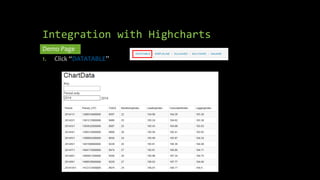
AngularJS + HighChart: 
完美網頁圖表整合篇 
開發技巧實戰系列(2/6) - Web 前端 
講師: 郭二文(erhwenkuo@gmail.com)
Document, Source code & Training 
Video 
• https://github.com/erhwenkuo/PracticalCoding
Previous Training Session Document, 
Source code & Training Video 
• https://www.youtube.com/watch?v= 
Sr7PCDGfkic&feature=youtu.be 
• http://www.slideshare.net/erhwenku 
o/01-startoff-angularjs
Agenda 
• Bootstrap & Responsive Design 
• Highchart & AngularJS Directive Basic 
• Highchart & AngularJS Interaction 
• Highchart & AngularJS Integration
Bootstrap & Responsive 
Design
Bootstrap Website 
Http://getbootstrap.com
Bootstrap History 
Bootstrap was developed by Mark Otto and Jacob Thornton at Twitter as a 
framework to encourage consistency across internal tools.
Why Use Bootstrap? 
• Mobile-first approach: Since Bootstrap 3, the framework consists of mobile-first 
styles throughout the entire library 
• Browser support: Bootstrap is supported by all popular browsers 
• Responsive web design: Bootstrap's responsive CSS automatically adjusts 
the page layout to fit different devices including Desktops, Tablets, and Mobile 
phones 
• Easy to get started: With just the knowledge of HTML and CSS anyone can get 
started with Bootstrap
Build Single Page Application Skelton 
• This SPA skelton is base on Chris Sevilleja’s 
terrific “AngularJS Routing Using UI-Router” 
• http://scotch.io/tutorials/javascript/angular-routing- 
using-ui-router
Setup SPA Skelton 
1. Create “04_BootstrapUIroute” folder under 
“MyApp” 
2. Add new html file named “index.html” 
3. Add two javascript files named “app.js” & 
“controllers.js” 
4. Add four html files under “Partials” sub 
folder 
• about.html 
• home-list.html 
• home.html 
• table-data.html
Setup SPA Skelton
SPA Skelton (index.html)
SPA Skelton (Partials/home.html & 
Partials/home-list.html)
SPA Skelton **page routing** (app.js) 
1. Tell angular to use “ui.router” 
for routing control 
2. Use “/home” as default route 
3. Use “home” as route state & 
“Partials/home.html” as 
template 
4. Use “home.list” as nested view 
and also define custom 
controller 
5. Use “home.paragraph” as 
nested view and use a string as 
template
SPA Skelton Demo (index.html) 
- Nested Child View 
Demo Page 
Select “04_BootstrapUIroute/index.html” and Hit “F5” to run
SPA Skelton - Multiple Named Views 
(modify app.js) 
Add another route/state setting in “app.js”
SPA Skelton – Multiple Views 
(Partials/about.html)
SPA Skelton – Multiple Views 
(Partials/table-data.html)
SPA Skelton – Multiple Views 
(controller.js)
SPA Skelton Demo#2 (index.html) 
- Nested Child Named View 
Demo Page 
1. Select “04_BootstrapUIroute/index.html” and Hit “F5” to run 
2. Click “About” on the navigation bar 
“ColumnOne” 
View 
“ColumnTwo” View 
with 
“scotchController
AngularJS & Highcharts
HIGHCHARTS Website 
http://www.highcharts.com/
AngularJS directive for Highcharts 
https://github.com/pablojim/highcharts-ng
Setup Demo SPA Skelton 
1. Create “05_AngularWithHighchart” 
folder under “MyApp” 
2. Create files and subfolder according 
to the diagram
Setup Demo SPA Skelton 
Every files has it own function and definition depicts on below diagrams
Setup Demo SPA Skelton 
Landing page will include all necessary CSS (for style) & Javascript for our SPA
Highcharts & AngularJS 
Directive Basic
Understanding Highcharts 
To get to grasp with how Highcharts works it is important to understand the various parts 
or concepts of a chart 
• Title 
• Series 
• Tooltip 
• Legend 
• Axes
OUR FIRST CHART 
To create our first chart, below files need 
to be modified:
OUR FIRST CHART – Navigation 
(index.html)
OUR FIRST CHART – Main Content 
(01_basicchart-a-main.html) 
Chart#1 Chart#2 
Chart#3 Chart#4 
Chart#5 Chart#6 
Chart#7 Chart#8
OUR FIRST CHART – Nested View 
(01_basicchart-c-chart.html) 
Chart#1 Chart#2 
Chart#3 Chart#4 
Chart#5 Chart#6 
Chart#7 Chart#8 
Each nested view is a Highchart chart diagram 
AngularJS custom directive “<highchart>” is used to 
minimize the effort to glue both together 
“chartConfig” is the binding object which should exist in 
$scope.chartConfig under AngularJS controller
OUR FIRST CHART – **Routing** 
(app.js) 
Chart#1 Chart#2 
Chart#3 Chart#4 
Chart#5 Chart#6 
Chart#7 Chart#8
OUR FIRST CHART – Controller 
(controllers.js) 
Chart#1 Chart#2 
Chart#3 Chart#4 
Chart#5 Chart#6 
Chart#7 Chart#8 
Define series of data (Object Array) : 
• name : define the name of specific data 
• data : Array of number
OUR FIRST CHART – Controller 
(controllers.js) 
Chart#1 Chart#2 
Chart#3 Chart#4 
Chart#5 Chart#6 
Chart#7 Chart#8 
Configuration object telling Hightcharts how to generate the 
chart
OUR FIRST CHART 
Demo Page 
1. Select “05_AngularWithHighchart/index.html” and Hit “F5” to run 
2. Click “01 Basic” on the navigation bar
Highchart & AngularJS 
Interaction
Interaction with Highcharts 
To complete this demo, below files need 
to be modified:
Interaction with Highcharts 
(controllers.js) 
• The setup of “index.html”, “02_chartinteraction.html”, “app.js” is similar to 
previous demo 
• The key concepts (thinking in Angular) : 
• Controller gules View (Template) and Model (chartConfig) 
• Change the Model, the View should reflective automatically 
• Controller contains Model (chartConfig) to allow change 
• Controller provide functions to change Model (chartConfig) 
• “02_myapp_ChartInteractionCtrl” contains code to demonstrates above points
Interaction with Highcharts 
Demo Page 
1. Select “05_AngularWithHighchart/index.html” and Hit “F5” to run 
2. Click “02 Interact” on the navigation bar
Highchart & AngularJS 
Integration
Integration with Highcharts 
• Use real data for demonstration 
• Data Source: http://index.ndc.gov.tw/
Integration with Highcharts 
• Data Range: 2010-01-01 to 2014-10-31 
• Data Definition: 
• Period: 期間(yyyy-MM-dd) 
• TAIEX: 台股加權指數 
• MonitoringIndex: 景氣對策信號 
• LeadingIndex: 景氣領先指標 
• CoincidentIndex: 景氣同時指標 
• LaggingIndex: 景氣落後指標 
• Data File 
• PracticalCodingdoc02_IntegrateHighchartchartdata.csv
Integration with Highcharts 
To create our first chart, below files need 
to be modified:
Integration with Highcharts 
• The setup of “index.html”, “app.js”, “controllers.js”, and 
“03_chartintegrate-*.html” is similar to previous demo 
• The key concepts (thinking in Angular) : 
• Encasuplate communication service with backend WebAPI via 
Factory module 
• Factory can easily be substituted or replaced if needed 
• “factories.js” contains code to demonstrate above points
Integration with Highcharts 
(factories.js) 
• Manually convert chartdata.csv into Array of Object in 
javascript
Integration with Highcharts 
(factories.js) 
• Define couple methods to retrieve data from “trainingdatas”
Integration with Highcharts 
Demo Page 
1. Select “05_AngularWithHighchart/index.html” and Hit “F5” to run 
2. Click “03 Integration” on the navigation bar
Integration with Highcharts 
Demo Page 
1. Click “DATATABLE”
Integration with Highcharts 
Demo Page 
1. Click “SIMPLELINE”
Integration with Highcharts 
Demo Page 
1. Click “DUALAXES”
Integration with Highcharts 
Demo Page 
1. Click “MULTIAXES”
Integration with Highcharts 
Demo Page 
1. Click “GAUAGE”
Next Session: 
AngularJS + Asp.Net WebApi 2

02 integrate highchart

  • 1.
    AngularJS + HighChart: 完美網頁圖表整合篇 開發技巧實戰系列(2/6) - Web 前端 講師: 郭二文(erhwenkuo@gmail.com)
  • 2.
    Document, Source code& Training Video • https://github.com/erhwenkuo/PracticalCoding
  • 3.
    Previous Training SessionDocument, Source code & Training Video • https://www.youtube.com/watch?v= Sr7PCDGfkic&feature=youtu.be • http://www.slideshare.net/erhwenku o/01-startoff-angularjs
  • 4.
    Agenda • Bootstrap& Responsive Design • Highchart & AngularJS Directive Basic • Highchart & AngularJS Interaction • Highchart & AngularJS Integration
  • 5.
  • 6.
  • 7.
    Bootstrap History Bootstrapwas developed by Mark Otto and Jacob Thornton at Twitter as a framework to encourage consistency across internal tools.
  • 8.
    Why Use Bootstrap? • Mobile-first approach: Since Bootstrap 3, the framework consists of mobile-first styles throughout the entire library • Browser support: Bootstrap is supported by all popular browsers • Responsive web design: Bootstrap's responsive CSS automatically adjusts the page layout to fit different devices including Desktops, Tablets, and Mobile phones • Easy to get started: With just the knowledge of HTML and CSS anyone can get started with Bootstrap
  • 9.
    Build Single PageApplication Skelton • This SPA skelton is base on Chris Sevilleja’s terrific “AngularJS Routing Using UI-Router” • http://scotch.io/tutorials/javascript/angular-routing- using-ui-router
  • 10.
    Setup SPA Skelton 1. Create “04_BootstrapUIroute” folder under “MyApp” 2. Add new html file named “index.html” 3. Add two javascript files named “app.js” & “controllers.js” 4. Add four html files under “Partials” sub folder • about.html • home-list.html • home.html • table-data.html
  • 11.
  • 12.
  • 13.
    SPA Skelton (Partials/home.html& Partials/home-list.html)
  • 14.
    SPA Skelton **pagerouting** (app.js) 1. Tell angular to use “ui.router” for routing control 2. Use “/home” as default route 3. Use “home” as route state & “Partials/home.html” as template 4. Use “home.list” as nested view and also define custom controller 5. Use “home.paragraph” as nested view and use a string as template
  • 15.
    SPA Skelton Demo(index.html) - Nested Child View Demo Page Select “04_BootstrapUIroute/index.html” and Hit “F5” to run
  • 16.
    SPA Skelton -Multiple Named Views (modify app.js) Add another route/state setting in “app.js”
  • 17.
    SPA Skelton –Multiple Views (Partials/about.html)
  • 18.
    SPA Skelton –Multiple Views (Partials/table-data.html)
  • 19.
    SPA Skelton –Multiple Views (controller.js)
  • 20.
    SPA Skelton Demo#2(index.html) - Nested Child Named View Demo Page 1. Select “04_BootstrapUIroute/index.html” and Hit “F5” to run 2. Click “About” on the navigation bar “ColumnOne” View “ColumnTwo” View with “scotchController
  • 21.
  • 22.
  • 23.
    AngularJS directive forHighcharts https://github.com/pablojim/highcharts-ng
  • 24.
    Setup Demo SPASkelton 1. Create “05_AngularWithHighchart” folder under “MyApp” 2. Create files and subfolder according to the diagram
  • 25.
    Setup Demo SPASkelton Every files has it own function and definition depicts on below diagrams
  • 26.
    Setup Demo SPASkelton Landing page will include all necessary CSS (for style) & Javascript for our SPA
  • 27.
    Highcharts & AngularJS Directive Basic
  • 28.
    Understanding Highcharts Toget to grasp with how Highcharts works it is important to understand the various parts or concepts of a chart • Title • Series • Tooltip • Legend • Axes
  • 29.
    OUR FIRST CHART To create our first chart, below files need to be modified:
  • 30.
    OUR FIRST CHART– Navigation (index.html)
  • 31.
    OUR FIRST CHART– Main Content (01_basicchart-a-main.html) Chart#1 Chart#2 Chart#3 Chart#4 Chart#5 Chart#6 Chart#7 Chart#8
  • 32.
    OUR FIRST CHART– Nested View (01_basicchart-c-chart.html) Chart#1 Chart#2 Chart#3 Chart#4 Chart#5 Chart#6 Chart#7 Chart#8 Each nested view is a Highchart chart diagram AngularJS custom directive “<highchart>” is used to minimize the effort to glue both together “chartConfig” is the binding object which should exist in $scope.chartConfig under AngularJS controller
  • 33.
    OUR FIRST CHART– **Routing** (app.js) Chart#1 Chart#2 Chart#3 Chart#4 Chart#5 Chart#6 Chart#7 Chart#8
  • 34.
    OUR FIRST CHART– Controller (controllers.js) Chart#1 Chart#2 Chart#3 Chart#4 Chart#5 Chart#6 Chart#7 Chart#8 Define series of data (Object Array) : • name : define the name of specific data • data : Array of number
  • 35.
    OUR FIRST CHART– Controller (controllers.js) Chart#1 Chart#2 Chart#3 Chart#4 Chart#5 Chart#6 Chart#7 Chart#8 Configuration object telling Hightcharts how to generate the chart
  • 36.
    OUR FIRST CHART Demo Page 1. Select “05_AngularWithHighchart/index.html” and Hit “F5” to run 2. Click “01 Basic” on the navigation bar
  • 37.
  • 38.
    Interaction with Highcharts To complete this demo, below files need to be modified:
  • 39.
    Interaction with Highcharts (controllers.js) • The setup of “index.html”, “02_chartinteraction.html”, “app.js” is similar to previous demo • The key concepts (thinking in Angular) : • Controller gules View (Template) and Model (chartConfig) • Change the Model, the View should reflective automatically • Controller contains Model (chartConfig) to allow change • Controller provide functions to change Model (chartConfig) • “02_myapp_ChartInteractionCtrl” contains code to demonstrates above points
  • 40.
    Interaction with Highcharts Demo Page 1. Select “05_AngularWithHighchart/index.html” and Hit “F5” to run 2. Click “02 Interact” on the navigation bar
  • 41.
  • 42.
    Integration with Highcharts • Use real data for demonstration • Data Source: http://index.ndc.gov.tw/
  • 43.
    Integration with Highcharts • Data Range: 2010-01-01 to 2014-10-31 • Data Definition: • Period: 期間(yyyy-MM-dd) • TAIEX: 台股加權指數 • MonitoringIndex: 景氣對策信號 • LeadingIndex: 景氣領先指標 • CoincidentIndex: 景氣同時指標 • LaggingIndex: 景氣落後指標 • Data File • PracticalCodingdoc02_IntegrateHighchartchartdata.csv
  • 44.
    Integration with Highcharts To create our first chart, below files need to be modified:
  • 45.
    Integration with Highcharts • The setup of “index.html”, “app.js”, “controllers.js”, and “03_chartintegrate-*.html” is similar to previous demo • The key concepts (thinking in Angular) : • Encasuplate communication service with backend WebAPI via Factory module • Factory can easily be substituted or replaced if needed • “factories.js” contains code to demonstrate above points
  • 46.
    Integration with Highcharts (factories.js) • Manually convert chartdata.csv into Array of Object in javascript
  • 47.
    Integration with Highcharts (factories.js) • Define couple methods to retrieve data from “trainingdatas”
  • 48.
    Integration with Highcharts Demo Page 1. Select “05_AngularWithHighchart/index.html” and Hit “F5” to run 2. Click “03 Integration” on the navigation bar
  • 49.
    Integration with Highcharts Demo Page 1. Click “DATATABLE”
  • 50.
    Integration with Highcharts Demo Page 1. Click “SIMPLELINE”
  • 51.
    Integration with Highcharts Demo Page 1. Click “DUALAXES”
  • 52.
    Integration with Highcharts Demo Page 1. Click “MULTIAXES”
  • 53.
    Integration with Highcharts Demo Page 1. Click “GAUAGE”
  • 54.
    Next Session: AngularJS+ Asp.Net WebApi 2

Editor's Notes

  • #2 開發技巧實戰 1. AngularJS入門篇 2. AngularJS + HighChart:完美網頁圖表整合篇 3. AngularJS + Asp.Net WebApi 2:前後端整合篇 4. AngularJS + Asp.Net WebApi 2+Entity Framework 6 (ORM):前後端整合篇 5. AngularJS + Asp.Net WebApi 2+Entity Framework 6 (ORM) + Redis (Nosql):前後端整合篇 6. AngularJS + Asp.Net WebApi 2+Entity Framework 6 (ORM) + Redis (Nosql) + Elasticsearch (全文檢索):前後端整合篇
  • #4 本章節的內容會延續前一個Session的知識與內容, 如果對前一章節不熟悉的話, 可以在Yoube或Slideshare找到文件與教學錄影
  • #5 The agenda is… We’re going to start off with some of the key features AngularJS offers and I’ll kind of introduce the challenge with writing SPAs from scratch. Anyone who knows me knows I do not recommend writing them from scratch. I just think that in the long term it is, when it comes to maintenance, a nightmare. There’s too many scripts involved and I’m worried about version dependencies and scripts changing and things breaking. So we’re going to talk about that and how Angular addresses it. Then we’re going to get started with some of the framework fundamental features that Angular provides. Then I’ll go into some of those key features that you’ve really got to start off with, kind of the A-B-Cs of Angular if you will, so Directives, Filters and two-way Data Binding which is just awesome. I’m a big fan of some of the other scripts out there – like KnockoutJS as an example - but you’re going to see that Angular is a true framework. It’s not just a library that does maybe one or two things: it actually can do a LOT of different things. Once we get through the Directives, Filters and Data Binding we’re going to talk about Views, Controllers and Scope. And then we’ll wrap up with Modules, and we’ll talk about how all this other stuff fits into modules, and then we’ll get into some SPA concepts like Routes and even Factories for sharing data and using data.
  • #7 1. 我們會100%著重在AngularJS 2. 在短短的一個半小時裡沒辦法把AngularJs的所有特色都詳細的介紹 3. 如果對AngularJs想要了解的更詳細的, 可以到AngularJs的網站。上面有詳細的文件, 範例及API講說。
  • #8 Bootstrap 是由 Twitter 所 open source 出來的 CSS/Template Framework。 Bootstrap 試圖對常見的網站元素 (user interface components, 如表單、表格等),與互動模式 (interactions, 如對話框、tab 分層 等) 等開發,提供簡單與彈性的 HTML、CSS 與 Javascript 基底,以幫助使用者提高其生產力。 而因為 Bootstrap 是自精粹自 Twitter 工程團隊在網站設定的過程,所以在整個 Framework 的設計上,你常常會感受到相當的實務與貼心,使用上相當容易上手與具生產力。並且預設的樣式就已經滿漂亮,很多時候也不需要再請設計師幫忙做調整。 另外在跨瀏覽器的支援上,也不用擔心。Bootstrap 支援市面上大部份的主流瀏覽器,可以閱讀官網上的 Browser Compatibility 一文,可以看到Bootstrap 對 IE (7 以上,IE6 must DIE!!)、Firefox、Chrome、Opera 等瀏覽器都有支援,請放心使用。
  • #9 現在做網站,面臨的挑戰越來越多,除了原來的瀏覽器相容問題,加上現在手機、平版一堆,一般的網頁開發人員要獨力面對這些問題,根本就像天方夜譚。 幸好有許多工具出來協助我們,其中Twitter Bootstrap就是近來相當熱門的一個框架,不但協助我們製作網頁的Layout或元件,也能處理各種網頁的檢視環境,雖然不見得能百分之百解決問題,但是至少已經減輕不少負擔。
  • #13 There’s our HTML file. We will use Bootstrap to help with our styling. Notice that we also load up ui-router in addition to loading Angular. UI Router is separate from the Angular core, just like ngRoute is separate. When creating a link with UI-Router, you will useui-sref. The href will be generated from this and you want this to point to a certain state of your application. These are created in your app.js. We also use <div ui-view></div> instead of ngRoute’s <div ng-view></div>.
  • #18 Having multiple views in application can be very powerful. Maybe we have a sidebar on our site that has things like Popular Posts, Recent Posts, Users, or whatever. These can all be separated out and injected into our template. Each will have its own controller and template file so our app stays clean. For our About page, let’s make two columns and have each have its own data. There we have multiple views. One is named columnOne and the other is columnTwo.
  • #23 Hightchart是位處於北歐挪威的一家小公司Highsoft AS所開發. 在2014年, 這家公司只有14名員工, 其中8位是工程師. 下載Hightcharts, 再把它的的javascripts全部都include到專案中
  • #24 highcharts-ng AngularJS directive for Highcharts A simple Angularjs directive for Highcharts. Current Version (0.0.7)
  • #29 TITLE Is the text that will be presented at the top of a chart. SERIES Is one or more series of data presented on a chart. TOOLTIP When hovering over a series or a point on the chart you can get a tooltip that describes the values on that particular part of the chart. LEGEND The legend show the data series in the graph and allows for enabling and disabling one or more series. AXES The x and y-axis of the chart, can also use multiple axes for different dataseries. Most chart types, like the typical cartesian types line and column, have axes. Polar charts have an X axis that spans around the perimeter of the chart, and even gauges have a single value axis. Pie charts don't have axes.
  • #30 axes.
  • #31 在index.html, 我們利用bootstrap的Navigation bar來做頁面導引(routing)。 當click到”01 Basic”的連結的時候, AngularJS的ui-router模組會動態引入對應的Template頁面與controller。
  • #32 在01_basicchart-a-main.html的template中, 我們在同一個頁面建立四列(row), 每列(column)包含兩個圖的layout。 特別注意ui-view=“01_basicLine”的這個指示, 它會告訴AngularJS的ui-router要引入那一個child template與controller。
  • #33 在01_basicchart-a-main.html的template中, 我們在同一個頁面建立四列(row), 每列(column)包含兩個圖的layout
  • #34 透過” 01_basicchart-a-main.html”中每個ui-view=“01_basicLine”的這個指示, 它會告訴AngularJS的ui-router要引入那一個child template與controller。
  • #35 透過” 01_basicchart-a-main.html”中每個ui-view=“01_basicLine”的這個指示, 它會告訴AngularJS的ui-router要引入那一個child template與controller。
  • #36 透過” 01_basicchart-a-main.html”中每個ui-view=“01_basicLine”的這個指示, 它會告訴AngularJS的ui-router要引入那一個child template與controller。
  • #38 在這個章節我們將會demo如何使用AngularJS來動態地來控制Highchart所產生的圖
  • #39 axes.
  • #40 axes.
  • #43 axes.
  • #44 axes.
  • #45 axes.
  • #46 axes.
  • #47 axes.
  • #48 axes.