SlideShare a Scribd company logo
1 of 47
Download to read offline
A.N. Tchernitchin et al. Rev. Environ Contam Toxicol 185:93-139 © Springer 2005 93
Human Exposure to Lead in Chile
Andrei N. Tchernitchin, Nina Lapin, Lucía Molina,
Gustavo Molina, Nikolai A. Tchernitchin,
Carlos Acevedo and Pilar Alonso
Contents:
I. Introduction ……………………………………………………………...……………. 94
II. Primary sources …….………………………………………………………….……… 96
III. Lead in Household Paints ………………….………………………………..…...…… 98
IV. Lead in Gasoline …….…………………….……………………..…………..……….. 99
V. Lead Exposure Clusters ………………………….……………………….…………. 108
A. The Ñuble Case: Lead in Wheat Flour …………….…………….……….…….. 108
B. Other Clusters ….………………………………………….……..……….…….. 112
VI. Special Cases ….…………………………………………………….………………. 113
A. The Antofagasta Case: Powdered Lead Mineral Concentrates
from Bolivia …………………………………………………………….….….. 113
B. The Arica Case: Toxic Wastes from Sweden and Mineral Concentrates
from Bolivia …………………………………………………………………….120
VII. Other Sources ………………………………………………………………………... 127
VIII. Lead in Soil …………………………………………………………………..……… 129
IX. Recommendations …………………………………………………………………… 130
Summary ………………………………………………………………………………………. 133
Acknowledgements ……………………………………………….…………………………… 135
References …………………………………………………………….……………………….. 135
__________________
Communicated by Lilia Albert J.
A.N. Tchernitchin ( )
P.O. Box Casilla 21104, Coreo 21, Santiago, Chile
atcherni@med.uchile.cl
A.N. Tchernitchin N. Lapin N.A. Tchernitchin
Laboratory of Experimental Endocrinology and Environmental Pathology, Institute of Biomedical
Sciences, University of Chile Medical School, Santiago, Chile
L. Molina
Institute of Public Health, Ministry of Health, Chile.
G. Molina
Labor Inspectorate, Work Conditions Unit, Ministry of Labor, Chile
C. Acevedo
University of Los Andes Medical School, Santiago, Chile
P Alonso
Regional Public Health Service of Ñuble, Ministry of Health, Chile.
A.N. Tchernitchin et al. Rev. Environ Contam Toxicol 185:93-139 © Springer 2005 94
I. Introduction
Lead has been used in human civilizations for about 5000 years and currently has many
uses in modern technology. Its uses and toxic properties at high doses have been
recognized since antiquity (Waldron 1973). Since the beginnings of lead use, evidence of
lead poisoning has been found by medical historians, with dramatic effects on the destiny
of ancient civilizations. The fall of the Roman Empire was related to the wide use of lead
in paints, water distribution pipes, and in wine storage vessels. It was suggested that the
declining birthrate, the epidemics of stillbirths and miscarriages, and apparently the
increased incidence of psychosis in Rome’s ruling class, which may have been at the root
of the Empire’s dissolution, were a result of exposure to lead in food and wine (Gilfillan
1965). It has been recently proposed that similar or additional effects of human
population exposure to lead may contribute to the decline of current societies through
lead induced impairment of intelligence (Needleman et al. 1979; Banks et al. 1997),
increased tendency to addictions to drug abuse (Tchernitchin and Tchernitchin 1992;
Tchernitchin et al. 1999), increase in delinquent behavior (Needleman et al. 1996), or
psychological changes such as behavioral difficulties at school (Byers and Lord 1943;
Banks et al. 1997).
Acute exposure to high levels of lead causes serious diseases such as lead
encephalopathy, which includes brain swelling and can evolve to coma and death. This is
not a frequent situation, but may occur in children accidentally exposed to high lead
levels, as well as in occupational accidents and attempted suicides.
Chronic exposure to lower levels of lead, which usually does not cause acute
symptoms or signs, is a frequent situation affecting urban populations, occupationally
exposed workers, and people living in the vicinity of polluting sources. In adults, chronic
exposure to lead causes progressive damage to the central and peripheral nervous systems
(Needleman et al. 1979; Banks et al. 1997), a moderate increase in blood pressure
(Staessen et al. 1994), and effects on both male and female reproductive systems in
humans (Winder 1993) as well as in experimental animals (Ronis et al. 1996;
Tchernitchin et al. 1998, 2003), causing mainly infertility and an increased abortion rate.
It also affects the hematopoietic system (Grandjean et al. 1989; Pagliuca et al. 1990;
Graziano et al. 1991); for review of lead interference with biosynthesis of heme, see
NAS-NRC (1972). It depresses thyroid function (Tuppurainen et al. 1988) and causes
nephropathy (Weeden et al. 1975, 1979; Ong et al. 1987; Cooper 1988; Cardenas et al.
1993), intestinal colic, gastrointestinal symptoms (Baker et al. 1971; Pagliuca et al 1990),
and damage to the immune system, as shown in humans and experimental animals
(Ewers et al. 1982; Jaremin 1983; Cohen et al. 1989; Koller 1990; Lang et al. 1993;
Tchernitchin et al. 1997; Villagra et al. 1997). It may also cause effects on chromosomes
(Schmid et al. 1972, Deknudt et al. 1973; Al-Hakkak et al. 1986), increase mortality rate
(Cooper 1988), and decrease life expectancy.
Children, compared to adults, are more vulnerable to lead in several respects. They
typically engage in hand-to-mouth activities (sucking fingers, placing various objects in
A.N. Tchernitchin et al. Rev. Environ Contam Toxicol 185:93-139 © Springer 2005 95
the mouth), which results in greater ingestion of lead than adults; they present a greater
absorption and retention of lead; the exposures occur during sensitive periods of
development; and children are generally more sensitive than adults to the toxicological
effects of lead at a given blood level (Davis and Grant 1992).
In children, chronic exposure to lead causes a slowing of growth (Schwartz et al.
1986), hearing impairment (Schwartz and Otto 1991; Dietrich et al. 1992),
neurobehavioral alterations (Byers and Lord 1943; Needleman et al 1996; Banks et al.
1997), decrease in the intelligence coefficient (Needleman et al. 1979; Banks et al 1997),
anemia (Schwartz et al 1990), decreased 1,25-dihydroxyvitamin D3 plasma levels
(Mahaffey et al. 1982) and action (Long and Rosen 1994), slowing of myelin fiber nerve
impulses (Davis and Svendsgaard 1990), intestinal colic and associated gastrointestinal
symptoms (USEPA 1986), and encephalopathy (USEPA 1986, 1990).
The effects of chronic exposure to lead in adolescents or adults may be reversed, at
least in part, after a decrease in blood levels. However, in children, especially at earlier
ages, the effects are irreversible, and may persist through life, and some effects may be
induced by the mechanism of imprinting (vide infra).
Lead exposure during pregnancy may lead to congenital anomalies, as reported by
Needleman et al. (1984). Lead was found to be associated, in a dose-related fashion, with
an increased risk of minor anomalies, mainly hemangiomas and lymphangiomas,
hydrocele, minor skin anomalies, and undescended testicles. Lead exposure of pregnant
mothers is also associated with low infant body weight at birth (Ward et al. 1987;
Bornschein et al. 1989).
Lead exposure during the last months of pregnancy or during early postnatal life
causes irreversible changes that persist through life through the mechanism of imprinting.
The hypothesis for this mechanism was first proposed by György Csaba, who showed in
experimental animals that exposure of fetuses to some hormonally active agents during
critical periods of their development induces permanent changes in the action of related
hormones (Csaba 1980). These changes can be detected later in adulthood as a
modification in the activity of receptors and in the intensity of responses mediated by
them (Dobozy et al. 1985; Csaba et al. 1986). This effect of hormones during fetal or
neonatal life, permanently modifying the ability of the cells to react to hormone
stimulation during adulthood, was named by Csaba "imprinting" (Csaba 1980; Csaba et
al. 1986). Work performed in our Laboratory demonstrated that, besides hormones,
several other agents such as pollutants, including lead, pharmaceuticals, food additives,
and normal constituents of food when ingested at abnormal amounts, may activate the
mechanism of imprinting and induce persistent biochemical and functional changes that
cause the development of diseases later in life (Tchernitchin and Tchernitchin 1992;
Tchernitchin et al. 1999).
Exposure to lead during the perinatal period may occur in mothers previously exposed
to the metal, presenting increased concentration of lead in bones. Such mothers, during
pregnancy or breastfeeding, require additional calcium that is obtained from bone
reserves with lead stored together with calcium and is transferred through placenta or
breast milk to the fetus or child during the period of life when it is most sensitive to lead.
A.N. Tchernitchin et al. Rev. Environ Contam Toxicol 185:93-139 © Springer 2005 96
Among the delayed effects induced by this mechanism and evident during childhood,
adolescence or adult life, are neurobehavioral alterations such as decrease in the
intelligence coefficient (IQ), aggressive behavior, and a tendency to drug abuse and to
delinquent behavior (see Tchernitchin et al. 1999 for a review of the mechanisms
involved).
In Chile, besides the classical sources of exposure to lead existing throughout the
world (the use of leaded gasoline, lead paints, clusters originated from point sources, food
contamination with lead, occupational exposure), there are special cases that deserve
additional analysis. Lead exposure has caused considerable damage to Chilean population
health. A description of the main sources of exposure, especially those nonfrequent
sources affecting large numbers of people, the evolution of Chilean legislation and the
role of different organizations and institutions in changing policies, and regulations to
prevent exposure to lead, may constitute a useful experience for other countries that are
less advanced in prevention and mitigation of lead contamination.
The purpose of this review is to describe available information on the main sources of
lead pollution in Chile and report the most conspicuous episodes of lead contamination,
describe the most relevant clinical and laboratory findings in exposed population,
summarize the evolution of legislation in the country, and analyze proposed actions for
remediation and human protection.
II. Primary Sources in Chile
Formerly the greater source of lead contamination in Chile was the use of leaded
gasoline, mainly in densely populated cities. The progressive decrease in lead content in
leaded gasoline, which was banned in April 2001 (SESMA Chile 2002), was the main
cause of a decrease in urban lead pollution; however, large amounts of fine lead particle
still persist in highly populated cities as city soil and home soil, and as ground
contamination near highways, which can be detected in several vegetables such as lettuce
grown near highways or within highly populated cities (see following). The Government
of Chile issued new regulations for lead in air (DS 136/2000 Chile 2000), allowing
0.5 µg/m3
as maximal annual mean.
Another important source of lead contamination was the use of paints with high lead
content for painting houses, children’s furniture and toys, and other objects. From 1997
on, new legislation regulated lead content in paints (D 374/97 Ministry of Health, Chile
1997); houses, furniture, children’s toys, and other objects painted before 1997 are still an
important source of exposure to lead, mainly in children. Children’s toys, pencils, and
other school tools and implements, which children frequently take into their mouth,
constitute sources of exposure to lead.
Various degrees of food lead contamination may increase exposure to the metal.
Vegetables grown in or near highly populated areas, lead pipes in old dwellings or copper
pipes welded with lead, and formerly lead from canned food, especially those cans that
had been accidentally deformed, or food stored in opened cans may contribute.
A.N. Tchernitchin et al. Rev. Environ Contam Toxicol 185:93-139 © Springer 2005 97
Fig. 1. Map of Chile, showing location of cities mentioned in text.
Clusters of different magnitude originated from point sources, of which the most relevant
in magnitude was that occurring in Ñuble with the use of wheat flour contaminated with
lead, caused by the use of a mill whose stone had been repaired by lead welding. Several
other clusters of smaller magnitude are frequently caused by the practice of battery repair and
recovery by small enterprises or as family projects, affecting all family members and
occasionally those living in the vicinity. Occupational exposure frequently occurs in painters,
welders, and mining or smelting workers, among others.
In addition to the traditional sources of exposure to lead common in other countries, in
Chile a few special cases of very important environmental contamination occurred,
affecting the population of two important cities. The most dramatic case was the storage
of powdered lead mineral concentrates at the ports or railroad terminals within the cities
of Arica and Antofagasta (Fig. 1), where it would remain until it could be shipped by sea.
Lead from this source is the most relevant source of exposure in the cities of Arica and
Antofagasta. The second case of lead pollution originated from toxic wastes imported by
Promel from the Swedish company Boliden Metal as “toxic raw material for industrial
purposes”. Local health authorities (1983-1985), although they knew the exact
composition of the toxic wastes, informed that “the material is not toxic, anybody can
manage it, it cannot be ingested”. This material turned out to be hazardous toxic wastes
sent to Chile by Boliden Metal and stored without any protection in Arica suburbs
between 1983 and 1985, where, a few years later, new dwellings were constructed and
residents were exposed for more than 10 years.
III. Lead in Household Paints
Before 1996 there was no regulation on lead content in household paints. Considering
that it is an important cause of increased blood levels in children, caused by pica
ingestion (mainly leaded paint chips and powder), many other countries have strict
A.N. Tchernitchin et al. Rev. Environ Contam Toxicol 185:93-139 © Springer 2005 98
regulations. Following several recommendations to the Government by the Colegio
Médico de Chile (Chilean Medical Association) that were not taken into consideration,
the Colegio Médico measured lead levels in several commercially available paints.
Measurements were made by atomic absorption spectroscopy at the Institute of Public
Health of the Chilean Ministry of Health. Table 1 shows the lead content (w/w) in
household paints (as dry wt of paint) in most commonly sold brands and types in Chile in
1996 (Tchernitchin and Castro 2002).
As soon as the finding of high lead content in household paints sold in Chile was
communicated in a press conference, the Ministry of Health organized a commission with
the participation of the Colegio Médico to study and propose new standards for lead
content in paints. These new standards were approved in 1997 as Regulation 374 from
the Ministry of Health, allowing a maximum of 0.06% (dry wt) lead content in paint (D
374/97 Ministry of Health Chile 1997).
The highest lead content in paints corresponded to the brandname of Sherwin Williams
(an American corporation that licensed the formula to a Chilean company) that contained
nearly 20% lead in the Sherwin Williams yellow brilliant oil enamel. A similar Sherwin
Williams paint purchased in Miami, FL, U.S.A. contained nonmeasurable levels of lead
Table 1 Lead content (w/w) in household paints (as dry wt of paint) in most commonly sold brand names
and types in Chile (1996).
Paint trade mark Type of paint Color
Lead %, w/w
dry wt
Sherwin Williams Enamel oil Yellow 19.814
Tricolor Enamel oil Red 9.518
Sherwin Williams Enamel oil Vermilion 4.935
Tricolor Enamel oil Cream 3.537
Soquina Enamel oil Black 1.035
Sherwin Williams Enamel oil Blue 0.921
Sherwin Williams Enamel oil White 0.591
Iris Enamel oil Green 0.563
Tricolor Enamel oil Brown 0.425
Tricolor Enamel oil Blue 0.420
Soquina Anticorrosive Black 0.388
Soquina Enamel Oil Calypso 0.338
Iris Cover oxide Red 0.329
Soquina Anticorrosive Red 0.150
Sipa Oil opaque Grey 0.066
Iris Latex Green 0.011
Iris Latex Black 0.006
Sherwin Williams Latex White 0.003
Sherwin Williams Latex Blue 0.002
Sipa Latex Blue 0.002
Sipa Latex Apricot 0.002
Source: (Tchernitchin and Castro, 2002).
A.N. Tchernitchin et al. Rev. Environ Contam Toxicol 185:93-139 © Springer 2005 99
(Tchernitchin 2001; Tchernitchin and Castro 2002). This finding was the root of the
proposition of the Colegio Médico de Chile (Chilean Medical Association) through the
Sustainable Development Council of Chile at the Johannesburg Summit 2002, according
to which countries should agree on treaties forbidding exportation of products banned in
the countries of their origin because of their health risk, to importing countries without
regulations, based on ethical considerations (Tchernitchin and Villarroel 2002, 2003).
Although paints with high lead content supposedly were not sold in Chile after 1997,
in many houses walls are painted with lead paint. When a house, especially indoors, is to
be painted again, the old paint must be removed; the paint removal procedure widely
used in Chile is done with sandpaper or by scraping, leading to the accumulation of high
amounts of fine lead-containing dust that remains for a long time inside recently painted
buildings and is a source of exposure mainly for children that bring to their mouth toys or
other objects from the floor, thus ingesting lead-containing dust adhered to these objects.
IV.Lead in gasoline
The Metropolitan Area of Santiago (Figs. 1, 2) presents high levels of atmospheric
pollution, which are favored by geographic and climatic adverse conditions for the
dispersion of pollutants during fall and winter months, and by an increase in economic
activity and growth of the city in population and especially in its area. Santiago
concentrates 39% of the total Chilean population; its area is 15554.5 km2
, about 2.1% of
the total surface of the country (excluding the Antarctic Territory). Its urbanized surface
is about 520 km2
, with 1,710 km2
used for agriculture; and the remaining surface is
mountainous.
The city of Santiago is topographically located in a depression, about 500 to 650 m
above sea level, and is surrounded by mountains: the highest range, east from Santiago, is
the Andean mountains, those closest to the city bordering 3000 m above sea level and
higher mountains toward the border with Argentina; the Coastal Range, west from
Santiago, with mountains bordering 2000 m above sea level with a narrow strip
connecting the Santiago depression with lower altitudes bordering the Pacific Ocean;
north from Santiago, mountains about 1200 m above sea level joint the Coastal Range
with the Andean mountains, and south from the city there exists a very narrow valley that
connects the Santiago lowlands with the central valley that becomes wider to the south.
In addition to topographical conditions increasing pollution in the Santiago depression,
adverse meteorological conditions exist that worsen during the fall and winter. These
include stable atmospheric conditions, mild winds whose direction reverses during night
hours, and the atmospheric inversion layer that lowers in altitude and intensifies during
certain meteorological episodes during fall and winter, which increase the concentration
of various pollutants in air, including lead in breathable particles (<2.5 µm dia).
Winds in the city area are very weak during fall and winter seasons, except the
occasional frontal systems that cross the area during the rainy season (May-July, 2-4
times/mon) during that season. Between the frontal episodes there are very stable
A.N. Tchernitchin et al. Rev. Environ Contam Toxicol 185:93-139 © Springer 2005 100
Fig. 2. Map of the Santiago Metropolitan Area, indicating the communities or parts of the city mentioned
in the text. The dark shaded area corresponds to the densely populated area of Santiago.
atmospheric conditions, and winds are very weak and change their direction from SW
during daylight hours to NE during the night. Therefore the same air may remain for
several days or even longer than a week over the city during the fall and winter.
The atmospheric inversion is a layer of warm air that covers a cooler layer beneath and
constitutes an obstacle for mixing the layer of polluted city air with the higher clean
layers. This inversion layer is thin during the spring and summer and is situated at much
higher altitude; therefore, the thickness of this lower layer increases, diluting pollutants
with a greater air volume. During the warm season, this inversion frequently breaks up,
allowing pollutant dispersion by convection. During fall and winter seasons, this
inversion is at low altitude (50-300 m), decreasing the volume of air to dilute city
pollutants, and intensifying the inversion (i.e., increasing the difference in temperature
between the upper warm layer and the lower cool layer). Most mountains surrounding
Santiago are higher than the inversion layer so that the pollutants remain in the
A.N. Tchernitchin et al. Rev. Environ Contam Toxicol 185:93-139 © Springer 2005 101
depression. The inversion further intensifies under certain meteorological conditions
characterized by low wind speeds related to the movement of low atmospheric pressures
along the coast, so-called A-type episodes, that intensify the subsidence inversion; i.e.,
lower air temperature at ground level covered by a higher temperature air layer resulting
from heating of air currents descending from the Andean mountains (Gallardo et al.
2000). This situation affects most of Central Chile and in Santiago and other cities gives
rise to extreme pollution episodes. These characteristic patterns affecting air pollution in
Santiago were described in detail by Ruthllant and Garreaud (1995).
Taking into consideration the above conditions increasing pollution in Santiago
metropolitan area, and that one of the components of this pollution is lead, whose main
source was the wide use of leaded gasoline, it was necessary to determine blood lead
levels in residents of Santiago and their change through the different seasons. This
situation was the justification of investigations of blood lead levels and of biological
indicators of exposure to lead in Santiago under different climatic conditions, comparing
them to those in other less-populated cities. In this context, the amount of lead released
from primary sources was also important information that was needed.
0
2
4
6
8
10
12
14
16
18
Child Care Center
U-ALAconcentration(µg/L)
Conchalí
Conchalí
Conchalí
L Condes
L Condes
L Condes
Downtown
Downtown
Downtown
Cisterna
Cisterma
Las Rejas
Las Rejas
Las Rejas
S Bernardo
Rengo
Fig. 3. Urine delta aminolevulinic acid in 2- to 5-yr-old children in 1979, from child-care centers in
central Santiago, in suburban Santiago and in Rengo,. One to 3 child care centers were investigated in
each area. (Modified from Cisternas and Sáez 1980).
A.N. Tchernitchin et al. Rev. Environ Contam Toxicol 185:93-139 © Springer 2005 102
The early studies on lead exposure, done in 1979 (Cisternas and Sáez 1980), measured
the concentration of the delta aminolevulinic acid in the urine of children 2-5 yr old in
childcare centers in central Santiago (downtown), in the suburban Santiago (Conchalí,
Las Condes, La Cisterna, Las Rejas, and San Bernardo; see Fig. 2), and Rengo (south of
Santiago; see Fig. 1). Figure 3 shows that the urine concentration of delta aminolevulinic
acid, an indicator of increased levels of lead in the blood, was much higher in the central
part of Santiago than in suburban Santiago and that the lowest levels are in Rengo. Figure
3 calls attention to high levels in San Bernardo, in spite of being suburban, which can be
explained by the fact that it is surrounded by industrial areas and is located in the area of
influence of Caletones (Gallardo et al. 2000), a copper smelter in the mountains southeast
of San Bernardo.
A study performed during 1992 (Ministry of Health, Chile 1993) compared blood lead
levels (measured by atomic absorption spectroscopy) from newborn children (umbilical
cord blood) and at 6, 12 and 18 mon of age, from Santiago and from the city of San
0
1
2
3
4
5
6
7
C.Umb. 6 12 18
Children's age (months)
Bloodleadlevels(µg/dL)
Sn.Felipe
Santiago
Fig. 4. Lead levels in umbilical cord blood of newborn children and 6-, 12-, and 18-mon-old children
from Santiago and San Felipe, 1992 cohorts. (From Ministry of Health, Chile 1993)
A.N. Tchernitchin et al. Rev. Environ Contam Toxicol 185:93-139 © Springer 2005 103
-2
0
2
4
6
8
10
12
14
16
Umb cord 6 12 18
Children's age (months)
%childrenwithbloodleadlevels
>=10µg/100mL
Sn.Felipe
Santiago
Fig. 5. Percentage of children with blood lead levels ≥10 µg/dL, from Santiago and in San Felipe, 1992
cohorts. (From Ministry of Health, Chile 1993.)
Felipe (see Fig. 1). Figure 4 shows that blood levels were higher in children from
Santiago than those from San Felipe and that blood levels increased from birth up to 18
mon of age. Figure 5 shows that the percentage of children with blood levels ≥10 µg/dL,
considered at risk, are higher in children from Santiago than in San Felipe.
Comparison of data from Fig. 6 shows the seasonal variation of blood lead levels in
children from Santiago and San Felipe (1992-1993). Data from Fig. 7 show the monthly
averages of lead in the air of these locations. About a 1-mon delay can be observed
between the increase in lead in the air and the increase in blood levels. Both figures also
show that lead levels are lower in the city of San Felipe than in Santiago.
Further, a 1992-1995 comparison of children from downtown Santiago, Maipú (a
suburb west of downtown Santiago) and the city of San Felipe (Frenz et al., 1997) (see
Figs. 1, 2) showed that blood levels in Santiago were slightly higher than in the
remaining locations with San Felipe displaying the lowest levels. Children from all three
A.N. Tchernitchin et al. Rev. Environ Contam Toxicol 185:93-139 © Springer 2005 104
0
1
2
3
4
5
6
7
Jan
Feb
Mar
Apr
May
Jun
Jul
Aug
Sep
Oct
Nov
Dec
Bloodleadlevels(µg/dL)
Santiago
San Felipe
Fig. 6. Blood lead levels in children from birth to the age of 24 mon from Santiago and San Felipe, 1992-
1993. (Modified from Frenz et al. 1997.)
locations displayed an increase in blood levels from birth to the age of 1 yr; thereafter,
lead levels tended to stabilize or slightly decrease (Fig. 8). Figure 9 shows the important
difference between Santiago and the remaining locations when comparing percentage of
children with blood levels >10 µg/dL).
Four important actions taken by the Chilean government decreased lead concentration
in air and lead blood levels in the population: (1) the introduction of unleaded gasoline in
addition to leaded gasoline in 1990, which according to the 2003 Prevention and
Descontamination Plan for the Metropolitan Area of Santiago approved by Regulation
(DS 058/03 Chile 2003) is allowed to have a maximal lead content of 0.013 g/L; (2) the
0
0.5
1
1.5
2
2.5
Jan
Feb
Mar
Apr
May
Jun
Jul
Aug
Sep
Oct
Nov
Dec
Leadinair(g/m3
N)
Santiago
San Felipe
Fig. 7. Lead concentrations in air (monthly averages) in Santiago and San Felipe, 1992-1993 (Modified
from Frenz et al. 1997.)
A.N. Tchernitchin et al. Rev. Environ Contam Toxicol 185:93-139 © Springer 2005 105
0
1
2
3
4
5
6
7
Umb.Cord 6 12 18 24
Age (mon)
Bloodleadlevels(µg/dL)
San Felipe
Maipú
Santiago
Fig. 8. Effect of age on lead blood levels in 0- to 24-mon-old children from downtown Santiago, Maipú,
and San Felipe, 1992-1995. In newborns, blood taken from umbilical cord. (From Frenz et al. (1997.)
compulsory use of cars with catalytic converters from 1992 models on (which does not
allow the use of leaded gasoline because its lead damages the converter); (3) the
progressive decrease in lead content in leaded gasoline, which was not available after
April 2001 (SESMA Chile 2002); and (4) the approval of the new standard for lead in air
(0.5 µg/m3
as annual mean level), legally valid from February 2001 (DS 136/00 Chile
2000). Additionally, new regulations on lead content in household paints (see below) and
more strict measures for industry emissions of particulate matter contributed to the
decrease in lead levels in air and its effects on the population of Santiago.
According to information provided by the Enviromental Health Service of the
Metropolitan Area of Santiago (SESMA Chile 2001), the annual use of leaded and
unleaded gasoline in the metropolitan area of Santiago since 1992 is shown in Fig. 10, the
concentrations of lead in gasoline in 1997-1999 are shown in Table 2, and the
contribution of leaded gasoline to the total amount of lead released into the air of the
metropolitan area of Santiago in 1997-1999 is shown in Table 3.
A.N. Tchernitchin et al. Rev. Environ Contam Toxicol 185:93-139 © Springer 2005 106
0
1
2
3
4
5
6
7
Umb cord 6 12 18 24
Age (months)
%childrenwithbloodleadlevelsover10µg/100mL
Sn.Felipe
Maipú
Santiago
Fig. 9. Effect of age on the proportion of subjects with lead blood levels >10 µg/dL in 0- to 24-mon-old
children from Downtown Santiago, Maipú and San Felipe, 1992-1995 (From Frenz et al. 1997.)
It was assumed that the progressive decrease in lead released into the air originating
from leaded gasoline in the Santiago metropolitan area should result in a progressive
decrease in the concentrations of lead in the air of Santiago and, consequently, in the
levels of lead in the blood of the general population. A study performed in three
locations of the city (La Pintana, Avenida Ossa, and Cerrillos by SESMA Chile
(2001) demonstrated the progressive decrease in lead in the air at these locations (Fig.
11). The figure shows the differences between the different locations in Santiago,
which can be attributed to the amount of cars using leaded gasoline at these locations
and the wind directions at hours of heaviest traffic. Also shown are the seasonal
A.N. Tchernitchin et al. Rev. Environ Contam Toxicol 185:93-139 © Springer 2005 107
0
200,000
400,000
600,000
800,000
1,000,000
1,200,000
1,400,000
1,600,000
1,800,000
2,000,000
1991
1992
1993
1994
1995
1996
1997
1998
1999
2000*
Year
Gasolineconsumptionperyear(m3)
Leaded
Non leaded
Total
Fig. 10. Annual use of leaded and unleaded gasoline in the Metropolitan Area of Santiago 1991-2000; *,
estimation for 2000. (From SESMA Chile 2001.)
variations in lead concentrations in the air due to climatic conditions, mainly the
decrease in the altitude of subsidence inversion and extremely stable atmospheric
conditions in fall and winter (vide supra).
Table 2. Lead content in leaded gasoline in the metropolitan
Santiago in 1997-1999.a
Year Pb (g/L)
1997 0.32
1998 0.25
1999 0.19
a
According to new 2003 regulations, unleaded gasoline
maximum allowed lead is 0.013 g/L (DS 058/03 Chile
2003)
Source: SESMA Chile (2001)
A.N. Tchernitchin et al. Rev. Environ Contam Toxicol 185:93-139 © Springer 2005 108
Table 3. Lead released through use of leaded gasoline in
metropolitan Santiago in 1997-1999
Year Lead Ton/year
% lead reduction from
1997
1997 197.1 ---
1998 116 41.10%
1999 73.25 62.80%
Source: SESMA Chile (2001)
0
0.1
0.2
0.3
0.4
0.5
0.6
La Pintana Avenida Ossa Cerrillos
Location of lead measurement station
Leadinair(µg/m
3
),annualmeans
1997
1998
1999
2000
Fig. 11. Annual averages of air lead concentration in La Pintana, Avenida Ossa, and Cerrillos, (1997-
2000). (From SESMA Chile 2001.)
V. Lead Exposure Clusters
Clusters of various magnitude originated from point sources, of which the most relevant
occurred in Ñuble as a result wheat flour contaminated with lead, caused by the use of a
millstone repaired by lead welding. Several other clusters of smaller magnitude are
frequently caused by the common practice of battery repair and recovery by small
enterprises or as family projects, affecting all the family and occasionally those living in
the vicinity.
A. The Ñuble Case: Lead in Wheat Flour
This case of a massive intoxication with lead was reported in extenso by Alonso et al.
(1997). The massive exposure was discovered with the case of two children that were
attended by the Ñuble health service on January 26, 1996, with signs of malnutrition and
abdominal and leg pain (Alonso et al. 1997). Both children were interned at the hospital
A.N. Tchernitchin et al. Rev. Environ Contam Toxicol 185:93-139 © Springer 2005 109
with a diagnosis of malnutrition and serious anemia and a suspicion of maltreatment and
family violence. The latter suspicion was disregarded because the parents had gone to
different health centers several times during the past 3 mon because of the children’s
symptoms. It appeared that the head of the family had also been hospitalized recently
with a diagnosis of possible gastric ulcer, presenting also with anemia and muscular pain.
An hypothesis was drawn that an environmental condition was causing the family’s
disease. A site visit was coordinated for the next day. Following the suspicion of lead
intoxication, a hemogram was taken and revealed punctuate basophilia of erythrocytes in
both children, a characteristic sign of lead exposure. The diagnosis of lead toxicity was
finally confirmed by atomic absorption spectrometry of blood. The 6-yr-old girl had 104
µg/dL and her 9-yr-old brother 91 µg/dL. The girl died shortly thereafter, despite the
initiation of chelation treatment, and the boy developed serious neurological
complications.
A professional group from the Regional Public Health Service of Ñuble made the first
site visit to the home of the affected children. Sample analyses obtained from the site visit
are shown in Table 4. Following the girl’s death, several site visits were performed at the
family residence, homes in the neighborhood, and the residence of patients frequently
attending health centers in the region; these were aimed to determine the causes and
source of intoxication and the number of affected individuals. Samples of drinking water,
children’s toys, house wall paint, food (flour and wheat), soil, and blood were
investigated for their lead content at the Institute of Public Health of Chile. Results from
this study are shown in Tables 5 and 6.
This study identified the source of lead contamination, which was wheat flour
produced in a mill that had a grindstone repaired with lead welding in October 1995.
Thereafter, the study included homes in the neighborhood and the residences of patients
frequently attending health centers in the region. All these sampled families displayed
lead blood levels between 17 and 99 µg/dL. All except the case family worked for the
Table 4. Lead concentrations in samples collected in homes of affected
children.
Sample Lead concentration (µg/g)
Doll dress 0.74
Doll hear 0.01
Plastic spoon 0.01
Paint scrapping 7.32
Leaves from a garden plant 23.46
Soil of room for food storage 12.50
Soil surrounding home 37.50
Soil from behind residence 15.00
Well water Within legal limits (<0.05)
Source: Alonso et al. (1997).
A.N. Tchernitchin et al. Rev. Environ Contam Toxicol 185:93-139 © Springer 2005 110
Table 5. Blood lead levels of affected children, their family, and animals living with them.
Family of lead intoxicated
children
Lead
µg/dL
Animals living with
the family
Lead
µg/dL
6-yr-old girl (deceased as
result of lead poisoning)
104 Pig 25
9-yr-old brother 91 Horse (nd)
Younger sister 114
Father 148
Mother 87
Grandfather (living elsewhere,
frequently visiting the
family)
28
(nd), non detected.
Source: Alonso et al. (1997).
same employer, who gave them wheat flour as part of their salaries, at the San Luis
Estate. At this location 60 family heads were employed, and their blood levels were
determined. The wheat flour from this estate was milled in three mills; only one of them
produced lead-contaminated flour (see Table 6). Wheat samples did not display lead
content. At that moment it was found that one the two millstones had been fractured in
several fragments that were welded with lead welding and partially covered by melted
lead to join them to a metal arm. At a consequence, 8700 kg of contaminated flour was
destroyed.
The exposed population was considered to be 95 families living in the neighborhood
and all relatives of people that were noted in a register of clients that gave wheat to be
milled it in the repaired mill after the repair date, October 23 and 24, 1995, 3 mon before
Table 6. Lead measurements in wheat and wheat flour from various sources.
Wheat and wheat flour from different
sources Lead, mg/kg
Wheat flour used by the case family 110
Wheat flour used in Estate San Luis 174.9
Wheat flour used in Estate Serrano 207.2
Wheat flour used by family “2”, (the first
family identified with symptoms, without
any relation to the case family)
627.8
Wheat flour from Mill “Quiriquina A” < 1
Wheat flour from Mill “Quiriquina B” < 1
Wheat flour from Mill “Quiriquina C” 112.4
Wheat from other sources (nd)
(nd), non detected.
Source: Alonso et al. (1997).
A.N. Tchernitchin et al. Rev. Environ Contam Toxicol 185:93-139 © Springer 2005 111
Table 7. Subjects presenting symptoms within the total exposed population, according to
age.
Age (years)
n (lead-exposed
population)
Percent with
symptoms
Percent without
symptoms
< 6 231 10.9 89.1
6 - 15 488 10.7 89.3
> 15 1359 22.4 77.6
Source: Alonso et al. (1997).
the detection of the first case. A questionnaire was designed for the population to
determine consumption of products from the repaired flour mill; it contained questions
related to symptoms and signs of lead exposure and about the origin of their flour and the
ingested amounts. The Chilean Ministry of Health sent to Chillán, the main city of the
Ñuble province, professionals from the Department of Epidemiology of the Ministry,
from the Pan-American Health Organization (PAHO), and from the local health services,
who applied the following procedure: measurement of zinc proto porphyrine (ZPP)
concentrations in blood obtained from digital puncture and a request that the same
subjects complete a questionnaire. Four hundred ninety eight families totaling 2056
subjects, were studied. Blood collected by venipuncture was obtained for lead content
evaluation by atomic spectroscopy from children under 15 years old displaying ZPP
values of 3.5 or higher, and from subjects older than 15 years displaying ZPP values of 8
or higher. At the same times, all flour these families had stored at their homes was
destroyed (3400 kg). The treatment consisted of blood lead chelation with calcium EDTA
(ethylenediaminetetraacetic acid, calcium disodium edetate) at 1000 mg/m2
/d in two daily
doses, for 5 d, in hospitalized patients.
The age distribution of those 2056 investigated subjects was 11.24% of children under
6 years of age, 22.68% between 6 and 15 years, and 66.08% older than 15 years. Of
them, 18.9% (388 subjects) presented symptoms; these were classified as mainly
presenting abdominal symptoms (33.6%), musculoskeletal pain and leg fatigue (28.7%),
and other symptoms such as headache, weight decrease, and paleness (37.7%). The
proportion of subjects presenting symptoms from the total exposed population, at the
different age groups, is shown in Table 7. The lead line in the gums was found in 8
subjects only, all adults.
Table 8. Lead positive results from screening of zinc protoporphyrine (ZPP) concentrations in
blood, according to age.
Age
(yr)
n (total screenings in
lead-exposed population)
n subjects displaying positive
screening (see text)
Percent positive
(see text)
< 6 77 49 63.6
6 - 15 193 135 69.9
> 15 496 246 49.6
Source: Alonso et al. (1997).
A.N. Tchernitchin et al. Rev. Environ Contam Toxicol 185:93-139 © Springer 2005 112
Table 9. Subject distribution according to blood lead levels in two age groups.
Age <= 15 y Age > 15 y
Blood lead levels (µg/dL) n % n %
< 20 4 2.13 0 0
20-40 64 34.04 4 11.76
40-60 102 54.26 18 52.94
> 60 18 9.57 12 35.29
Total 188 100 34 100
Source: Alonso et al. (1997).
The results of the 766 persons screened for blood ZPP, and their distribution according
to age, are shown in Table 8. According to screening results, 188 determinations of blood
lead were performed in the group ≤15 years of age and 134 determinations in adults.
Table 9 shows the distribution of the subjects according to their age group and lead blood
levels. In the children 137 displayed levels ≥40 µg/dL and were treated. Their age
distribution is shown in Table 10.
Children were most affected because of the risk of sequelae in this age group.
According to the Ñuble study (Alonso et al. 1997), 604 children made up the affected
population, which corresponds to 39.9% of the population at risk. Of them, 590 were of
school age, therefore, several neurological and behavioral sequelae probably affected this
exposed population.
B. Other Clusters
Several other clusters of smaller magnitude are frequently caused by the widespread
practice of battery repair and recovery by small enterprises or as a familial productive
activity, affecting all family members and occasionally those living in the vicinity.
One typical case occurred in 1995 in Freire, 700 km south of Santiago. There was a
court sentence to relocate a lead processing plant due to contamination of soils used for
agriculture and that affected the health of residents in the vicinity of the plant for almost
20 years. This sentence was not obeyed, and the activity that was to be finished more than
1 mon ago continued. This motivated the police to close the buildings and seal the
Table 10. Age distribution of children treated with blood lead chelation.
Age (years) n children treated % children treated
< 1 1 0.7
1 – 5 20 14.6
6 – 14 113 82.5
15 3 2.2
Total 137 100
Source: Alonso et al. (1997).
A.N. Tchernitchin et al. Rev. Environ Contam Toxicol 185:93-139 © Springer 2005 113
furnace where old lead batteries were melted. The Araucanía Regional Health Service
detected, in December 1994, “very high lead levels in the blood” in six children and eight
adults in relation to this cluster.
VI.Special Cases
Two special cases of important lead exposures in Chile are analyzed separately: the
Antofagasta case of lead contamination that originated from powdered lead mineral
concentrate transport and storage, and the Arica case of lead contamination, which
originated from both powdered lead mineral concentrate transport and storage and from
lead- and arsenic-containing toxic wastes brought from Europe.
A. The Antofagasta Case: Powdered Lead
Mineral Concentrates from Bolivia
Antofagasta is a coastal city and port in the north of Chile. The main source of lead
pollution was powdered lead mineral concentrates, mainly lead sulfide containing about
26.5% lead according to measurements made at the Institute of Public Health of Chile,
Chilean Ministry of Public Health. This mineral, transported through the city and openly
stored near densely populated parts of the city, comes by railroad from Bolivia.
According to an old international treaty between both countries, Chile is obliged to
transport and keep the mineral in its ports until exported by sea to other countries. Until
2002-2003 it was stored in open sites at the Antofagasta port until it could be transported
overseas, or at the railroad terminal in Antofagasta, where it usually was stored for years
and then transported by trucks to the port, spilling the mineral on its way through the city.
The mineral storages were not protected against wind; therefore, a significant amount of
lead-containing particles was swept by wind to the vicinity, where there were numerous
dwellings, the residences of numerous Antofagasta habitants.
The Colegio Médico Regional Antofagasta (Antofagasta Regional Medical
Association) drew the conclusion that there was massive exposure to lead in Antofagasta
in 1996-1997, based on signs and symptoms suggesting lead toxicity in patients living in
the vicinity of lead mineral storage sites. This was the root of the Antofagasta Study by
the Colegio Médico de Chile (National Chilean Medical Association) and associated
researchers (Andrei N. Tchernitchin, Nina Lapin and Carlos Acevedo) reported below.
The Antofagasta Colegio Médico study included a group of 84 residents living closer
than 200 m from the mineral storage place in the Chilean-Bolivian railroad terminal
station, who voluntarily agreed to undergo the study. The age distribution of the sample is
shown in Table 11.
Blood samples were taken from these residents, who were informed of the purpose of
the study and accepted the procedure. Lead levels were measured and an anamnesis and
physical examination was performed by one of us (CA), searching for neurological signs
and symptoms including learning deficit and behavioral alterations. Figure 12 shows
A.N. Tchernitchin et al. Rev. Environ Contam Toxicol 185:93-139 © Springer 2005 114
Table 11. Age distribution the 1997 Antofagasta lead
study subjects, comprised of residents living less than
at 200 m from the mineral storage site in the Chilean-
Bolivian railroad terminal station.
Age (yr) n
1-2 7
3-4 5
5-6 7
7-8 10
9-10 10
11-12 15
13-88 30
mean blood levels for each age group; the ages most affected with the highest levels are
1-4 and 7-10 yr. In the distribution of children (1-10 yr old), according to blood levels, only
8% of children 1-10 yr old displayed levels below 10 µg/dL and 8% had levels between 40
and 49 µg/dL. Figure 13 shows the distribution of all ages according to blood levels.
Neurological evaluation of the study group of these 84 residents (all ages) revealed
that the percentage of subjects displaying neurological manifestations increased in groups
with higher blood lead levels (Fig. 14). A similar situation was observed for the children
1-10-yr-old (Fig. 15).
Neurological manifestations were evaluated as the sums of scores of the different
neurological signs and symptoms from anamnesis and physical examination by the
neurologist from our research team (CA), which included learning deficit and behavioral
0
5
10
15
20
25
30
1-2 3-4 5-6 7-8 9-10 11-12 13-88
Age (years)
Leadlevelintheblood(µg/dL)(means)
Serie1
Fig. 12. Blood lead levels in subjects living less than 200 m from lead mineral storage site in Antofagasta
railroad station (1997).
A.N. Tchernitchin et al. Rev. Environ Contam Toxicol 185:93-139 © Springer 2005 115
< 10
26%
10 to 19
45%
20 to 29
18%
30 to 39
7%
40 to 49
4%
< 10
10 to 19
20 to 29
30 to 39
40 to 49
Fig. 13. Blood lead levels (µg/dL) distribution in the group of residents (all ages) living less than 200 m
from lead mineral storage site in Antofagasta railroad station (1997).
alterations. For each symptom or sign, value 1 was assigned to moderate intensity and 2
for severe. Results are shown for all age froups (Fig. 16) and for the children 1-10 yr in
age (Fig. 17), where intensity of neurological manifestations is correlated with blood lead
levels in both the children and all age groups.
Other studies continued with the investigation of blood levels in Antofagasta
residents, classifying them into three groups according to the place of their residence:
(1) in the vicinity of the lead mineral storage place at the railroad station, (2) in the
vicinity of the port, where the concentrated mineral also was stored, and (3) a control
group situated far away from contamination sources and the predominant wind
direction from any of the contaminated places in Antofagasta. These sites and their
residents were evaluated for lead concentrations in air, soil, and drinking water and
0
10
20
30
40
50
60
70
80
90
100
3-9 10-19 20-29 30-49
Lead level in the blood (µg/dL)
%ofpopulationwithneurological
manifestations
Fig. 14. Percentage of subjects displaying neurological manifestations, according to blood lead level, in
the group of residents (all ages) living less than at 200 m from lead mineral storage site in Antofagasta
railroad station.
A.N. Tchernitchin et al. Rev. Environ Contam Toxicol 185:93-139 © Springer 2005 116
-10
0
10
20
30
40
50
60
70
80
90
100
3-9 10-19 20-29 30-49
Lead level in the blood (µg/dL)
%ofpopulationwithneurological
manifestations
Fig. 15. Percentage of subjects displaying neurological manifestations, according to blood lead levels, in
the group of yr 1- to 10-yr-old children living less than 200 m from lead mineral storage site in
Antofagasta railroad station.
lead concentrations in the blood during 1998 (Sepúlveda et al. 2000). Table 12 shows that
the geometric means of lead levels in blood were more than doubled in the population
living near the railroad station than in the control location: levels of residents near the
port had lower levels than in those near the railroad station but considerably higher than
in the control location. Samples of lead levels in the soil around residences near the
railroad, or in the dust over the dwellings or inside homes, had much higher levels than in
control locations, some of them reaching >3 g lead/kg; the highest level in the control
0
1
2
3
4
5
6
3-9 10-19 20-29 30-39 40-49
Lead levels in the blood (µg/dL)
Intensityofneurologicaleffects
Fig. 16. Intensity of neurological manifestations in the group of residents (all ages) living less than 200 m
from lead mineral storage site in Antofagasta railroad station, and their blood lead levels.
A.N. Tchernitchin et al. Rev. Environ Contam Toxicol 185:93-139 © Springer 2005 117
-1
0
1
2
3
4
5
6
3-9 10-19 20-29 30-39 40-49
Lead levels in the blood (µg/dL)
Intensityofneurologicaleffects
Figure 17. Intensity of neurological manifestations in the group of residents (1-10 yr old) living less than
200 m from lead mineral storage site in Antofagasta railroad station and their blood lead levels.
location was 321 mg/kg. The study did not investigate the location near the port.
Levels of lead in respirable particulate matter (<10 µm-diameter particles) in air were
two fold higher in the port than near the railroad station. Lead in air seemed to be
lower in the control location, but this information cannot be taken into consideration
because it comes from measurements made over 2 mon, in contrast to the other
measurements that averaged 6 months, and the station-dependent climatic conditions
may alter lead concentration in air.
Table 12. Lead concentrations in blood and environmental lead in three areas of Antofagasta,
1998.
Lead (µg/m3
) in air respirable
particulate matter (<10 µm
diameter)a
Lead content in
soil (mg/kg)
Lead in blood
(µg/dL), geometric
means
Port area 0.28 (6 months) 6.890
Railroad Station
area
0.14 (6 months) 81 to 3159 8.671
Non-contaminated
control area
0.10 (2 months) 51 to 321 4.221
a
Time in parenthesis is sampling period over which data were averaged.
Source: Modified from Sepúlveda et al. (2000).
A.N. Tchernitchin et al. Rev. Environ Contam Toxicol 185:93-139 © Springer 2005 118
Table 13. Percentage of subjects with more than 10 and 20 µg/dL lead in their blood in
three areas of Antofagasta, 1998.
Sample size Blood lead ≥10 µg/dL Blood lead ≥20 µg/dL
n n % of sample n % of sample
Port area 54 17 31.5 % 5 9.3 %
Railroad Station area 432 205 47.5 % 43 10 %
Non-contaminated
control area
75 0 0 % 0 0 %
Total 561 222 39.6 % 48 8.6 %
Source: Modified from Sepúlveda et al. (2000)
Table 13 shows that all 75 subjects living in the noncontaminated area displayed lower
lead levels in blood than in those in both contaminated areas, which had blood lead levels
≥10 or 20 µg/dL, the highest being in residents near the railroad station. Table 14 shows
the age distribution of subjects with >10 and 20 µg/dL lead in blood in the above three
areas of Antofagasta. Table 15 illustrates the association of geographic location of
residence and blood levels in exposed locations. Further, the Sepúlveda et al. (2000)
study demonstrated that the distance of dwellings from lead storage sites, their
geographic location, and their antiquity were significantly associated with high blood
levels, and that multivariate models disclosed that people living in contaminated sites
(near storage places of the railroad or near the port) have odds ratios of 24.85 and 22.56,
respectively, for blood lead levels ≥ 7 µg/dL.
Carboncillo Beach, City of Antofagasta. In 1991 a heavy rain event occurred in the city
of Antofagasta and its surroundings, which is unusual because of an extremely dry
Table 14. Age distribution of subjects with more than 10 and 20 µg/dL lead in blood, in three
areas of Antofagasta, 1998.
Sample size Blood lead ≥10 µg/dL Blood lead ≥20 µg/dL
Age (years) n n % of sample n % of sample
<1 55 18 32.7 % 3 5.5 %
1 60 26 43.3 % 6 10 %
2 60 31 51.7 11 18.3
3 63 37 58.7 8 12.7
4 72 34 47.2 10 13.9
5 73 34 46.6 4 5.5
6 68 29 42.6 4 5.9
7 33 11 33.3 1 3.0
Total 484 220 45.5 % 47 9.7 %
Source: Modified from Sepúlveda et al. (2000)
A.N. Tchernitchin et al. Rev. Environ Contam Toxicol 185:93-139 © Springer 2005 119
Table 15. Geographic location of residence and blood lead levels in exposed locations, 1998
Lead levels in the blood Degree of exposure to lead Percent of population
High 21.5 %
Intermediate 10.1 %
Lead ≥ 20 µg/dL
Low 3.8 %
High 63.6 %
Intermediate 45.0 %
Lead ≥ 10 µg/dL
Low 37.5 %
Source: Modified from Sepúlveda et al. (2000)
climate with an average rainfall of 1.7 mm/yr (30 yr average). An alluvial flood of water
crossed part of the city, carrying a large amount of soil, and swept off stored mineral
concentrates from the storage site at the railroad station. This material was carried to the
ocean, and presumably is the main source of lead contamination at Carboncillo Beach,
one of the city’s beaches. The Regional Public Health Service of Antofagasta (2000)
reported very high levels of lead in this location. In the beach intertidal sand it reached
2710 mg lead/kg; on the seafloor near the beach, at 2-5 m beneath the surface it reached
1930 mg lead/kg in sediments, and at 10-m depth it reached 1080 mg/kg in sediments,
compared to reference sites in Antofagasta (23 to 61 mg/kg lead).
We investigated a case of a family who moved to a house located 50 m from the
Carboncillo Beach and had been living there for about 2 yr (1999-2001). All three
members of the family presented severe neurological problems and irreversible brain
damage assessed by single photon emission computed tomography (SPECT) for cerebral
perfusion with Tc-99m HMPAO (hexamethyl propyleneamine oxime). The family moved
to Santiago, and 6 mon after moving from Antofagasta received the diagnosis of lead
exposure sequelae. Blood levels of lead 6 and 12 mon after leaving Antofagasta are
shown in Table 16.
In all three family members, SPECT for cerebral perfusion with Tc-99m HMPAO at 6
mon after leaving Antofagasta, revealed multifocal hypoperfusion of uneven distribution
and several broad areas with hypoperfusion in the brain, and additionally bilateral
Table 16. Changes in blood lead levels in family after moving from lead exposure source in
Carboncillo Beach, Antofagasta.
Family member Father Mother Son
Age when leaving Antofagasta 38 years old 28 years old 2 years old
Blood lead levels 6 mon later 34.6 µg/dL 36.9 µg/dL 32.2 µg/dL
Blood lead levels 12 mon later 1.2 µg/dL 2.2 µg/dL 6.0 µg/dL
A.N. Tchernitchin et al. Rev. Environ Contam Toxicol 185:93-139 © Springer 2005 120
anterior frontal increased perfusion hyperfrontality. One year after leaving Antofagasta, the
hypoperfusion areas worsend as well as the hyperperfusion in the anterior frontal brain,
which increased further in the father. The alterations progressed only slightly in the child and
showed a moderate regression in the mother. In the father, neurocognitive testing revealed
damage as an incomplete Wisconsin test at the 14th percentile. Electromyograms and nerve
impulse conduction velocity measurements in the father revealed a distal polyneuropathy,
predominantly sensitive, and a psychological examination revealed depression,
psychoorganic damage mainly in short-term auditory and visual memory, and possible
alteration of personality. In the child, the psychological analysis showed a diagnosis of
aggressive behavior at 3 yr of age. These findings reveal that although lead blood levels
decreased to low levels after 1 yr of living away from the exposure source, the neurological
sequelae persisted and even worsened in two of the three family members.
B. The Arica Case: Toxic Wastes from Sweden and
Mineral Concentrates from Bolivia
Arica is the most northern Chilean city and port, situated a few kilometers south of the
Chilean border with Peru. There were two main sources of lead pollution: transport and
storage of lead mineral concentrates from Bolivia and the “import” of toxic wastes from
Europe.
The first source of lead exposure in Arica was from powdered lead mineral
concentrates, mainly lead sulfide containing about 26.5% lead Until recently, this mineral
was transported through the city and openly stored near densely populated parts of the
city, in open places near the railroad until 1993, and from then on at the port itself. The
mineral comes by railroad from Bolivia. According to an old international treaty signed
between both countries in 1904, Chile is obliged to allow free transit of Bolivian
merchandise through Chilean territory to its ports until it can be exported by ship to other
countries. According to available information, 340,000 t of concentrates are shipped
every year through Chilean ports in Arica and Antofagasta. The storage areas were not
protected against wind; therefore, an important amount of lead-containing particles was
blown throughout the vicinity, where there are many homes, whose inhabitants are
exposed to high levels of lead in air and soil.
The second source of exposure was to “toxic raw material for industrial purposes”
imported by Promel from the Swedish company Boliden Metal. This material turned out
to be hazardous toxic wastes sent to Chile by Boliden Metal and deposited without any
protection in the suburbs of Arica between 1983 and 1985 where, a few years later, new
low-income dwellings were constructed and residents were exposed for more than 10 yr.
Although the local health authorities (1983-1985) knew the exact composition of the
toxic wastes, they allowed the entry of these wastes to Chile and informed that “the
material is not toxic, anybody can manage it, it can not be ingested”.
To the lead pollution just described there is an added adverse situation: Arica has an
extremely arid climatic condition, Annual rainfall is about 0.5 mm/yr (30-yr avg) which
A.N. Tchernitchin et al. Rev. Environ Contam Toxicol 185:93-139 © Springer 2005 121
prevents lead movement from the surface to lower soil layers or its removal by rain as
occurs under different climatic conditions.
The Colegio Médico Regional Arica (Arica Regional Medical Association) concluded
that there was massive exposure to lead around 1997, based on signs and symptoms
suggesting lead and arsenic toxicity in patients living in the vicinity of these toxic wastes.
This was the origin of the Arica Study (1998 and 1999) performed by the Colegio
Médico de Chile (National Chilean Medical Association) and associated researchers
(A.N.T., N.L., and N.A.T.) reported below. This study also discovered a very important
lead exposure source, the old lead mineral concentrate storage area that was not suspected
previously, and it was included in the study.
Lead Measurements in Blood, 1998 and 1999 We investigated blood levels in exposed
and control children from Arica in two stages. The first was in 1998 in Poblacion Los
Industriales and Cerro Chuño and in Villa Santa Maria. The second, which included a larger
number of subjects, was in 1999 and included the same two areas from Arica and a third
additional area, Pampa Nueva, which was used as a control area supposedly with low
environmental lead levels. In both studies, blood samples were taken from these residents who
accepted the procedure. Levels were measured by the electrochemical method (Leadcare).
Additionally, in the second study a computational test to detect a delay in hand-motor response
to three sensorial stimuli was applied, and samples of head hair were taken to measure lead
content. Most children in the 1998 study were also included in the 1999 studies.
Table 17 describes the general population investigated in two areas of Arica 1998
whose lead levels and other parameters were again investigated in 1999. One of the areas,
Poblacion Los Industriales and Cerro Chuño had new low-income dwellings constructed
near the disposal area where toxic wastes were stored by Boliden Metal and were still
there during the study. Those investigated lived within 200 m of the waste location. The
general population from the other area, Villa Santa Maria, was initially intended to be the
control subjects, but displayed very high blood levels. It was found later that the Villa
was composed of new houses built for a middle- or higher-income population near an old
storage site for lead mineral concentrates from Bolivia. Possibly some of the houses were
Table 17. Age distribution in the Arica 1998 lead
study group, comprising residents living at two
locations, whose blood lead levels were measured
again in the 1999 study
Age
(years)
Santa
Maria
Los Industriales and
Cerro Chuño
5 2 6
6 1 9
7 4 12
8 2 5
Total 9 32
A.N. Tchernitchin et al. Rev. Environ Contam Toxicol 185:93-139 © Springer 2005 122
Table 18. Changes in blood lead levels in the same children from 1998 to January 1999 Arica
study groups in Santa Maria (S M) and Los Industriales and Cerro Chuño (L I & C C)
Location Date n
Mean Pb,
µg/dL
Percent
≥10 µg/dL
Percent
≥20 µg/dL
Percent
≥30 µg /dL
S M 1998 9 21.8 100 67 11
S M Jan 99 9 20.1 89 44 11
L I & C C 1998 32 8.3 38 0 0
L I & C C Jan 99 32 8.4 31 1 1
constructed on the old storage site that never was cleaned up. Table 18 shows blood lead
levels in 5 to less than 9 yr old living in both areas and compares the change of blood
levels between the first and second measurements.
The 1999 study comprised a larger number of exposed children than in the 1998 study,
mainly from Poblacion Los Industriales and Cerro Chuño, and additionally a new area of
Arica, Pampa Nueva, located far from lead sources, was incorporated into the study as a
control area. Subjects from Poblacion Los Industriales and Cerro Chuño and those from
Pampa Nueva belong to a low-income socioeconomic class, whereas residents from Villa
Santa Maria are in the higher-income group with higher educational status. Figure 18
shows blood lead levels in children from these areas, distributed according to age. Blood
levels in children from Villa Santa Maria were very high and displayed the highest values
in yunger ages, but tended to decrease rapidly with age, which does not occur in children
from Los Industriales and Cerro Chuño. Levels in children from Pampa Nueva were the
lowest, except in one cluster of three subjects of 9 to <10 yr of age, who lived on the same
street <100 m of each other. In the homes of two, there were some labor activities with lead.
0
5
10
15
20
25
30
5 6 7 8 9 10 - 11
Age (years)
Meanleadconcenrationinblood(µg/dL)
Santa Maria
L Ind & C Chuño
Pampa Nueva
Fig. 18. Blood lead levels according to age in the Arica 1999 lead study universe, comprising children living at three
different locations, whose head hair levels were measured
A.N. Tchernitchin et al. Rev. Environ Contam Toxicol 185:93-139 © Springer 2005 123
Table 19. Blood lead levels in the group 5- to 8-yr-old children living in
three areas of Arica, 1999.
Santa
Maria
Los Industriales
&
Cerro Chuño
Pampa
Nueva
N 12 116 13
Mean Pb µg/dL 18.1 8.5 5.8
SD 8.5 5.7 2.5
SD: standard deviation
Considering this cluster of subjects with high blood levels, Tables 19 and 20 show
blood levels in children 5 to <9 yr old distributed according to their residence area and
the children’s distribution according to their blood levels. Tables 21 and 22 show the
same results in all children in the study 5 to 11 yr old. In Tables 19 and 20, a clear
difference is observed between levels from Villa Santa Maria, the highest levels, and Los
Industriales and Cerro Chuño, and the controls residing in Pampa Nueva.
Measurements of Head Hair Lead Concentration At the same time blood was taken
from children in the three areas of Arica (1999), a sample of head hair was taken for lead
measurement. Table 23 shows lead content in children 5 to <9 yr old, and Table 24 shows
values in 5 to 11 yr old. The same differences described for lead in blood were observed
in hair.
Evaluation of Effects Associated with Lead Taking into consideration the effect of lead
on central and peripheral nervous system, specially on easily measurable parameters,
such as the decrease in the nerve impulse transport by myelin nerves, which was
supposed to cause a delay in stimuli motor response, we designed a computer program
(Silva et al. 1999) that allows the quantification of the delay between sensitive stimuli
and a motor response to that stimuli. Three different kinds of stimuli were applied: (a) a
simple visual stimulus such as a simple object suddenly visible on a computer screen, (b)
a more-complex visual stimulus that requires brain processing to discriminate among
Table 20. Distribution of children 5 to 8 yr old, according to blood lead levels in the
groups from three areas of Arica, 1999.
Level (µg/dL) Santa
Maria
Los Industriales &
Cerro Chuño
Pampa
Nueva
0-9.9 2 81 12
10-19.9 6 31 1
20-29.9 3 1 0
30-39.9 1 3 0
A.N. Tchernitchin et al. Rev. Environ Contam Toxicol 185:93-139 © Springer 2005 124
Table 21. Blood lead levels in the group of 5- to 11-yr-old children living in three
areas of Arica, 1999.
Santa
Maria
Los Industriales &
Cerro Chuño
Pampa
Nueva
N 21 170 21
Mean Pb µg/dL 16.1 8.7 7.2
SD 8.1 6.3 5.2
several visual images appearing on the computer screen, and (c) an auditory stimulus
(acute sound) produced by the computer. Each kind of stimulus was applied several times
each, to allow learning.
Table 25 shows the delay in response to auditory stimulus in children of the same age
with blood levels ≥10 µg/dL compared to children with <10 µg/dL. Results show that
there is a delay in response to sensory stimulus starting at <10 µg/dL, at much lower
levels than those causing a decrease in the velocity of nerve conductance through motor
myelinated nerve. It is possible to speculate that in addition to a delay in motor nerve
impulse transmission, lead additionally causes some delay in another site, at the central
nervous system or at the synapse level. These possibilities deserve future studies to better
understand the mechanisms of lead interaction with nerve cells at blood lead levels >10
µg/dL.
Actions Taken The Colegio Médico de Chile informed the local and national health
authorities about these results and further informed the local population through the press
and through a health campaign. These activities of the Colegio Médico motivated
implementation of several measures by the government to prevent or mitigate damage,
summarized as follows:
a. Removal of toxic wastes from the Los Industriales and Cerro Chuño area of
Arica 2 km away to Quebrada Encantada in 1998-1999, an uninhabited creek, and
covered these wastes with 50 cm soil protected by surrounding the site with a
2.20-m-high wall.
Table 22. Distribution of 5- to 11-yr-old children according to their blood lead levels,
in the groups from three areas of Arica, 1999.
Level (µg/dL) Santa Maria Los Industriales &
Cerro Chuño
Pampa Nueva
0-9.9 5 121 17
10-19.9 10 41 3
20-29.9 5 3 1
30-39.9 1 5 0
A.N. Tchernitchin et al. Rev. Environ Contam Toxicol 185:93-139 © Springer 2005 125
Table 23. Lead concentration in hair from 5- to 8-yr-old children samples living in
three areas of Arica, 1999.
Santa María Los Industriales &
Cerro Chuño
Pampa Nueva
N 11 96 8
Mean Pb µg/g hair 52.5 18.3 16.1
SD 35.6 10.4 8.1
b. After waste was removed from the original site, it was covered with about 60 cm soil,
partially paved, and surrounded with walls while waiting to completely pave that area
c. Soil samples from streets and squares for lead measurements.
d. Cleaning of houses and roofs in Los Industriales and Cerro Chuño.
e. Decontamination of the railroad lead mineral storage area Chinchorro near Villa Santa
María.
f. Soil samples from the railroad storage site, surrounding area, and streets in the Villa
Santa María.
g. Cleaning of houses and roofs in Villa Santa Maria.
h. Cleaning of the Arica Port lead mineral storage area, and construction of new storage
areas to decrease lead contamination of surrounding area.
i. Measurement of blood lead levels in exposed population.
j. A protocol of actions and/or treatment of children according to blood lead levels, which
consisted of family education, Fe supplementation in diet, calcium supplementation in
diet, hemogram evaluations, new lead level controls in blood, investigation of home
conditions that favored lead exposure, and therapeutic procedures, according to blood
levels.
Measurements of blood lead levels by the local Health Service of Arica. The local
Health Service reported the evaluation of 155 individuals among children and adults
living in Villa Santa María within the last semester of 1998 and 1999 (Servicio de Salud
de Arica 2000). Blood was collected by digital puncture for lead measurement by the
electrochemical method (Leadcare) or by venupuncture for measurement by atomic
Table 24. Lead concentration in hair from 5- to 11-yr-old children living in
three areas of Arica, 1999.
Santa
María
Los Industriales &
Cerro Chuño
Pampa
Nueva
n 25 169 23
Mean Pb µg/g hair 55.7 18.7 20
SD 32.6 11.2 24.9
A.N. Tchernitchin et al. Rev. Environ Contam Toxicol 185:93-139 © Springer 2005 126
Table 25. Delay in response to auditory stimulus in children with lead blood levels ≥10 µg/dL
absorption spectroscopy at the Institute of Public Health (ISP) of the Ministry of Health.
Results of blood levels ≥10µg/dL are shown in Table 26.
The Local Health Service of Arica reported (Servicio Municipal de Salud Arica
2001; Servicio de Salud de Arica 2001) that it took 4990 blood samples from subjects
from Los Industriales and Cerro Chuño, composed of 3240 children (65%) and 1750
adults (35%), for lead measurement. Results showed 4411 samples were <10 µg/dL and
579 ≥10 µg/dL. Of the “positive” 579 subjects, blood was collected from 538 (92%) and
measured at the Public Health Institute (ISP) of the Ministry of Health of Chile. Results
showed 131 subjects had ≥10 µg/dL and 407 <10 µg/dL; of 120 children (<15 yr old) and
11 adults. Data from the 120 children showing age distribution and blood levels are given
in Table 27.
Table 26. Subjects from sample population of Villa Santa María displaying high blood
lead levels according evaluation by the Health Service of Arica in 1998-1999.
Level (µg/dL)
Electro chemical
method
(Leadcare)
Atomic
absorption
spectroscopy, 1998
Atomic
absorption
Spectroscopy,
1999
Total subjects
10-19.9 32 51 15
20-29.9 3 16 4
30-39.9 0 2 1
Children under
9 yr of age
10-19.9 11 28 9
20-29.9 1 9 3
30-39.9 0 1 1
Source: Servicio de Salud de Arica (2000).
Response (sec) in
8-yr-old
children
Response (sec) in
9-yr-old
children
Blood lead
level (µg/dL)
< 10 ≥ 10 Statistical
differencea
< 10 ≥ 10 Statistical
differencea
n 22 12 35 12
Mean 0.469 0.522 2p < 0.001 0.422 0.476 1p < 0.05
SD 0.075 0.088 0.029 0.070
SEM 0.016 0.025 0.005 0.020
A.N. Tchernitchin et al. Rev. Environ Contam Toxicol 185:93-139 © Springer 2005 127
Table 27. Age and blood lead level distribution of children from Población Los Industriales
and Cerro Chuño displaying blood lead blood ≥10 µg/dL, from a study of the Local Health
Service during 2000.
Age 10 to 14 µg/dL 15 to 19 µg/dL 20 to 34 µg/dL TOTAL
< 2 yr 16 7 1 22
2-5 yr 48 12 3 63
6-9 yr 19 2 2 23
10-14 yr 7 3 2 12
Total 90 22 8 120
Source: Servicio Municipal de Salud Arica (2001); Servicio de Salud de Arica (2001).
VII. Other Sources
The most relevant sources of lead, affecting mainly the urban population, were leaded
gasoline and high lead content in household paints. New regulations on these sources
contributed to an overall decrease in exposure to lead in Chile. Lead originating from
gasoline is still present at high levels in soil of large cities and from the vicinity of high-
traffic highways. Dwellings painted before 1998 also constitute an important source of
lead contamination.
Other sources of lead in Chile are children’s toys and school implements, occupational
exposure to lead, and lead contamination of food., Several industrial activities occur,
mainly in cities. Many of them recover lead from car batteries and (some are licensed
others are clandestine), and there are industries melting metals painted with leaded paints.
There are many families working at these activities in their homes, such as recovering
lead from batteries and making different objects with lead, and some working in stained
glass, and welders, etc.
Children’s Toys and School Implements Lead exposure may occur from children’s toys,
pencils, and other school tools and implements, which children frequently take into their
mouth. These items may be imported from countries without lead regulations.
Occupational Exposure Occupational exposure frequently occurs in painters, welders,
glass handicraft workers, and miners and smelting workers. Atmospheric lead may be
originated from industries melting metals painted with leaded paints, affecting their
workers and the population living in the vicinity.
Food Contamination Food may be a source of various degrees of exposure to lead. The
use of ceramics covered with low-quality leaded paint is not frequent in Chile; however,
these ceramics can be imported from countries without regulations. Vegetables growing
in or near highly populated areas and specially the metropolitan area of Santiago or near
heavy traffic highways concentrate lead from soil, adding to the lead burden in humans.
Lead may come from water flowing through lead pipes in old dwellings or copper pipes
A.N. Tchernitchin et al. Rev. Environ Contam Toxicol 185:93-139 © Springer 2005 128
Table 28. Lead content in food products purchased in Santiago
metropolitan area, 1995
Lettuce 0.3-56 µg/g dry wt (average,
12 µg/g)
Carrots 4 µg/g dry wt
Beans 4 µg/g dry wt
Potatoes 1.6 µg/g dry wt
Wheat products < 1 µg/g dry wt
Canned evaporated milk 202 mg/L
Fruits juice, packed > 100 mg/L
Source: Díaz and García (2003)
welded with lead. Food cans are not welded with lead welding anymore, but before 2000
most canned food was packed in lead-welded cans. Due to population ignorance, once
opened, food sometimes was kept in these cans, leading to increasing concentrations of
lead in food. The frequent marketing of bruised or accidentally deformed cans, in which
the welded layer was affected, constituted an important source of lead in food. In
packaged food, lead can also originate from the packing material, especially for various
beverages such as milk or fruit juice.
Few studies were performed in Chile on lead content in food. Table 28 shows data on lead
in several food products, investigated at the University of Chile in 1995, and Table 29 shows
lead levels in fish products measured at the University of Santiago (Díaz and García 2003).
A study directed by one of us (A.N.T.) confirmed high lead levels in lettuce cultivated
near a high-traffic highway (50 m) in the coastal zone of Central Chile (Briones and Vera
2002). Samples of lettuce were taken in that site 1 yr after the ban of leaded gasoline. These
displayed a high concentration of lead (50-55 µg/g), suggesting that the pollutant from
leaded gasoline accumulated in the soil and was absorbed by the plants through their roots.
Recently, a study measured lead content in breakfasts and lunches given at a primary
school in the VII Region (300 km south Santiago) within a governmental program of
food assistance to economically deprived children (Bastías et al. 2004). Each breakfast
Table 29. Lead content in fish species or food products
purchased in Santiago metropolitan area.
Merluccius gayi 0.72-0.94 µg/g wet wt
Truchurus murpyi 1.16-1.41 µg/g wet wt
Fish flour 0.46 µg/g dry wt
Fish oil 0.13 µg/g dry wt
Canned fish 0.57 µg/g dry wt
Source: Díaz and García (2003)
A.N. Tchernitchin et al. Rev. Environ Contam Toxicol 185:93-139 © Springer 2005 129
ration contained 1.3 µg/g lead and each lunch portion contained 0.6 µg/g lead, which totaled
714.1 µg lead/d. This contamination clearly exceeded the recommendation of the Mixed
Expert Committee from the FAO/WHO experts on food additives (Comité Mixto FAO/OMS
de Expertos en Aditivos Alimentarios 1999) of a maximum of 25 µg lead/kg body wt/wk.
In Chile, regulations on lead in food (D 977/96 Ministry of Health Chile 1996; D
475/99 Ministry of Health, Chile 1999; D 238/2000 Ministry of Health, Chile 2000) are
not precise and are also insufficient, revealing a disparity in legislative criteria (Bastías et
al. 2004). There is no regulation forbidding the use of lead in food can welding; although
it is assumed it is no longer done, there is no regulation to that effect. According to food
sanitary regulations (D 977/96 Ministry of Health, Chile 1996; D 475/99 Ministry of
Health, Chile 1999; D 238/2000 Ministry of Health, Chile 2000), metals in contact with
food should contain less than 1% of the sum of the following elements (among others);
lead, copper, chromium, antimony, tin, and/or iron. Metal cans with canned food contain
higher amounts of at least one of these elements (Fe), and there are no controls to check
whether dangerous elements are in higher amounts than those allowed by regulations.
VIII.Lead in Soil
Few studies were done to analyze lead content in soils of different Chilean regions. Most
of these were done locally to ascertain soil levels within the areas influenced by different
sources of pollution, mainly before actions intended to clean up these sites, or in places
such as Arica or Antofagasta, where the effects of lead contamination on humans is
evident.
0
50
100
150
200
250
Huasco
Elqui
Limari
Aconcagua
Puchumo
Mapocho
Maipo
Cachapoal
Tinguiririca
Mataquito
Maule
VIIIRegion
IXRegion
XRegion
XIRegion
Place (vicinity of river)
Leadinsoil(mg/kg)
Minimum
Mean
Maximum
Fig. 19. Lead content in soils under the influence of various Chilean rivers. (From CONAMA Chile 1994;
González 1994.)
A.N. Tchernitchin et al. Rev. Environ Contam Toxicol 185:93-139 © Springer 2005 130
Table 30. Lead concentration in soils located neara
or farb
from industrial pollution sources
(copper smelters) in the V Region (north and north-west of Santiago).
Agroecological unit Sector Cu
(mg/kg)
Pb
(mg/kg)
Zn
(mg/kg)
Aconcagua Catemu1
319 29 59
Aconcagua Nogales2, 3
135 8 28
Aconcagua The rest2
63 8 89
Puchuncavi Less than 3 km
from smelter1
281 115 144
Puchuncavi More than 3 km
from smelter2
38 40 110
c
Nogales is located far from polluting source but was contaminated by a collapse of a reservoir containing
mineral wastes.
Source: González (1994)
A study investigated lead concentration in soil in the vicinity of several rivers. In some,
lead was considered to originate from natural sources, while in others, it is anthropogenic.
Figure 19 shows lead content in these soils (CONAMA Chile 1994; González 1994). The
profile shows that variation of values for each ecosystem is low. Within the agroecological
unit of the Aconcagua Valley (100 km north of Santiago), it was found that variation of lead
levels in soil, especially the mean levels and the absolute maximal values of lead, coincided
with those of copper (results not shown), suggesting anthropogenic contamination with both
metals. In the sectors of Puchuncaví (Puchumo) and Nos (Maipo valley), high lead
concentrations were from anthropogenic sources, associated with industrial processes.
Puchuncaví is in the area of copper smelter emission of large amounts of sulfur dioxide and
arsenic, together with other heavy metals. A decrease in concentration of lead at lower valley
locations may result from dilution of the valley river water by cleaner river affluent.
Table 30 shows mean values of various heavy metals in soils (0-20 cm) at sites located
near and far from contamination sources. Copper smelters are located in Catemu and
Puchuncavi. Nogales suffered from a collapse of a reservoir dam containing mineral
wastes. In some places, lead content in soil increases, presumably due to combination
with other molecules present in soil and its precipitation as nonsoluble compounds.
These studies concluded that in many places the total lead content results from natural
origin but in others it may be anthropogenic. There was no relation, however, between
increased lead content in soil and the existence of lead mineral zones such as the Maipo
Valley and the XI Region, suggesting that these minerals do not naturally dissolve in water.
IX.Recommendations
Exposure to lead is known to affect various organs and systems in humans and in
experimental animals. In adults, exposure to moderate lead levels can cause damage that
A.N. Tchernitchin et al. Rev. Environ Contam Toxicol 185:93-139 © Springer 2005 131
can be reversed, at least in part, after decreasing lead levels in the blood and an additional
recovery time. Exposure of children, and especially during the neonatal period of life and
during fetal stages of intrauterine development, even at much lower lead concentrations,
causes irreversible changes that persist through life. This is the basis for recommending
extreme caution to avoid lead exposure of children, of babies during the early stages of
their development, and of fetuses during the last months of intrauterine life.
This is also the reason why norms and regulations for labor lead exposure levels or for
maximal allowed lead concentrations in blood should be much lower for females than for
males. Taking into consideration that the organism does not distinguish between lead and
calcium, in a lead-exposed population lead will accumulate in bones together with calcium.
In contrast to males, females become pregnant and obtain calcium for fetal needs from their
own bone reserves, so that if lead content in her bones is elevated, the mother will withdraw
calcium together with lead, which will affect the fetal tissues. Further, during breastfeeding,
mothers draw additional calcium needed for the child’s growth, and if lead is accumulated in
maternal bones, it will result in newborn exposure to this toxic element.
Based on the these considerations, we recommend: (a) further changes in lead
regulations, (b) formal educational programs, (c) informal educational campaigns through
mass communication media, (d) high-level educational campaigns for the political sector,
public administration, and the enterprise management sector, (e) administrative actions to
decontaminate polluted areas, and (f) medical actions aimed mainly at detection and
therapeutics, with special consideration of nutritional intervention and special care for
pregnancy, early postnatal life, and childhood. In addition, we recommend international
agreements regulating commerce of products dangerous to health, including lead.
New Chilean regulations on lead content in air and paints are described above. Both
are significant advances and are similar to those recommended by the World Health
Organization (WHO) (lead in air) or in force in Europe (lead in air) or the U.S. (lead in
paints). The limits of biological tolerance to lead were established in Chile in 1992 by
Decree 745/92, art. 101, as 50 µg/dL lead in blood (D 745/92, Ministry of Health, Chile
1992). In 1999, stricter limits of biological tolerance were established by Decree 594, art.
113 (D 594/99, Ministry of Health, Chile 1999), decreasing tolerance for males to 40
µg/dL and for females to 30 µg/dL. These changes generated polemics at the political
level and pressure from economically affected sectors to lessen regulations, and a new
regulation established by Decree 201/2001, art. 17 (D 201/2001, Ministry of Health
Chile, 2001) again changed the limits of biological tolerance, increasing it for females to
40 µg/dL and keeping the 40 µg/dL value for males. The Colegio Médico de Chile
submitted a critical analysis with all scientific arguments to reverse that decree
(Tchernitchin and Castro 2001), but no satisfactory results were obtained. We strongly
recommend improving regulations on biological tolerance aimed fundamentally at the
protection of children and women. We further recommend improving norms on lead
content in drinking water and drawing regulations on lead content in food and in several
products accessible to children. All these measures will be useless if these regulations are
not accompanied with improved control measures and strict penalties for transgressions,
both of which are deficient in Chile.
A.N. Tchernitchin et al. Rev. Environ Contam Toxicol 185:93-139 © Springer 2005 132
Formal education programs on health and environmental effects of lead and other
pollutants are important to change human behavior for prevention and mitigation.
Recently programmed changes in education by the government mainly aimed at
environmental protection but were not sufficiently strong on environmental toxicology
and health effects. Informal educational campaigns have been done since 1996 by the
Colegio Médico de Chile and were sufficiently effective in changing peoples attitude
toward several pollutants, including lead. Recently, several nongovernmental
organizations with participation of scientists or physicians also contributed to this
purpose.
During recent years, the Chilean Colegio Médico implemented a course on
environmental changes and health effects for television, radio and press reporters who
specialized on health and the environment. This course contributed to improving the
quality and credibility of the articles they present in the media, helping to increase
acceptance of the described environmental problems by citizens and also by politicians.
The Colegio Médico de Chile sent technical information to several political parties and
presented several lectures to transmit this knowledge to this sector. The Chilean
Parliament, both the Lower Chamber (Chamber of Deputies) and the Higher Chamber
(Chamber of Senators), usually requires information about lead or other pollutants from
the Colegio Médico, and several presentations in extenso were also prepared for them.
Our participations in the Commission of the Chamber of Deputies to investigate the
effects of lead in Arica and propose a decontamination plan was a result of this campaign.
This is a good example showing that scientists need to work together with politicians,
legislators, and the educational sector to obtain results in lead decontamination as well as
in other areas of environmental toxicology.
Many administrative actions were undertaken by local or central Chilean authorities
under the pressure of population awareness of the damage caused by lead, following the
campaign designed by the Chilean Colegio Médico. Cleaning up of contaminated areas in
Arica and Antofagasta, relocation of toxic wastes to a desert area near Arica, plans to
transfer the port from which the lead mineral concentrates are shipped from Antofagasta
to Mejillones and to declare the zone of Antofagasta as a National Catastrophe Zone to
obtain funds to make these changes, all were these actions taken under the social and
political pressure of the population who for the first time felt damaged by lead exposure.
From this it can be concluded that changes favoring health of the population are done
most efficiently and rapidly if there is pressure from the population, and that arguments
are difficult to refute when based on scientific knowledge. Therefore, the best way to
solve environmental or health problems is to communicate them to the entire population,
providing valid and solid scientific arguments, and await population pressure on the
responsible authorities.
Medical actions need to focus mainly on the detection of lead exposure and to
therapeutic procedures to treat or to prevent sequelae. It is necessary to take special
consideration for those groups that are more vulnerable to lead effects or develop
irreversible changes which persist through life: newborns or babies during their early
postnatal life, children, and pregnant mothers, to avoid damage of their fetuses. Therefore
A.N. Tchernitchin et al. Rev. Environ Contam Toxicol 185:93-139 © Springer 2005 133
it is necessary to develop methods for screening and detecting affected subjects with
inexpensive methods, to avoid further exposure, to decrease blood lead levels, or to treat
the effects. Prevention methods may involve changes in diet, especially calcium and iron
supplementation and decrease in lipid ingestion.
It is necessary to take into consideration the most conspicuous effects of lead
exposure: decrease in intelligence coefficient and in attention and memory capacity,
hyperactive behavior, aggressive behavior, and delinquent behavior in adolescence.
Therefore, all schoolchildren with these characteristics in the contaminated areas (Arica,
Antofagasta) should be investigated for blood lead content. It is highly recommended that
mothers planning to get pregnant have their blood lead levels screened, so that they may
be treated with pharmaceutical therapy (including chelation therapy) before the initiation
of pregnancy. All pregnant women should measure their blood lead levels to decide a
therapy with less risk for the child such as calcium or vitamin supplementation, besides
the need to identify the lead source to avoid further exposure. After delivery, blood
should be analyzed for lead level measurement in both mothers and newborns to decide on
the convenience of breastfeeding or artificial feeding. All children from families with history
of lead exposure should be screened periodically to prevent irreversible damage by lead.
The hyperactive or aggressive behavior induced by early exposure to lead may be
irreversible. This behavior risks the development of antisocial or delinquent behavior
later in adolescence. We propose that this aggressive behavior can be sublimated, under
psychological treatment, to other aggression-like activities, such as sports, dance,
hobbies, or many other activities. Therefore, we recommend hiring psychologists at
schools so that they can help children to sublimate this aggressive behavior and to
channel it to socially positive behavior and avoid children transforming into a delinquent
population.
Finally, we recommend the implementation of international agreements regulating
commerce of products containing components dangerous for health. Governments of
different countries should agree to prohibit export of such products, those containing lead
for instance, when their constituents are prohibited or regulated in the countries of their
origin, because of ethical reasons even when there is no such regulation in the importing
country.
Summary
Lead is a very toxic environmental pollutant that affects people living or working in
contaminated areas or ingesting this element. Since the beginning of lead use, it has left
evidence of lead poisoning with dramatic effects on the destiny of ancient civilizations. It
was recently proposed that this toxicity can also contribute to the decline of current
societies through lead-induced impairment of intelligence, increased tendency to abuse of
drugs, psychological and behavioral changes, and increase in delinquent behavior.
The effects of chronic exposure to lead in adolescents or adults may be reversed, at
least in part, after a decrease in the blood lead levels. In contrast, in children, especially at
earlier ages, the effects are irreversible, may persist through life, and some of them may
A.N. Tchernitchin et al. Rev. Environ Contam Toxicol 185:93-139 © Springer 2005 134
be induced by the mechanism of imprinting. Exposure to lead during the perinatal period
of life may occur in mothers previously exposed to the metal, presenting increased
concentration of lead in bones; fetuses and newborns are most vulnerable to the toxic
effects of lead because the damage persists throughout life.
The various sources of lead exposure In Chile as well as the evolution of regulations
and mitigation measures are reviewed. An important source of contamination with lead
was the existence of paints with high lead content, used to paint house walls, children’s
furniture, and toys, among other objects. The highest content of lead in paints was not in
those bearing Chilean trademark names, but from a foreign trademark with formulas
licensed to produce in Chile, although the same products in the country of origin (U.S.)
did not present measurable lead levels. From 1997 on, new legislation regulated lead
content in paints. Many houses, furniture, children’s toys, and other objects painted
before 1997 are still an important source of exposure to lead, mainly for children.
Formerly, the widest source of lead contamination in Chile was the use of leaded
gasoline, mainly in greatly populated cities. There has been a progressive decrease in lead
content in leaded gasoline, which was banned in April 2001. Lead pollution still persists in
highly populated cities as city soil, home soil, and as soil contamination near highways.
Clusters of different magnitude originated from point sources, of which the most
relevant in magnitude was which occurred in Ñuble with the use of wheat flour
contaminated with lead, caused by the use of a mill whose stone was repaired by lead
welding. Several other clusters of smaller magnitude are frequently caused by the
widespread practice of battery repair and recovery by small enterprises or as a familial
productive activity, affecting all the family group and occasionally persons living in the
vicinity.
Two special cases of very important environmental contamination occurred, affecting
the population of two major cities. The most dramatic case was the storage of powdered
lead mineral concentrates at the ports or the railroad terminals within the cities of Arica
and Antofagasta, where it usually remained until shipped to other countries. Lead from
this source is the most relevant source of exposure in the cities of Arica and Antofagasta.
Another source of lead, which affected the population of Arica, originated from toxic
wastes imported by Promel from the Swedish company Boliden Metal, stored without
protection in Arica suburbs, where a few years later new dwellings were constructed and
residents were exposed for more than 10 years.
Occupational exposure frequently occurs in painters, welders, and mining or smelting
workers. Various degrees of food lead contamination may increase exposure to the metal.
Vegetables grown in or near highly populated areas, lead pipes in old dwellings or copper
pipes welded with lead, and formerly lead from canned food, especially those that had
been accidentally deformed or were opened and the food stored in those cans.
Little information exists on lead content in soil. There are sites where lead
concentrations are increased from anthropogenic sources. In regions known to have
abundant lead minerals, soil is not contaminated in the vicinity of rivers, suggesting that
raw lead minerals do not dissolve in water and do not affect the soil.
A.N. Tchernitchin et al. Rev. Environ Contam Toxicol 185:93-139 © Springer 2005 135
Acknowledgements
Financed in part by funds from the Colegio Médico de Chile, the Arica study was
financed in part by Fund of the Americas grant. Lead measurements in blood and in
household paints by the Institute of Public Health ISP from the Chilean Ministry of
Health are acknowledged. Technical help from Gladys Cisternas, Bernardita Araya, Dora
Méndez and Leonardo Figueroa is appreciated.
References
Al-Hakkak ZS, Hamamy HA, Murad AMB, Hussain AF (1986) Chromosome aberrations in
workers at a storage battery plant in Iraq. Mutat Res 171:53-60.
Alonso P, Castro H, Davis ME, Goza J, Hargous J, Rivera L, Tassara E (1997) Intoxicación por
plomo: estudio epidemiológico Ñuble, Chile 1996. EPI Visión, Ministerio de Salud, Chile
1997:10-15.
Banks EC, Ferretti LE, Shucard DW (1997) Effects of low level lead exposure on cognitive
function in children: a review of behavioral, neuropsychological and biological evidence.
Neurotoxicology 18:237-282.
Baker EL, Landrigan PJ, Barbour AG, Cox DH, Folland DS, Ligo RN, Throckmorton J (1979)
Occupational lead poisoning in the United States: clinical and biochemical findings related to
blood lead levels. Br J Ind Med 36:314-322.
Bastías JM, Muñoz O, Moreno I, Rubilar C (2004) Evaluación del contenido de arsénico y
plomo en raciones de desayuno y almuerzos entregados a escolares de la VII región, Chile.
CD Abstracts XIII Latin American and Caribean Seminar on Food Science and Technology,
Montevideo, Uruguay.
Bornschein RL, Grote J, Mitchell T, Succop PA, Dietrich KN, Krafft KM, Hammond PB (1989)
Effects of prenatal lead exposure on infant size at birth. In: Smith MA, Grant LD & Sors AI
(eds) Lead Exposure and Child Development. An Internacional Assessment. Klower,
Dordrecht, pp 307-319
Briones MJ, Vera PA (2002) Prospección y caracterización de los metales pesados en Chile, un
caso particular: plomo en hortalizas cultivadas en la Provincia de San Antonio, V Región.
Tesis, UTEM, Santiago Chile.
Byers RK, Lord E (1943) Late effects of lead poisoning on mental development. Amer J Dis
Child 66:471-494.
Cardenas A, Roels H, Bernard AM, Barbon R, Buchet JP, Lauwerys RR, Rosello J, Ramis I,
Mutti A, Franchini I, Fels LM, Stolte H, de Broe ME, Nuyts GD, Taylor SA, Price RG (1993)
Markers of early renal changes induced by industrial pollutants. II. Application to workers
exposed to lead. Br J Ind Med 50:28-36.
Cisternas R, Sáez M (1980) Liberación de delta-ala en orina de niños: un indicador de
contaminación por plomo en Santiago. Rev Chil Pediatr 51:13-18.
Cohen N, Modai D, Golik A, Weissgarten J, Peller S, Katz A, Averbukh Z, Shaked U (1989)
Increased concanavalin A-induced suppressor cell activity in humans with occupational lead
exposure. environ Res 48:1-6.
Comité Mixto FAO/OMS de Expertos en Aditivos Alimentarios (1999) Evaluación de ciertos
aditivos alimentarios y contaminantes de alimentos. 53° Informe de JECFA. N°896. Ginebra.
Human Exposure to Lead in Chile: Sources and Case Studies

More Related Content

Similar to Human Exposure to Lead in Chile: Sources and Case Studies

WEBINAR 1. An Overview: Reproductive & Developmental Health
WEBINAR 1. An Overview: Reproductive & Developmental HealthWEBINAR 1. An Overview: Reproductive & Developmental Health
WEBINAR 1. An Overview: Reproductive & Developmental HealthCenter for Environmental Health
 
Biological and Toxicological Responses to Dioxins Exposures
Biological and Toxicological Responses to Dioxins ExposuresBiological and Toxicological Responses to Dioxins Exposures
Biological and Toxicological Responses to Dioxins ExposuresAgriculture Journal IJOEAR
 
Theautismepidemic ap-psyc493-090514213231-phpapp02
Theautismepidemic ap-psyc493-090514213231-phpapp02Theautismepidemic ap-psyc493-090514213231-phpapp02
Theautismepidemic ap-psyc493-090514213231-phpapp02Jon Ahrendsen
 
Jph climate change pollution and related effect in some neurological conditi...
Jph climate change pollution and related effect in some neurological  conditi...Jph climate change pollution and related effect in some neurological  conditi...
Jph climate change pollution and related effect in some neurological conditi...M. Luisetto Pharm.D.Spec. Pharmacology
 
Hallmarks of Aging summary
Hallmarks of Aging summaryHallmarks of Aging summary
Hallmarks of Aging summarySteve Cepa
 
Contribution Of Environmental Factors To The Risk Of Male Infertility
Contribution Of Environmental Factors To The Risk Of Male InfertilityContribution Of Environmental Factors To The Risk Of Male Infertility
Contribution Of Environmental Factors To The Risk Of Male InfertilityBiblioteca Virtual
 
Chemical Exposures and the Elimination of Toxic Metals from the Human Body by...
Chemical Exposures and the Elimination of Toxic Metals from the Human Body by...Chemical Exposures and the Elimination of Toxic Metals from the Human Body by...
Chemical Exposures and the Elimination of Toxic Metals from the Human Body by...Alexander Borsuk
 
Influence of tobacco_use_on_caries_development_ppt
Influence of tobacco_use_on_caries_development_pptInfluence of tobacco_use_on_caries_development_ppt
Influence of tobacco_use_on_caries_development_pptPartha Pratim
 
Informe de riesgos emergentes sobre disruptores endocrinos
Informe de riesgos emergentes sobre disruptores endocrinos Informe de riesgos emergentes sobre disruptores endocrinos
Informe de riesgos emergentes sobre disruptores endocrinos ainia centro tecnológico
 
Pattern of arsenic exposure to children new born to toddler stages
Pattern of arsenic exposure to children  new born to toddler stagesPattern of arsenic exposure to children  new born to toddler stages
Pattern of arsenic exposure to children new born to toddler stagesAlexander Decker
 
What We Know - New Science Linking our Health and the Environment
What We Know - New Science Linking our Health and the Environment What We Know - New Science Linking our Health and the Environment
What We Know - New Science Linking our Health and the Environment v2zq
 
Chemical Trespass - A Toxic Legacy
Chemical Trespass - A Toxic Legacy Chemical Trespass - A Toxic Legacy
Chemical Trespass - A Toxic Legacy v2zq
 
Thyroid hormones in pregnancy in relation to environmental exposure to organo...
Thyroid hormones in pregnancy in relation to environmental exposure to organo...Thyroid hormones in pregnancy in relation to environmental exposure to organo...
Thyroid hormones in pregnancy in relation to environmental exposure to organo...trashyface7455
 
E-CigaretteMidtermRough
E-CigaretteMidtermRoughE-CigaretteMidtermRough
E-CigaretteMidtermRoughAmanda Kain
 
The Autism Epidemic.Ap.Psyc493
The Autism Epidemic.Ap.Psyc493The Autism Epidemic.Ap.Psyc493
The Autism Epidemic.Ap.Psyc493psych493
 

Similar to Human Exposure to Lead in Chile: Sources and Case Studies (20)

WEBINAR 1. An Overview: Reproductive & Developmental Health
WEBINAR 1. An Overview: Reproductive & Developmental HealthWEBINAR 1. An Overview: Reproductive & Developmental Health
WEBINAR 1. An Overview: Reproductive & Developmental Health
 
Biological and Toxicological Responses to Dioxins Exposures
Biological and Toxicological Responses to Dioxins ExposuresBiological and Toxicological Responses to Dioxins Exposures
Biological and Toxicological Responses to Dioxins Exposures
 
Webinar 1 slides 2
Webinar 1 slides 2Webinar 1 slides 2
Webinar 1 slides 2
 
Theautismepidemic ap-psyc493-090514213231-phpapp02
Theautismepidemic ap-psyc493-090514213231-phpapp02Theautismepidemic ap-psyc493-090514213231-phpapp02
Theautismepidemic ap-psyc493-090514213231-phpapp02
 
Jph climate change pollution and related effect in some neurological conditi...
Jph climate change pollution and related effect in some neurological  conditi...Jph climate change pollution and related effect in some neurological  conditi...
Jph climate change pollution and related effect in some neurological conditi...
 
Hallmarks of Aging summary
Hallmarks of Aging summaryHallmarks of Aging summary
Hallmarks of Aging summary
 
Contribution Of Environmental Factors To The Risk Of Male Infertility
Contribution Of Environmental Factors To The Risk Of Male InfertilityContribution Of Environmental Factors To The Risk Of Male Infertility
Contribution Of Environmental Factors To The Risk Of Male Infertility
 
Chemical Exposures and the Elimination of Toxic Metals from the Human Body by...
Chemical Exposures and the Elimination of Toxic Metals from the Human Body by...Chemical Exposures and the Elimination of Toxic Metals from the Human Body by...
Chemical Exposures and the Elimination of Toxic Metals from the Human Body by...
 
Influence of tobacco_use_on_caries_development_ppt
Influence of tobacco_use_on_caries_development_pptInfluence of tobacco_use_on_caries_development_ppt
Influence of tobacco_use_on_caries_development_ppt
 
Informe de riesgos emergentes sobre disruptores endocrinos
Informe de riesgos emergentes sobre disruptores endocrinos Informe de riesgos emergentes sobre disruptores endocrinos
Informe de riesgos emergentes sobre disruptores endocrinos
 
Report 2
Report 2Report 2
Report 2
 
risk.pptx
risk.pptxrisk.pptx
risk.pptx
 
Pattern of arsenic exposure to children new born to toddler stages
Pattern of arsenic exposure to children  new born to toddler stagesPattern of arsenic exposure to children  new born to toddler stages
Pattern of arsenic exposure to children new born to toddler stages
 
What We Know - New Science Linking our Health and the Environment
What We Know - New Science Linking our Health and the Environment What We Know - New Science Linking our Health and the Environment
What We Know - New Science Linking our Health and the Environment
 
Chemical influence
Chemical influenceChemical influence
Chemical influence
 
Chemical Trespass - A Toxic Legacy
Chemical Trespass - A Toxic Legacy Chemical Trespass - A Toxic Legacy
Chemical Trespass - A Toxic Legacy
 
Thyroid hormones in pregnancy in relation to environmental exposure to organo...
Thyroid hormones in pregnancy in relation to environmental exposure to organo...Thyroid hormones in pregnancy in relation to environmental exposure to organo...
Thyroid hormones in pregnancy in relation to environmental exposure to organo...
 
E-CigaretteMidtermRough
E-CigaretteMidtermRoughE-CigaretteMidtermRough
E-CigaretteMidtermRough
 
Baccarelli Receptor Dioxins
Baccarelli Receptor DioxinsBaccarelli Receptor Dioxins
Baccarelli Receptor Dioxins
 
The Autism Epidemic.Ap.Psyc493
The Autism Epidemic.Ap.Psyc493The Autism Epidemic.Ap.Psyc493
The Autism Epidemic.Ap.Psyc493
 

More from enchorreranobunkerc

Imprinting: efectos diferidos de la exposición prenatal, perinatal o infantil...
Imprinting: efectos diferidos de la exposición prenatal, perinatal o infantil...Imprinting: efectos diferidos de la exposición prenatal, perinatal o infantil...
Imprinting: efectos diferidos de la exposición prenatal, perinatal o infantil...enchorreranobunkerc
 
Aprobación de estudio impacto ambiental a planta termoeléctrica en La Chorrer...
Aprobación de estudio impacto ambiental a planta termoeléctrica en La Chorrer...Aprobación de estudio impacto ambiental a planta termoeléctrica en La Chorrer...
Aprobación de estudio impacto ambiental a planta termoeléctrica en La Chorrer...enchorreranobunkerc
 
Contaminación del aire revisitada
Contaminación del aire revisitadaContaminación del aire revisitada
Contaminación del aire revisitadaenchorreranobunkerc
 
PanAm Generating Ltd. Contaminación del Combustible en 2007
PanAm Generating Ltd. Contaminación del Combustible en 2007PanAm Generating Ltd. Contaminación del Combustible en 2007
PanAm Generating Ltd. Contaminación del Combustible en 2007enchorreranobunkerc
 
EL IMPACT" SOBRE LA SALUD DEL USO DEL COMBUSTIBLE BUNKER C " LA CHORRERA . A...
EL IMPACT" SOBRE LA SALUD DEL USO DEL COMBUSTIBLE  BUNKER C " LA CHORRERA . A...EL IMPACT" SOBRE LA SALUD DEL USO DEL COMBUSTIBLE  BUNKER C " LA CHORRERA . A...
EL IMPACT" SOBRE LA SALUD DEL USO DEL COMBUSTIBLE BUNKER C " LA CHORRERA . A...enchorreranobunkerc
 
Estudio de la contaminación al ambiente por las plantas termoeléctricas
Estudio de la contaminación al ambiente por las plantas termoeléctricas Estudio de la contaminación al ambiente por las plantas termoeléctricas
Estudio de la contaminación al ambiente por las plantas termoeléctricas enchorreranobunkerc
 
ANÁLISIS GENERAL DE LAS EXTERNALIDADES AMBIENTALES DERIVADAS DE LA UTILIZACIÓ...
ANÁLISIS GENERAL DE LAS EXTERNALIDADES AMBIENTALES DERIVADAS DE LA UTILIZACIÓ...ANÁLISIS GENERAL DE LAS EXTERNALIDADES AMBIENTALES DERIVADAS DE LA UTILIZACIÓ...
ANÁLISIS GENERAL DE LAS EXTERNALIDADES AMBIENTALES DERIVADAS DE LA UTILIZACIÓ...enchorreranobunkerc
 
CONTAMINACIÓN DEL BÚNKER "C" SOBRE LA SALUD HUMANA.
 CONTAMINACIÓN DEL BÚNKER "C" SOBRE LA SALUD  HUMANA. CONTAMINACIÓN DEL BÚNKER "C" SOBRE LA SALUD  HUMANA.
CONTAMINACIÓN DEL BÚNKER "C" SOBRE LA SALUD HUMANA.enchorreranobunkerc
 

More from enchorreranobunkerc (9)

Imprinting: efectos diferidos de la exposición prenatal, perinatal o infantil...
Imprinting: efectos diferidos de la exposición prenatal, perinatal o infantil...Imprinting: efectos diferidos de la exposición prenatal, perinatal o infantil...
Imprinting: efectos diferidos de la exposición prenatal, perinatal o infantil...
 
Aprobación de estudio impacto ambiental a planta termoeléctrica en La Chorrer...
Aprobación de estudio impacto ambiental a planta termoeléctrica en La Chorrer...Aprobación de estudio impacto ambiental a planta termoeléctrica en La Chorrer...
Aprobación de estudio impacto ambiental a planta termoeléctrica en La Chorrer...
 
Contaminación del aire revisitada
Contaminación del aire revisitadaContaminación del aire revisitada
Contaminación del aire revisitada
 
PanAm Generating Ltd. Contaminación del Combustible en 2007
PanAm Generating Ltd. Contaminación del Combustible en 2007PanAm Generating Ltd. Contaminación del Combustible en 2007
PanAm Generating Ltd. Contaminación del Combustible en 2007
 
EL IMPACT" SOBRE LA SALUD DEL USO DEL COMBUSTIBLE BUNKER C " LA CHORRERA . A...
EL IMPACT" SOBRE LA SALUD DEL USO DEL COMBUSTIBLE  BUNKER C " LA CHORRERA . A...EL IMPACT" SOBRE LA SALUD DEL USO DEL COMBUSTIBLE  BUNKER C " LA CHORRERA . A...
EL IMPACT" SOBRE LA SALUD DEL USO DEL COMBUSTIBLE BUNKER C " LA CHORRERA . A...
 
Estudio de la contaminación al ambiente por las plantas termoeléctricas
Estudio de la contaminación al ambiente por las plantas termoeléctricas Estudio de la contaminación al ambiente por las plantas termoeléctricas
Estudio de la contaminación al ambiente por las plantas termoeléctricas
 
Estudio de la contaminación al ambiente por las plantas termoeléctricas
Estudio de la contaminación al ambiente por las plantas termoeléctricas Estudio de la contaminación al ambiente por las plantas termoeléctricas
Estudio de la contaminación al ambiente por las plantas termoeléctricas
 
ANÁLISIS GENERAL DE LAS EXTERNALIDADES AMBIENTALES DERIVADAS DE LA UTILIZACIÓ...
ANÁLISIS GENERAL DE LAS EXTERNALIDADES AMBIENTALES DERIVADAS DE LA UTILIZACIÓ...ANÁLISIS GENERAL DE LAS EXTERNALIDADES AMBIENTALES DERIVADAS DE LA UTILIZACIÓ...
ANÁLISIS GENERAL DE LAS EXTERNALIDADES AMBIENTALES DERIVADAS DE LA UTILIZACIÓ...
 
CONTAMINACIÓN DEL BÚNKER "C" SOBRE LA SALUD HUMANA.
 CONTAMINACIÓN DEL BÚNKER "C" SOBRE LA SALUD  HUMANA. CONTAMINACIÓN DEL BÚNKER "C" SOBRE LA SALUD  HUMANA.
CONTAMINACIÓN DEL BÚNKER "C" SOBRE LA SALUD HUMANA.
 

Recently uploaded

DATA STRUCTURE AND ALGORITHM for beginners
DATA STRUCTURE AND ALGORITHM for beginnersDATA STRUCTURE AND ALGORITHM for beginners
DATA STRUCTURE AND ALGORITHM for beginnersSabitha Banu
 
Solving Puzzles Benefits Everyone (English).pptx
Solving Puzzles Benefits Everyone (English).pptxSolving Puzzles Benefits Everyone (English).pptx
Solving Puzzles Benefits Everyone (English).pptxOH TEIK BIN
 
ENGLISH 7_Q4_LESSON 2_ Employing a Variety of Strategies for Effective Interp...
ENGLISH 7_Q4_LESSON 2_ Employing a Variety of Strategies for Effective Interp...ENGLISH 7_Q4_LESSON 2_ Employing a Variety of Strategies for Effective Interp...
ENGLISH 7_Q4_LESSON 2_ Employing a Variety of Strategies for Effective Interp...JhezDiaz1
 
Organic Name Reactions for the students and aspirants of Chemistry12th.pptx
Organic Name Reactions  for the students and aspirants of Chemistry12th.pptxOrganic Name Reactions  for the students and aspirants of Chemistry12th.pptx
Organic Name Reactions for the students and aspirants of Chemistry12th.pptxVS Mahajan Coaching Centre
 
Types of Journalistic Writing Grade 8.pptx
Types of Journalistic Writing Grade 8.pptxTypes of Journalistic Writing Grade 8.pptx
Types of Journalistic Writing Grade 8.pptxEyham Joco
 
Capitol Tech U Doctoral Presentation - April 2024.pptx
Capitol Tech U Doctoral Presentation - April 2024.pptxCapitol Tech U Doctoral Presentation - April 2024.pptx
Capitol Tech U Doctoral Presentation - April 2024.pptxCapitolTechU
 
Gas measurement O2,Co2,& ph) 04/2024.pptx
Gas measurement O2,Co2,& ph) 04/2024.pptxGas measurement O2,Co2,& ph) 04/2024.pptx
Gas measurement O2,Co2,& ph) 04/2024.pptxDr.Ibrahim Hassaan
 
ECONOMIC CONTEXT - PAPER 1 Q3: NEWSPAPERS.pptx
ECONOMIC CONTEXT - PAPER 1 Q3: NEWSPAPERS.pptxECONOMIC CONTEXT - PAPER 1 Q3: NEWSPAPERS.pptx
ECONOMIC CONTEXT - PAPER 1 Q3: NEWSPAPERS.pptxiammrhaywood
 
POINT- BIOCHEMISTRY SEM 2 ENZYMES UNIT 5.pptx
POINT- BIOCHEMISTRY SEM 2 ENZYMES UNIT 5.pptxPOINT- BIOCHEMISTRY SEM 2 ENZYMES UNIT 5.pptx
POINT- BIOCHEMISTRY SEM 2 ENZYMES UNIT 5.pptxSayali Powar
 
Enzyme, Pharmaceutical Aids, Miscellaneous Last Part of Chapter no 5th.pdf
Enzyme, Pharmaceutical Aids, Miscellaneous Last Part of Chapter no 5th.pdfEnzyme, Pharmaceutical Aids, Miscellaneous Last Part of Chapter no 5th.pdf
Enzyme, Pharmaceutical Aids, Miscellaneous Last Part of Chapter no 5th.pdfSumit Tiwari
 
AmericanHighSchoolsprezentacijaoskolama.
AmericanHighSchoolsprezentacijaoskolama.AmericanHighSchoolsprezentacijaoskolama.
AmericanHighSchoolsprezentacijaoskolama.arsicmarija21
 
Pharmacognosy Flower 3. Compositae 2023.pdf
Pharmacognosy Flower 3. Compositae 2023.pdfPharmacognosy Flower 3. Compositae 2023.pdf
Pharmacognosy Flower 3. Compositae 2023.pdfMahmoud M. Sallam
 
ECONOMIC CONTEXT - LONG FORM TV DRAMA - PPT
ECONOMIC CONTEXT - LONG FORM TV DRAMA - PPTECONOMIC CONTEXT - LONG FORM TV DRAMA - PPT
ECONOMIC CONTEXT - LONG FORM TV DRAMA - PPTiammrhaywood
 
Computed Fields and api Depends in the Odoo 17
Computed Fields and api Depends in the Odoo 17Computed Fields and api Depends in the Odoo 17
Computed Fields and api Depends in the Odoo 17Celine George
 
Framing an Appropriate Research Question 6b9b26d93da94caf993c038d9efcdedb.pdf
Framing an Appropriate Research Question 6b9b26d93da94caf993c038d9efcdedb.pdfFraming an Appropriate Research Question 6b9b26d93da94caf993c038d9efcdedb.pdf
Framing an Appropriate Research Question 6b9b26d93da94caf993c038d9efcdedb.pdfUjwalaBharambe
 
Procuring digital preservation CAN be quick and painless with our new dynamic...
Procuring digital preservation CAN be quick and painless with our new dynamic...Procuring digital preservation CAN be quick and painless with our new dynamic...
Procuring digital preservation CAN be quick and painless with our new dynamic...Jisc
 

Recently uploaded (20)

DATA STRUCTURE AND ALGORITHM for beginners
DATA STRUCTURE AND ALGORITHM for beginnersDATA STRUCTURE AND ALGORITHM for beginners
DATA STRUCTURE AND ALGORITHM for beginners
 
Solving Puzzles Benefits Everyone (English).pptx
Solving Puzzles Benefits Everyone (English).pptxSolving Puzzles Benefits Everyone (English).pptx
Solving Puzzles Benefits Everyone (English).pptx
 
ENGLISH 7_Q4_LESSON 2_ Employing a Variety of Strategies for Effective Interp...
ENGLISH 7_Q4_LESSON 2_ Employing a Variety of Strategies for Effective Interp...ENGLISH 7_Q4_LESSON 2_ Employing a Variety of Strategies for Effective Interp...
ENGLISH 7_Q4_LESSON 2_ Employing a Variety of Strategies for Effective Interp...
 
Model Call Girl in Tilak Nagar Delhi reach out to us at 🔝9953056974🔝
Model Call Girl in Tilak Nagar Delhi reach out to us at 🔝9953056974🔝Model Call Girl in Tilak Nagar Delhi reach out to us at 🔝9953056974🔝
Model Call Girl in Tilak Nagar Delhi reach out to us at 🔝9953056974🔝
 
Organic Name Reactions for the students and aspirants of Chemistry12th.pptx
Organic Name Reactions  for the students and aspirants of Chemistry12th.pptxOrganic Name Reactions  for the students and aspirants of Chemistry12th.pptx
Organic Name Reactions for the students and aspirants of Chemistry12th.pptx
 
OS-operating systems- ch04 (Threads) ...
OS-operating systems- ch04 (Threads) ...OS-operating systems- ch04 (Threads) ...
OS-operating systems- ch04 (Threads) ...
 
Types of Journalistic Writing Grade 8.pptx
Types of Journalistic Writing Grade 8.pptxTypes of Journalistic Writing Grade 8.pptx
Types of Journalistic Writing Grade 8.pptx
 
Capitol Tech U Doctoral Presentation - April 2024.pptx
Capitol Tech U Doctoral Presentation - April 2024.pptxCapitol Tech U Doctoral Presentation - April 2024.pptx
Capitol Tech U Doctoral Presentation - April 2024.pptx
 
Gas measurement O2,Co2,& ph) 04/2024.pptx
Gas measurement O2,Co2,& ph) 04/2024.pptxGas measurement O2,Co2,& ph) 04/2024.pptx
Gas measurement O2,Co2,& ph) 04/2024.pptx
 
ECONOMIC CONTEXT - PAPER 1 Q3: NEWSPAPERS.pptx
ECONOMIC CONTEXT - PAPER 1 Q3: NEWSPAPERS.pptxECONOMIC CONTEXT - PAPER 1 Q3: NEWSPAPERS.pptx
ECONOMIC CONTEXT - PAPER 1 Q3: NEWSPAPERS.pptx
 
POINT- BIOCHEMISTRY SEM 2 ENZYMES UNIT 5.pptx
POINT- BIOCHEMISTRY SEM 2 ENZYMES UNIT 5.pptxPOINT- BIOCHEMISTRY SEM 2 ENZYMES UNIT 5.pptx
POINT- BIOCHEMISTRY SEM 2 ENZYMES UNIT 5.pptx
 
Enzyme, Pharmaceutical Aids, Miscellaneous Last Part of Chapter no 5th.pdf
Enzyme, Pharmaceutical Aids, Miscellaneous Last Part of Chapter no 5th.pdfEnzyme, Pharmaceutical Aids, Miscellaneous Last Part of Chapter no 5th.pdf
Enzyme, Pharmaceutical Aids, Miscellaneous Last Part of Chapter no 5th.pdf
 
AmericanHighSchoolsprezentacijaoskolama.
AmericanHighSchoolsprezentacijaoskolama.AmericanHighSchoolsprezentacijaoskolama.
AmericanHighSchoolsprezentacijaoskolama.
 
Pharmacognosy Flower 3. Compositae 2023.pdf
Pharmacognosy Flower 3. Compositae 2023.pdfPharmacognosy Flower 3. Compositae 2023.pdf
Pharmacognosy Flower 3. Compositae 2023.pdf
 
ECONOMIC CONTEXT - LONG FORM TV DRAMA - PPT
ECONOMIC CONTEXT - LONG FORM TV DRAMA - PPTECONOMIC CONTEXT - LONG FORM TV DRAMA - PPT
ECONOMIC CONTEXT - LONG FORM TV DRAMA - PPT
 
Computed Fields and api Depends in the Odoo 17
Computed Fields and api Depends in the Odoo 17Computed Fields and api Depends in the Odoo 17
Computed Fields and api Depends in the Odoo 17
 
TataKelola dan KamSiber Kecerdasan Buatan v022.pdf
TataKelola dan KamSiber Kecerdasan Buatan v022.pdfTataKelola dan KamSiber Kecerdasan Buatan v022.pdf
TataKelola dan KamSiber Kecerdasan Buatan v022.pdf
 
Framing an Appropriate Research Question 6b9b26d93da94caf993c038d9efcdedb.pdf
Framing an Appropriate Research Question 6b9b26d93da94caf993c038d9efcdedb.pdfFraming an Appropriate Research Question 6b9b26d93da94caf993c038d9efcdedb.pdf
Framing an Appropriate Research Question 6b9b26d93da94caf993c038d9efcdedb.pdf
 
9953330565 Low Rate Call Girls In Rohini Delhi NCR
9953330565 Low Rate Call Girls In Rohini  Delhi NCR9953330565 Low Rate Call Girls In Rohini  Delhi NCR
9953330565 Low Rate Call Girls In Rohini Delhi NCR
 
Procuring digital preservation CAN be quick and painless with our new dynamic...
Procuring digital preservation CAN be quick and painless with our new dynamic...Procuring digital preservation CAN be quick and painless with our new dynamic...
Procuring digital preservation CAN be quick and painless with our new dynamic...
 

Human Exposure to Lead in Chile: Sources and Case Studies

  • 1. A.N. Tchernitchin et al. Rev. Environ Contam Toxicol 185:93-139 © Springer 2005 93 Human Exposure to Lead in Chile Andrei N. Tchernitchin, Nina Lapin, Lucía Molina, Gustavo Molina, Nikolai A. Tchernitchin, Carlos Acevedo and Pilar Alonso Contents: I. Introduction ……………………………………………………………...……………. 94 II. Primary sources …….………………………………………………………….……… 96 III. Lead in Household Paints ………………….………………………………..…...…… 98 IV. Lead in Gasoline …….…………………….……………………..…………..……….. 99 V. Lead Exposure Clusters ………………………….……………………….…………. 108 A. The Ñuble Case: Lead in Wheat Flour …………….…………….……….…….. 108 B. Other Clusters ….………………………………………….……..……….…….. 112 VI. Special Cases ….…………………………………………………….………………. 113 A. The Antofagasta Case: Powdered Lead Mineral Concentrates from Bolivia …………………………………………………………….….….. 113 B. The Arica Case: Toxic Wastes from Sweden and Mineral Concentrates from Bolivia …………………………………………………………………….120 VII. Other Sources ………………………………………………………………………... 127 VIII. Lead in Soil …………………………………………………………………..……… 129 IX. Recommendations …………………………………………………………………… 130 Summary ………………………………………………………………………………………. 133 Acknowledgements ……………………………………………….…………………………… 135 References …………………………………………………………….……………………….. 135 __________________ Communicated by Lilia Albert J. A.N. Tchernitchin ( ) P.O. Box Casilla 21104, Coreo 21, Santiago, Chile atcherni@med.uchile.cl A.N. Tchernitchin N. Lapin N.A. Tchernitchin Laboratory of Experimental Endocrinology and Environmental Pathology, Institute of Biomedical Sciences, University of Chile Medical School, Santiago, Chile L. Molina Institute of Public Health, Ministry of Health, Chile. G. Molina Labor Inspectorate, Work Conditions Unit, Ministry of Labor, Chile C. Acevedo University of Los Andes Medical School, Santiago, Chile P Alonso Regional Public Health Service of Ñuble, Ministry of Health, Chile.
  • 2. A.N. Tchernitchin et al. Rev. Environ Contam Toxicol 185:93-139 © Springer 2005 94 I. Introduction Lead has been used in human civilizations for about 5000 years and currently has many uses in modern technology. Its uses and toxic properties at high doses have been recognized since antiquity (Waldron 1973). Since the beginnings of lead use, evidence of lead poisoning has been found by medical historians, with dramatic effects on the destiny of ancient civilizations. The fall of the Roman Empire was related to the wide use of lead in paints, water distribution pipes, and in wine storage vessels. It was suggested that the declining birthrate, the epidemics of stillbirths and miscarriages, and apparently the increased incidence of psychosis in Rome’s ruling class, which may have been at the root of the Empire’s dissolution, were a result of exposure to lead in food and wine (Gilfillan 1965). It has been recently proposed that similar or additional effects of human population exposure to lead may contribute to the decline of current societies through lead induced impairment of intelligence (Needleman et al. 1979; Banks et al. 1997), increased tendency to addictions to drug abuse (Tchernitchin and Tchernitchin 1992; Tchernitchin et al. 1999), increase in delinquent behavior (Needleman et al. 1996), or psychological changes such as behavioral difficulties at school (Byers and Lord 1943; Banks et al. 1997). Acute exposure to high levels of lead causes serious diseases such as lead encephalopathy, which includes brain swelling and can evolve to coma and death. This is not a frequent situation, but may occur in children accidentally exposed to high lead levels, as well as in occupational accidents and attempted suicides. Chronic exposure to lower levels of lead, which usually does not cause acute symptoms or signs, is a frequent situation affecting urban populations, occupationally exposed workers, and people living in the vicinity of polluting sources. In adults, chronic exposure to lead causes progressive damage to the central and peripheral nervous systems (Needleman et al. 1979; Banks et al. 1997), a moderate increase in blood pressure (Staessen et al. 1994), and effects on both male and female reproductive systems in humans (Winder 1993) as well as in experimental animals (Ronis et al. 1996; Tchernitchin et al. 1998, 2003), causing mainly infertility and an increased abortion rate. It also affects the hematopoietic system (Grandjean et al. 1989; Pagliuca et al. 1990; Graziano et al. 1991); for review of lead interference with biosynthesis of heme, see NAS-NRC (1972). It depresses thyroid function (Tuppurainen et al. 1988) and causes nephropathy (Weeden et al. 1975, 1979; Ong et al. 1987; Cooper 1988; Cardenas et al. 1993), intestinal colic, gastrointestinal symptoms (Baker et al. 1971; Pagliuca et al 1990), and damage to the immune system, as shown in humans and experimental animals (Ewers et al. 1982; Jaremin 1983; Cohen et al. 1989; Koller 1990; Lang et al. 1993; Tchernitchin et al. 1997; Villagra et al. 1997). It may also cause effects on chromosomes (Schmid et al. 1972, Deknudt et al. 1973; Al-Hakkak et al. 1986), increase mortality rate (Cooper 1988), and decrease life expectancy. Children, compared to adults, are more vulnerable to lead in several respects. They typically engage in hand-to-mouth activities (sucking fingers, placing various objects in
  • 3. A.N. Tchernitchin et al. Rev. Environ Contam Toxicol 185:93-139 © Springer 2005 95 the mouth), which results in greater ingestion of lead than adults; they present a greater absorption and retention of lead; the exposures occur during sensitive periods of development; and children are generally more sensitive than adults to the toxicological effects of lead at a given blood level (Davis and Grant 1992). In children, chronic exposure to lead causes a slowing of growth (Schwartz et al. 1986), hearing impairment (Schwartz and Otto 1991; Dietrich et al. 1992), neurobehavioral alterations (Byers and Lord 1943; Needleman et al 1996; Banks et al. 1997), decrease in the intelligence coefficient (Needleman et al. 1979; Banks et al 1997), anemia (Schwartz et al 1990), decreased 1,25-dihydroxyvitamin D3 plasma levels (Mahaffey et al. 1982) and action (Long and Rosen 1994), slowing of myelin fiber nerve impulses (Davis and Svendsgaard 1990), intestinal colic and associated gastrointestinal symptoms (USEPA 1986), and encephalopathy (USEPA 1986, 1990). The effects of chronic exposure to lead in adolescents or adults may be reversed, at least in part, after a decrease in blood levels. However, in children, especially at earlier ages, the effects are irreversible, and may persist through life, and some effects may be induced by the mechanism of imprinting (vide infra). Lead exposure during pregnancy may lead to congenital anomalies, as reported by Needleman et al. (1984). Lead was found to be associated, in a dose-related fashion, with an increased risk of minor anomalies, mainly hemangiomas and lymphangiomas, hydrocele, minor skin anomalies, and undescended testicles. Lead exposure of pregnant mothers is also associated with low infant body weight at birth (Ward et al. 1987; Bornschein et al. 1989). Lead exposure during the last months of pregnancy or during early postnatal life causes irreversible changes that persist through life through the mechanism of imprinting. The hypothesis for this mechanism was first proposed by György Csaba, who showed in experimental animals that exposure of fetuses to some hormonally active agents during critical periods of their development induces permanent changes in the action of related hormones (Csaba 1980). These changes can be detected later in adulthood as a modification in the activity of receptors and in the intensity of responses mediated by them (Dobozy et al. 1985; Csaba et al. 1986). This effect of hormones during fetal or neonatal life, permanently modifying the ability of the cells to react to hormone stimulation during adulthood, was named by Csaba "imprinting" (Csaba 1980; Csaba et al. 1986). Work performed in our Laboratory demonstrated that, besides hormones, several other agents such as pollutants, including lead, pharmaceuticals, food additives, and normal constituents of food when ingested at abnormal amounts, may activate the mechanism of imprinting and induce persistent biochemical and functional changes that cause the development of diseases later in life (Tchernitchin and Tchernitchin 1992; Tchernitchin et al. 1999). Exposure to lead during the perinatal period may occur in mothers previously exposed to the metal, presenting increased concentration of lead in bones. Such mothers, during pregnancy or breastfeeding, require additional calcium that is obtained from bone reserves with lead stored together with calcium and is transferred through placenta or breast milk to the fetus or child during the period of life when it is most sensitive to lead.
  • 4. A.N. Tchernitchin et al. Rev. Environ Contam Toxicol 185:93-139 © Springer 2005 96 Among the delayed effects induced by this mechanism and evident during childhood, adolescence or adult life, are neurobehavioral alterations such as decrease in the intelligence coefficient (IQ), aggressive behavior, and a tendency to drug abuse and to delinquent behavior (see Tchernitchin et al. 1999 for a review of the mechanisms involved). In Chile, besides the classical sources of exposure to lead existing throughout the world (the use of leaded gasoline, lead paints, clusters originated from point sources, food contamination with lead, occupational exposure), there are special cases that deserve additional analysis. Lead exposure has caused considerable damage to Chilean population health. A description of the main sources of exposure, especially those nonfrequent sources affecting large numbers of people, the evolution of Chilean legislation and the role of different organizations and institutions in changing policies, and regulations to prevent exposure to lead, may constitute a useful experience for other countries that are less advanced in prevention and mitigation of lead contamination. The purpose of this review is to describe available information on the main sources of lead pollution in Chile and report the most conspicuous episodes of lead contamination, describe the most relevant clinical and laboratory findings in exposed population, summarize the evolution of legislation in the country, and analyze proposed actions for remediation and human protection. II. Primary Sources in Chile Formerly the greater source of lead contamination in Chile was the use of leaded gasoline, mainly in densely populated cities. The progressive decrease in lead content in leaded gasoline, which was banned in April 2001 (SESMA Chile 2002), was the main cause of a decrease in urban lead pollution; however, large amounts of fine lead particle still persist in highly populated cities as city soil and home soil, and as ground contamination near highways, which can be detected in several vegetables such as lettuce grown near highways or within highly populated cities (see following). The Government of Chile issued new regulations for lead in air (DS 136/2000 Chile 2000), allowing 0.5 µg/m3 as maximal annual mean. Another important source of lead contamination was the use of paints with high lead content for painting houses, children’s furniture and toys, and other objects. From 1997 on, new legislation regulated lead content in paints (D 374/97 Ministry of Health, Chile 1997); houses, furniture, children’s toys, and other objects painted before 1997 are still an important source of exposure to lead, mainly in children. Children’s toys, pencils, and other school tools and implements, which children frequently take into their mouth, constitute sources of exposure to lead. Various degrees of food lead contamination may increase exposure to the metal. Vegetables grown in or near highly populated areas, lead pipes in old dwellings or copper pipes welded with lead, and formerly lead from canned food, especially those cans that had been accidentally deformed, or food stored in opened cans may contribute.
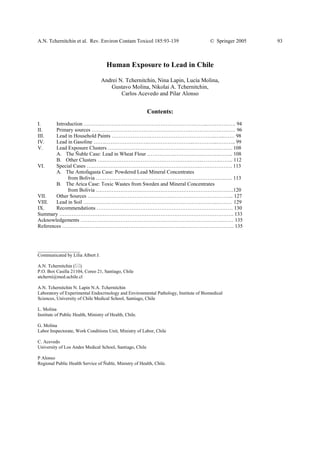
  • 5. A.N. Tchernitchin et al. Rev. Environ Contam Toxicol 185:93-139 © Springer 2005 97 Fig. 1. Map of Chile, showing location of cities mentioned in text. Clusters of different magnitude originated from point sources, of which the most relevant in magnitude was that occurring in Ñuble with the use of wheat flour contaminated with lead, caused by the use of a mill whose stone had been repaired by lead welding. Several other clusters of smaller magnitude are frequently caused by the practice of battery repair and recovery by small enterprises or as family projects, affecting all family members and occasionally those living in the vicinity. Occupational exposure frequently occurs in painters, welders, and mining or smelting workers, among others. In addition to the traditional sources of exposure to lead common in other countries, in Chile a few special cases of very important environmental contamination occurred, affecting the population of two important cities. The most dramatic case was the storage of powdered lead mineral concentrates at the ports or railroad terminals within the cities of Arica and Antofagasta (Fig. 1), where it would remain until it could be shipped by sea. Lead from this source is the most relevant source of exposure in the cities of Arica and Antofagasta. The second case of lead pollution originated from toxic wastes imported by Promel from the Swedish company Boliden Metal as “toxic raw material for industrial purposes”. Local health authorities (1983-1985), although they knew the exact composition of the toxic wastes, informed that “the material is not toxic, anybody can manage it, it cannot be ingested”. This material turned out to be hazardous toxic wastes sent to Chile by Boliden Metal and stored without any protection in Arica suburbs between 1983 and 1985, where, a few years later, new dwellings were constructed and residents were exposed for more than 10 years. III. Lead in Household Paints Before 1996 there was no regulation on lead content in household paints. Considering that it is an important cause of increased blood levels in children, caused by pica ingestion (mainly leaded paint chips and powder), many other countries have strict
  • 6. A.N. Tchernitchin et al. Rev. Environ Contam Toxicol 185:93-139 © Springer 2005 98 regulations. Following several recommendations to the Government by the Colegio Médico de Chile (Chilean Medical Association) that were not taken into consideration, the Colegio Médico measured lead levels in several commercially available paints. Measurements were made by atomic absorption spectroscopy at the Institute of Public Health of the Chilean Ministry of Health. Table 1 shows the lead content (w/w) in household paints (as dry wt of paint) in most commonly sold brands and types in Chile in 1996 (Tchernitchin and Castro 2002). As soon as the finding of high lead content in household paints sold in Chile was communicated in a press conference, the Ministry of Health organized a commission with the participation of the Colegio Médico to study and propose new standards for lead content in paints. These new standards were approved in 1997 as Regulation 374 from the Ministry of Health, allowing a maximum of 0.06% (dry wt) lead content in paint (D 374/97 Ministry of Health Chile 1997). The highest lead content in paints corresponded to the brandname of Sherwin Williams (an American corporation that licensed the formula to a Chilean company) that contained nearly 20% lead in the Sherwin Williams yellow brilliant oil enamel. A similar Sherwin Williams paint purchased in Miami, FL, U.S.A. contained nonmeasurable levels of lead Table 1 Lead content (w/w) in household paints (as dry wt of paint) in most commonly sold brand names and types in Chile (1996). Paint trade mark Type of paint Color Lead %, w/w dry wt Sherwin Williams Enamel oil Yellow 19.814 Tricolor Enamel oil Red 9.518 Sherwin Williams Enamel oil Vermilion 4.935 Tricolor Enamel oil Cream 3.537 Soquina Enamel oil Black 1.035 Sherwin Williams Enamel oil Blue 0.921 Sherwin Williams Enamel oil White 0.591 Iris Enamel oil Green 0.563 Tricolor Enamel oil Brown 0.425 Tricolor Enamel oil Blue 0.420 Soquina Anticorrosive Black 0.388 Soquina Enamel Oil Calypso 0.338 Iris Cover oxide Red 0.329 Soquina Anticorrosive Red 0.150 Sipa Oil opaque Grey 0.066 Iris Latex Green 0.011 Iris Latex Black 0.006 Sherwin Williams Latex White 0.003 Sherwin Williams Latex Blue 0.002 Sipa Latex Blue 0.002 Sipa Latex Apricot 0.002 Source: (Tchernitchin and Castro, 2002).
  • 7. A.N. Tchernitchin et al. Rev. Environ Contam Toxicol 185:93-139 © Springer 2005 99 (Tchernitchin 2001; Tchernitchin and Castro 2002). This finding was the root of the proposition of the Colegio Médico de Chile (Chilean Medical Association) through the Sustainable Development Council of Chile at the Johannesburg Summit 2002, according to which countries should agree on treaties forbidding exportation of products banned in the countries of their origin because of their health risk, to importing countries without regulations, based on ethical considerations (Tchernitchin and Villarroel 2002, 2003). Although paints with high lead content supposedly were not sold in Chile after 1997, in many houses walls are painted with lead paint. When a house, especially indoors, is to be painted again, the old paint must be removed; the paint removal procedure widely used in Chile is done with sandpaper or by scraping, leading to the accumulation of high amounts of fine lead-containing dust that remains for a long time inside recently painted buildings and is a source of exposure mainly for children that bring to their mouth toys or other objects from the floor, thus ingesting lead-containing dust adhered to these objects. IV.Lead in gasoline The Metropolitan Area of Santiago (Figs. 1, 2) presents high levels of atmospheric pollution, which are favored by geographic and climatic adverse conditions for the dispersion of pollutants during fall and winter months, and by an increase in economic activity and growth of the city in population and especially in its area. Santiago concentrates 39% of the total Chilean population; its area is 15554.5 km2 , about 2.1% of the total surface of the country (excluding the Antarctic Territory). Its urbanized surface is about 520 km2 , with 1,710 km2 used for agriculture; and the remaining surface is mountainous. The city of Santiago is topographically located in a depression, about 500 to 650 m above sea level, and is surrounded by mountains: the highest range, east from Santiago, is the Andean mountains, those closest to the city bordering 3000 m above sea level and higher mountains toward the border with Argentina; the Coastal Range, west from Santiago, with mountains bordering 2000 m above sea level with a narrow strip connecting the Santiago depression with lower altitudes bordering the Pacific Ocean; north from Santiago, mountains about 1200 m above sea level joint the Coastal Range with the Andean mountains, and south from the city there exists a very narrow valley that connects the Santiago lowlands with the central valley that becomes wider to the south. In addition to topographical conditions increasing pollution in the Santiago depression, adverse meteorological conditions exist that worsen during the fall and winter. These include stable atmospheric conditions, mild winds whose direction reverses during night hours, and the atmospheric inversion layer that lowers in altitude and intensifies during certain meteorological episodes during fall and winter, which increase the concentration of various pollutants in air, including lead in breathable particles (<2.5 µm dia). Winds in the city area are very weak during fall and winter seasons, except the occasional frontal systems that cross the area during the rainy season (May-July, 2-4 times/mon) during that season. Between the frontal episodes there are very stable
  • 8. A.N. Tchernitchin et al. Rev. Environ Contam Toxicol 185:93-139 © Springer 2005 100 Fig. 2. Map of the Santiago Metropolitan Area, indicating the communities or parts of the city mentioned in the text. The dark shaded area corresponds to the densely populated area of Santiago. atmospheric conditions, and winds are very weak and change their direction from SW during daylight hours to NE during the night. Therefore the same air may remain for several days or even longer than a week over the city during the fall and winter. The atmospheric inversion is a layer of warm air that covers a cooler layer beneath and constitutes an obstacle for mixing the layer of polluted city air with the higher clean layers. This inversion layer is thin during the spring and summer and is situated at much higher altitude; therefore, the thickness of this lower layer increases, diluting pollutants with a greater air volume. During the warm season, this inversion frequently breaks up, allowing pollutant dispersion by convection. During fall and winter seasons, this inversion is at low altitude (50-300 m), decreasing the volume of air to dilute city pollutants, and intensifying the inversion (i.e., increasing the difference in temperature between the upper warm layer and the lower cool layer). Most mountains surrounding Santiago are higher than the inversion layer so that the pollutants remain in the
  • 9. A.N. Tchernitchin et al. Rev. Environ Contam Toxicol 185:93-139 © Springer 2005 101 depression. The inversion further intensifies under certain meteorological conditions characterized by low wind speeds related to the movement of low atmospheric pressures along the coast, so-called A-type episodes, that intensify the subsidence inversion; i.e., lower air temperature at ground level covered by a higher temperature air layer resulting from heating of air currents descending from the Andean mountains (Gallardo et al. 2000). This situation affects most of Central Chile and in Santiago and other cities gives rise to extreme pollution episodes. These characteristic patterns affecting air pollution in Santiago were described in detail by Ruthllant and Garreaud (1995). Taking into consideration the above conditions increasing pollution in Santiago metropolitan area, and that one of the components of this pollution is lead, whose main source was the wide use of leaded gasoline, it was necessary to determine blood lead levels in residents of Santiago and their change through the different seasons. This situation was the justification of investigations of blood lead levels and of biological indicators of exposure to lead in Santiago under different climatic conditions, comparing them to those in other less-populated cities. In this context, the amount of lead released from primary sources was also important information that was needed. 0 2 4 6 8 10 12 14 16 18 Child Care Center U-ALAconcentration(µg/L) Conchalí Conchalí Conchalí L Condes L Condes L Condes Downtown Downtown Downtown Cisterna Cisterma Las Rejas Las Rejas Las Rejas S Bernardo Rengo Fig. 3. Urine delta aminolevulinic acid in 2- to 5-yr-old children in 1979, from child-care centers in central Santiago, in suburban Santiago and in Rengo,. One to 3 child care centers were investigated in each area. (Modified from Cisternas and Sáez 1980).
  • 10. A.N. Tchernitchin et al. Rev. Environ Contam Toxicol 185:93-139 © Springer 2005 102 The early studies on lead exposure, done in 1979 (Cisternas and Sáez 1980), measured the concentration of the delta aminolevulinic acid in the urine of children 2-5 yr old in childcare centers in central Santiago (downtown), in the suburban Santiago (Conchalí, Las Condes, La Cisterna, Las Rejas, and San Bernardo; see Fig. 2), and Rengo (south of Santiago; see Fig. 1). Figure 3 shows that the urine concentration of delta aminolevulinic acid, an indicator of increased levels of lead in the blood, was much higher in the central part of Santiago than in suburban Santiago and that the lowest levels are in Rengo. Figure 3 calls attention to high levels in San Bernardo, in spite of being suburban, which can be explained by the fact that it is surrounded by industrial areas and is located in the area of influence of Caletones (Gallardo et al. 2000), a copper smelter in the mountains southeast of San Bernardo. A study performed during 1992 (Ministry of Health, Chile 1993) compared blood lead levels (measured by atomic absorption spectroscopy) from newborn children (umbilical cord blood) and at 6, 12 and 18 mon of age, from Santiago and from the city of San 0 1 2 3 4 5 6 7 C.Umb. 6 12 18 Children's age (months) Bloodleadlevels(µg/dL) Sn.Felipe Santiago Fig. 4. Lead levels in umbilical cord blood of newborn children and 6-, 12-, and 18-mon-old children from Santiago and San Felipe, 1992 cohorts. (From Ministry of Health, Chile 1993)
  • 11. A.N. Tchernitchin et al. Rev. Environ Contam Toxicol 185:93-139 © Springer 2005 103 -2 0 2 4 6 8 10 12 14 16 Umb cord 6 12 18 Children's age (months) %childrenwithbloodleadlevels >=10µg/100mL Sn.Felipe Santiago Fig. 5. Percentage of children with blood lead levels ≥10 µg/dL, from Santiago and in San Felipe, 1992 cohorts. (From Ministry of Health, Chile 1993.) Felipe (see Fig. 1). Figure 4 shows that blood levels were higher in children from Santiago than those from San Felipe and that blood levels increased from birth up to 18 mon of age. Figure 5 shows that the percentage of children with blood levels ≥10 µg/dL, considered at risk, are higher in children from Santiago than in San Felipe. Comparison of data from Fig. 6 shows the seasonal variation of blood lead levels in children from Santiago and San Felipe (1992-1993). Data from Fig. 7 show the monthly averages of lead in the air of these locations. About a 1-mon delay can be observed between the increase in lead in the air and the increase in blood levels. Both figures also show that lead levels are lower in the city of San Felipe than in Santiago. Further, a 1992-1995 comparison of children from downtown Santiago, Maipú (a suburb west of downtown Santiago) and the city of San Felipe (Frenz et al., 1997) (see Figs. 1, 2) showed that blood levels in Santiago were slightly higher than in the remaining locations with San Felipe displaying the lowest levels. Children from all three
  • 12. A.N. Tchernitchin et al. Rev. Environ Contam Toxicol 185:93-139 © Springer 2005 104 0 1 2 3 4 5 6 7 Jan Feb Mar Apr May Jun Jul Aug Sep Oct Nov Dec Bloodleadlevels(µg/dL) Santiago San Felipe Fig. 6. Blood lead levels in children from birth to the age of 24 mon from Santiago and San Felipe, 1992- 1993. (Modified from Frenz et al. 1997.) locations displayed an increase in blood levels from birth to the age of 1 yr; thereafter, lead levels tended to stabilize or slightly decrease (Fig. 8). Figure 9 shows the important difference between Santiago and the remaining locations when comparing percentage of children with blood levels >10 µg/dL). Four important actions taken by the Chilean government decreased lead concentration in air and lead blood levels in the population: (1) the introduction of unleaded gasoline in addition to leaded gasoline in 1990, which according to the 2003 Prevention and Descontamination Plan for the Metropolitan Area of Santiago approved by Regulation (DS 058/03 Chile 2003) is allowed to have a maximal lead content of 0.013 g/L; (2) the 0 0.5 1 1.5 2 2.5 Jan Feb Mar Apr May Jun Jul Aug Sep Oct Nov Dec Leadinair(g/m3 N) Santiago San Felipe Fig. 7. Lead concentrations in air (monthly averages) in Santiago and San Felipe, 1992-1993 (Modified from Frenz et al. 1997.)
  • 13. A.N. Tchernitchin et al. Rev. Environ Contam Toxicol 185:93-139 © Springer 2005 105 0 1 2 3 4 5 6 7 Umb.Cord 6 12 18 24 Age (mon) Bloodleadlevels(µg/dL) San Felipe Maipú Santiago Fig. 8. Effect of age on lead blood levels in 0- to 24-mon-old children from downtown Santiago, Maipú, and San Felipe, 1992-1995. In newborns, blood taken from umbilical cord. (From Frenz et al. (1997.) compulsory use of cars with catalytic converters from 1992 models on (which does not allow the use of leaded gasoline because its lead damages the converter); (3) the progressive decrease in lead content in leaded gasoline, which was not available after April 2001 (SESMA Chile 2002); and (4) the approval of the new standard for lead in air (0.5 µg/m3 as annual mean level), legally valid from February 2001 (DS 136/00 Chile 2000). Additionally, new regulations on lead content in household paints (see below) and more strict measures for industry emissions of particulate matter contributed to the decrease in lead levels in air and its effects on the population of Santiago. According to information provided by the Enviromental Health Service of the Metropolitan Area of Santiago (SESMA Chile 2001), the annual use of leaded and unleaded gasoline in the metropolitan area of Santiago since 1992 is shown in Fig. 10, the concentrations of lead in gasoline in 1997-1999 are shown in Table 2, and the contribution of leaded gasoline to the total amount of lead released into the air of the metropolitan area of Santiago in 1997-1999 is shown in Table 3.
  • 14. A.N. Tchernitchin et al. Rev. Environ Contam Toxicol 185:93-139 © Springer 2005 106 0 1 2 3 4 5 6 7 Umb cord 6 12 18 24 Age (months) %childrenwithbloodleadlevelsover10µg/100mL Sn.Felipe Maipú Santiago Fig. 9. Effect of age on the proportion of subjects with lead blood levels >10 µg/dL in 0- to 24-mon-old children from Downtown Santiago, Maipú and San Felipe, 1992-1995 (From Frenz et al. 1997.) It was assumed that the progressive decrease in lead released into the air originating from leaded gasoline in the Santiago metropolitan area should result in a progressive decrease in the concentrations of lead in the air of Santiago and, consequently, in the levels of lead in the blood of the general population. A study performed in three locations of the city (La Pintana, Avenida Ossa, and Cerrillos by SESMA Chile (2001) demonstrated the progressive decrease in lead in the air at these locations (Fig. 11). The figure shows the differences between the different locations in Santiago, which can be attributed to the amount of cars using leaded gasoline at these locations and the wind directions at hours of heaviest traffic. Also shown are the seasonal
  • 15. A.N. Tchernitchin et al. Rev. Environ Contam Toxicol 185:93-139 © Springer 2005 107 0 200,000 400,000 600,000 800,000 1,000,000 1,200,000 1,400,000 1,600,000 1,800,000 2,000,000 1991 1992 1993 1994 1995 1996 1997 1998 1999 2000* Year Gasolineconsumptionperyear(m3) Leaded Non leaded Total Fig. 10. Annual use of leaded and unleaded gasoline in the Metropolitan Area of Santiago 1991-2000; *, estimation for 2000. (From SESMA Chile 2001.) variations in lead concentrations in the air due to climatic conditions, mainly the decrease in the altitude of subsidence inversion and extremely stable atmospheric conditions in fall and winter (vide supra). Table 2. Lead content in leaded gasoline in the metropolitan Santiago in 1997-1999.a Year Pb (g/L) 1997 0.32 1998 0.25 1999 0.19 a According to new 2003 regulations, unleaded gasoline maximum allowed lead is 0.013 g/L (DS 058/03 Chile 2003) Source: SESMA Chile (2001)
  • 16. A.N. Tchernitchin et al. Rev. Environ Contam Toxicol 185:93-139 © Springer 2005 108 Table 3. Lead released through use of leaded gasoline in metropolitan Santiago in 1997-1999 Year Lead Ton/year % lead reduction from 1997 1997 197.1 --- 1998 116 41.10% 1999 73.25 62.80% Source: SESMA Chile (2001) 0 0.1 0.2 0.3 0.4 0.5 0.6 La Pintana Avenida Ossa Cerrillos Location of lead measurement station Leadinair(µg/m 3 ),annualmeans 1997 1998 1999 2000 Fig. 11. Annual averages of air lead concentration in La Pintana, Avenida Ossa, and Cerrillos, (1997- 2000). (From SESMA Chile 2001.) V. Lead Exposure Clusters Clusters of various magnitude originated from point sources, of which the most relevant occurred in Ñuble as a result wheat flour contaminated with lead, caused by the use of a millstone repaired by lead welding. Several other clusters of smaller magnitude are frequently caused by the common practice of battery repair and recovery by small enterprises or as family projects, affecting all the family and occasionally those living in the vicinity. A. The Ñuble Case: Lead in Wheat Flour This case of a massive intoxication with lead was reported in extenso by Alonso et al. (1997). The massive exposure was discovered with the case of two children that were attended by the Ñuble health service on January 26, 1996, with signs of malnutrition and abdominal and leg pain (Alonso et al. 1997). Both children were interned at the hospital
  • 17. A.N. Tchernitchin et al. Rev. Environ Contam Toxicol 185:93-139 © Springer 2005 109 with a diagnosis of malnutrition and serious anemia and a suspicion of maltreatment and family violence. The latter suspicion was disregarded because the parents had gone to different health centers several times during the past 3 mon because of the children’s symptoms. It appeared that the head of the family had also been hospitalized recently with a diagnosis of possible gastric ulcer, presenting also with anemia and muscular pain. An hypothesis was drawn that an environmental condition was causing the family’s disease. A site visit was coordinated for the next day. Following the suspicion of lead intoxication, a hemogram was taken and revealed punctuate basophilia of erythrocytes in both children, a characteristic sign of lead exposure. The diagnosis of lead toxicity was finally confirmed by atomic absorption spectrometry of blood. The 6-yr-old girl had 104 µg/dL and her 9-yr-old brother 91 µg/dL. The girl died shortly thereafter, despite the initiation of chelation treatment, and the boy developed serious neurological complications. A professional group from the Regional Public Health Service of Ñuble made the first site visit to the home of the affected children. Sample analyses obtained from the site visit are shown in Table 4. Following the girl’s death, several site visits were performed at the family residence, homes in the neighborhood, and the residence of patients frequently attending health centers in the region; these were aimed to determine the causes and source of intoxication and the number of affected individuals. Samples of drinking water, children’s toys, house wall paint, food (flour and wheat), soil, and blood were investigated for their lead content at the Institute of Public Health of Chile. Results from this study are shown in Tables 5 and 6. This study identified the source of lead contamination, which was wheat flour produced in a mill that had a grindstone repaired with lead welding in October 1995. Thereafter, the study included homes in the neighborhood and the residences of patients frequently attending health centers in the region. All these sampled families displayed lead blood levels between 17 and 99 µg/dL. All except the case family worked for the Table 4. Lead concentrations in samples collected in homes of affected children. Sample Lead concentration (µg/g) Doll dress 0.74 Doll hear 0.01 Plastic spoon 0.01 Paint scrapping 7.32 Leaves from a garden plant 23.46 Soil of room for food storage 12.50 Soil surrounding home 37.50 Soil from behind residence 15.00 Well water Within legal limits (<0.05) Source: Alonso et al. (1997).
  • 18. A.N. Tchernitchin et al. Rev. Environ Contam Toxicol 185:93-139 © Springer 2005 110 Table 5. Blood lead levels of affected children, their family, and animals living with them. Family of lead intoxicated children Lead µg/dL Animals living with the family Lead µg/dL 6-yr-old girl (deceased as result of lead poisoning) 104 Pig 25 9-yr-old brother 91 Horse (nd) Younger sister 114 Father 148 Mother 87 Grandfather (living elsewhere, frequently visiting the family) 28 (nd), non detected. Source: Alonso et al. (1997). same employer, who gave them wheat flour as part of their salaries, at the San Luis Estate. At this location 60 family heads were employed, and their blood levels were determined. The wheat flour from this estate was milled in three mills; only one of them produced lead-contaminated flour (see Table 6). Wheat samples did not display lead content. At that moment it was found that one the two millstones had been fractured in several fragments that were welded with lead welding and partially covered by melted lead to join them to a metal arm. At a consequence, 8700 kg of contaminated flour was destroyed. The exposed population was considered to be 95 families living in the neighborhood and all relatives of people that were noted in a register of clients that gave wheat to be milled it in the repaired mill after the repair date, October 23 and 24, 1995, 3 mon before Table 6. Lead measurements in wheat and wheat flour from various sources. Wheat and wheat flour from different sources Lead, mg/kg Wheat flour used by the case family 110 Wheat flour used in Estate San Luis 174.9 Wheat flour used in Estate Serrano 207.2 Wheat flour used by family “2”, (the first family identified with symptoms, without any relation to the case family) 627.8 Wheat flour from Mill “Quiriquina A” < 1 Wheat flour from Mill “Quiriquina B” < 1 Wheat flour from Mill “Quiriquina C” 112.4 Wheat from other sources (nd) (nd), non detected. Source: Alonso et al. (1997).
  • 19. A.N. Tchernitchin et al. Rev. Environ Contam Toxicol 185:93-139 © Springer 2005 111 Table 7. Subjects presenting symptoms within the total exposed population, according to age. Age (years) n (lead-exposed population) Percent with symptoms Percent without symptoms < 6 231 10.9 89.1 6 - 15 488 10.7 89.3 > 15 1359 22.4 77.6 Source: Alonso et al. (1997). the detection of the first case. A questionnaire was designed for the population to determine consumption of products from the repaired flour mill; it contained questions related to symptoms and signs of lead exposure and about the origin of their flour and the ingested amounts. The Chilean Ministry of Health sent to Chillán, the main city of the Ñuble province, professionals from the Department of Epidemiology of the Ministry, from the Pan-American Health Organization (PAHO), and from the local health services, who applied the following procedure: measurement of zinc proto porphyrine (ZPP) concentrations in blood obtained from digital puncture and a request that the same subjects complete a questionnaire. Four hundred ninety eight families totaling 2056 subjects, were studied. Blood collected by venipuncture was obtained for lead content evaluation by atomic spectroscopy from children under 15 years old displaying ZPP values of 3.5 or higher, and from subjects older than 15 years displaying ZPP values of 8 or higher. At the same times, all flour these families had stored at their homes was destroyed (3400 kg). The treatment consisted of blood lead chelation with calcium EDTA (ethylenediaminetetraacetic acid, calcium disodium edetate) at 1000 mg/m2 /d in two daily doses, for 5 d, in hospitalized patients. The age distribution of those 2056 investigated subjects was 11.24% of children under 6 years of age, 22.68% between 6 and 15 years, and 66.08% older than 15 years. Of them, 18.9% (388 subjects) presented symptoms; these were classified as mainly presenting abdominal symptoms (33.6%), musculoskeletal pain and leg fatigue (28.7%), and other symptoms such as headache, weight decrease, and paleness (37.7%). The proportion of subjects presenting symptoms from the total exposed population, at the different age groups, is shown in Table 7. The lead line in the gums was found in 8 subjects only, all adults. Table 8. Lead positive results from screening of zinc protoporphyrine (ZPP) concentrations in blood, according to age. Age (yr) n (total screenings in lead-exposed population) n subjects displaying positive screening (see text) Percent positive (see text) < 6 77 49 63.6 6 - 15 193 135 69.9 > 15 496 246 49.6 Source: Alonso et al. (1997).
  • 20. A.N. Tchernitchin et al. Rev. Environ Contam Toxicol 185:93-139 © Springer 2005 112 Table 9. Subject distribution according to blood lead levels in two age groups. Age <= 15 y Age > 15 y Blood lead levels (µg/dL) n % n % < 20 4 2.13 0 0 20-40 64 34.04 4 11.76 40-60 102 54.26 18 52.94 > 60 18 9.57 12 35.29 Total 188 100 34 100 Source: Alonso et al. (1997). The results of the 766 persons screened for blood ZPP, and their distribution according to age, are shown in Table 8. According to screening results, 188 determinations of blood lead were performed in the group ≤15 years of age and 134 determinations in adults. Table 9 shows the distribution of the subjects according to their age group and lead blood levels. In the children 137 displayed levels ≥40 µg/dL and were treated. Their age distribution is shown in Table 10. Children were most affected because of the risk of sequelae in this age group. According to the Ñuble study (Alonso et al. 1997), 604 children made up the affected population, which corresponds to 39.9% of the population at risk. Of them, 590 were of school age, therefore, several neurological and behavioral sequelae probably affected this exposed population. B. Other Clusters Several other clusters of smaller magnitude are frequently caused by the widespread practice of battery repair and recovery by small enterprises or as a familial productive activity, affecting all family members and occasionally those living in the vicinity. One typical case occurred in 1995 in Freire, 700 km south of Santiago. There was a court sentence to relocate a lead processing plant due to contamination of soils used for agriculture and that affected the health of residents in the vicinity of the plant for almost 20 years. This sentence was not obeyed, and the activity that was to be finished more than 1 mon ago continued. This motivated the police to close the buildings and seal the Table 10. Age distribution of children treated with blood lead chelation. Age (years) n children treated % children treated < 1 1 0.7 1 – 5 20 14.6 6 – 14 113 82.5 15 3 2.2 Total 137 100 Source: Alonso et al. (1997).
  • 21. A.N. Tchernitchin et al. Rev. Environ Contam Toxicol 185:93-139 © Springer 2005 113 furnace where old lead batteries were melted. The Araucanía Regional Health Service detected, in December 1994, “very high lead levels in the blood” in six children and eight adults in relation to this cluster. VI.Special Cases Two special cases of important lead exposures in Chile are analyzed separately: the Antofagasta case of lead contamination that originated from powdered lead mineral concentrate transport and storage, and the Arica case of lead contamination, which originated from both powdered lead mineral concentrate transport and storage and from lead- and arsenic-containing toxic wastes brought from Europe. A. The Antofagasta Case: Powdered Lead Mineral Concentrates from Bolivia Antofagasta is a coastal city and port in the north of Chile. The main source of lead pollution was powdered lead mineral concentrates, mainly lead sulfide containing about 26.5% lead according to measurements made at the Institute of Public Health of Chile, Chilean Ministry of Public Health. This mineral, transported through the city and openly stored near densely populated parts of the city, comes by railroad from Bolivia. According to an old international treaty between both countries, Chile is obliged to transport and keep the mineral in its ports until exported by sea to other countries. Until 2002-2003 it was stored in open sites at the Antofagasta port until it could be transported overseas, or at the railroad terminal in Antofagasta, where it usually was stored for years and then transported by trucks to the port, spilling the mineral on its way through the city. The mineral storages were not protected against wind; therefore, a significant amount of lead-containing particles was swept by wind to the vicinity, where there were numerous dwellings, the residences of numerous Antofagasta habitants. The Colegio Médico Regional Antofagasta (Antofagasta Regional Medical Association) drew the conclusion that there was massive exposure to lead in Antofagasta in 1996-1997, based on signs and symptoms suggesting lead toxicity in patients living in the vicinity of lead mineral storage sites. This was the root of the Antofagasta Study by the Colegio Médico de Chile (National Chilean Medical Association) and associated researchers (Andrei N. Tchernitchin, Nina Lapin and Carlos Acevedo) reported below. The Antofagasta Colegio Médico study included a group of 84 residents living closer than 200 m from the mineral storage place in the Chilean-Bolivian railroad terminal station, who voluntarily agreed to undergo the study. The age distribution of the sample is shown in Table 11. Blood samples were taken from these residents, who were informed of the purpose of the study and accepted the procedure. Lead levels were measured and an anamnesis and physical examination was performed by one of us (CA), searching for neurological signs and symptoms including learning deficit and behavioral alterations. Figure 12 shows
  • 22. A.N. Tchernitchin et al. Rev. Environ Contam Toxicol 185:93-139 © Springer 2005 114 Table 11. Age distribution the 1997 Antofagasta lead study subjects, comprised of residents living less than at 200 m from the mineral storage site in the Chilean- Bolivian railroad terminal station. Age (yr) n 1-2 7 3-4 5 5-6 7 7-8 10 9-10 10 11-12 15 13-88 30 mean blood levels for each age group; the ages most affected with the highest levels are 1-4 and 7-10 yr. In the distribution of children (1-10 yr old), according to blood levels, only 8% of children 1-10 yr old displayed levels below 10 µg/dL and 8% had levels between 40 and 49 µg/dL. Figure 13 shows the distribution of all ages according to blood levels. Neurological evaluation of the study group of these 84 residents (all ages) revealed that the percentage of subjects displaying neurological manifestations increased in groups with higher blood lead levels (Fig. 14). A similar situation was observed for the children 1-10-yr-old (Fig. 15). Neurological manifestations were evaluated as the sums of scores of the different neurological signs and symptoms from anamnesis and physical examination by the neurologist from our research team (CA), which included learning deficit and behavioral 0 5 10 15 20 25 30 1-2 3-4 5-6 7-8 9-10 11-12 13-88 Age (years) Leadlevelintheblood(µg/dL)(means) Serie1 Fig. 12. Blood lead levels in subjects living less than 200 m from lead mineral storage site in Antofagasta railroad station (1997).
  • 23. A.N. Tchernitchin et al. Rev. Environ Contam Toxicol 185:93-139 © Springer 2005 115 < 10 26% 10 to 19 45% 20 to 29 18% 30 to 39 7% 40 to 49 4% < 10 10 to 19 20 to 29 30 to 39 40 to 49 Fig. 13. Blood lead levels (µg/dL) distribution in the group of residents (all ages) living less than 200 m from lead mineral storage site in Antofagasta railroad station (1997). alterations. For each symptom or sign, value 1 was assigned to moderate intensity and 2 for severe. Results are shown for all age froups (Fig. 16) and for the children 1-10 yr in age (Fig. 17), where intensity of neurological manifestations is correlated with blood lead levels in both the children and all age groups. Other studies continued with the investigation of blood levels in Antofagasta residents, classifying them into three groups according to the place of their residence: (1) in the vicinity of the lead mineral storage place at the railroad station, (2) in the vicinity of the port, where the concentrated mineral also was stored, and (3) a control group situated far away from contamination sources and the predominant wind direction from any of the contaminated places in Antofagasta. These sites and their residents were evaluated for lead concentrations in air, soil, and drinking water and 0 10 20 30 40 50 60 70 80 90 100 3-9 10-19 20-29 30-49 Lead level in the blood (µg/dL) %ofpopulationwithneurological manifestations Fig. 14. Percentage of subjects displaying neurological manifestations, according to blood lead level, in the group of residents (all ages) living less than at 200 m from lead mineral storage site in Antofagasta railroad station.
  • 24. A.N. Tchernitchin et al. Rev. Environ Contam Toxicol 185:93-139 © Springer 2005 116 -10 0 10 20 30 40 50 60 70 80 90 100 3-9 10-19 20-29 30-49 Lead level in the blood (µg/dL) %ofpopulationwithneurological manifestations Fig. 15. Percentage of subjects displaying neurological manifestations, according to blood lead levels, in the group of yr 1- to 10-yr-old children living less than 200 m from lead mineral storage site in Antofagasta railroad station. lead concentrations in the blood during 1998 (Sepúlveda et al. 2000). Table 12 shows that the geometric means of lead levels in blood were more than doubled in the population living near the railroad station than in the control location: levels of residents near the port had lower levels than in those near the railroad station but considerably higher than in the control location. Samples of lead levels in the soil around residences near the railroad, or in the dust over the dwellings or inside homes, had much higher levels than in control locations, some of them reaching >3 g lead/kg; the highest level in the control 0 1 2 3 4 5 6 3-9 10-19 20-29 30-39 40-49 Lead levels in the blood (µg/dL) Intensityofneurologicaleffects Fig. 16. Intensity of neurological manifestations in the group of residents (all ages) living less than 200 m from lead mineral storage site in Antofagasta railroad station, and their blood lead levels.
  • 25. A.N. Tchernitchin et al. Rev. Environ Contam Toxicol 185:93-139 © Springer 2005 117 -1 0 1 2 3 4 5 6 3-9 10-19 20-29 30-39 40-49 Lead levels in the blood (µg/dL) Intensityofneurologicaleffects Figure 17. Intensity of neurological manifestations in the group of residents (1-10 yr old) living less than 200 m from lead mineral storage site in Antofagasta railroad station and their blood lead levels. location was 321 mg/kg. The study did not investigate the location near the port. Levels of lead in respirable particulate matter (<10 µm-diameter particles) in air were two fold higher in the port than near the railroad station. Lead in air seemed to be lower in the control location, but this information cannot be taken into consideration because it comes from measurements made over 2 mon, in contrast to the other measurements that averaged 6 months, and the station-dependent climatic conditions may alter lead concentration in air. Table 12. Lead concentrations in blood and environmental lead in three areas of Antofagasta, 1998. Lead (µg/m3 ) in air respirable particulate matter (<10 µm diameter)a Lead content in soil (mg/kg) Lead in blood (µg/dL), geometric means Port area 0.28 (6 months) 6.890 Railroad Station area 0.14 (6 months) 81 to 3159 8.671 Non-contaminated control area 0.10 (2 months) 51 to 321 4.221 a Time in parenthesis is sampling period over which data were averaged. Source: Modified from Sepúlveda et al. (2000).
  • 26. A.N. Tchernitchin et al. Rev. Environ Contam Toxicol 185:93-139 © Springer 2005 118 Table 13. Percentage of subjects with more than 10 and 20 µg/dL lead in their blood in three areas of Antofagasta, 1998. Sample size Blood lead ≥10 µg/dL Blood lead ≥20 µg/dL n n % of sample n % of sample Port area 54 17 31.5 % 5 9.3 % Railroad Station area 432 205 47.5 % 43 10 % Non-contaminated control area 75 0 0 % 0 0 % Total 561 222 39.6 % 48 8.6 % Source: Modified from Sepúlveda et al. (2000) Table 13 shows that all 75 subjects living in the noncontaminated area displayed lower lead levels in blood than in those in both contaminated areas, which had blood lead levels ≥10 or 20 µg/dL, the highest being in residents near the railroad station. Table 14 shows the age distribution of subjects with >10 and 20 µg/dL lead in blood in the above three areas of Antofagasta. Table 15 illustrates the association of geographic location of residence and blood levels in exposed locations. Further, the Sepúlveda et al. (2000) study demonstrated that the distance of dwellings from lead storage sites, their geographic location, and their antiquity were significantly associated with high blood levels, and that multivariate models disclosed that people living in contaminated sites (near storage places of the railroad or near the port) have odds ratios of 24.85 and 22.56, respectively, for blood lead levels ≥ 7 µg/dL. Carboncillo Beach, City of Antofagasta. In 1991 a heavy rain event occurred in the city of Antofagasta and its surroundings, which is unusual because of an extremely dry Table 14. Age distribution of subjects with more than 10 and 20 µg/dL lead in blood, in three areas of Antofagasta, 1998. Sample size Blood lead ≥10 µg/dL Blood lead ≥20 µg/dL Age (years) n n % of sample n % of sample <1 55 18 32.7 % 3 5.5 % 1 60 26 43.3 % 6 10 % 2 60 31 51.7 11 18.3 3 63 37 58.7 8 12.7 4 72 34 47.2 10 13.9 5 73 34 46.6 4 5.5 6 68 29 42.6 4 5.9 7 33 11 33.3 1 3.0 Total 484 220 45.5 % 47 9.7 % Source: Modified from Sepúlveda et al. (2000)
  • 27. A.N. Tchernitchin et al. Rev. Environ Contam Toxicol 185:93-139 © Springer 2005 119 Table 15. Geographic location of residence and blood lead levels in exposed locations, 1998 Lead levels in the blood Degree of exposure to lead Percent of population High 21.5 % Intermediate 10.1 % Lead ≥ 20 µg/dL Low 3.8 % High 63.6 % Intermediate 45.0 % Lead ≥ 10 µg/dL Low 37.5 % Source: Modified from Sepúlveda et al. (2000) climate with an average rainfall of 1.7 mm/yr (30 yr average). An alluvial flood of water crossed part of the city, carrying a large amount of soil, and swept off stored mineral concentrates from the storage site at the railroad station. This material was carried to the ocean, and presumably is the main source of lead contamination at Carboncillo Beach, one of the city’s beaches. The Regional Public Health Service of Antofagasta (2000) reported very high levels of lead in this location. In the beach intertidal sand it reached 2710 mg lead/kg; on the seafloor near the beach, at 2-5 m beneath the surface it reached 1930 mg lead/kg in sediments, and at 10-m depth it reached 1080 mg/kg in sediments, compared to reference sites in Antofagasta (23 to 61 mg/kg lead). We investigated a case of a family who moved to a house located 50 m from the Carboncillo Beach and had been living there for about 2 yr (1999-2001). All three members of the family presented severe neurological problems and irreversible brain damage assessed by single photon emission computed tomography (SPECT) for cerebral perfusion with Tc-99m HMPAO (hexamethyl propyleneamine oxime). The family moved to Santiago, and 6 mon after moving from Antofagasta received the diagnosis of lead exposure sequelae. Blood levels of lead 6 and 12 mon after leaving Antofagasta are shown in Table 16. In all three family members, SPECT for cerebral perfusion with Tc-99m HMPAO at 6 mon after leaving Antofagasta, revealed multifocal hypoperfusion of uneven distribution and several broad areas with hypoperfusion in the brain, and additionally bilateral Table 16. Changes in blood lead levels in family after moving from lead exposure source in Carboncillo Beach, Antofagasta. Family member Father Mother Son Age when leaving Antofagasta 38 years old 28 years old 2 years old Blood lead levels 6 mon later 34.6 µg/dL 36.9 µg/dL 32.2 µg/dL Blood lead levels 12 mon later 1.2 µg/dL 2.2 µg/dL 6.0 µg/dL
  • 28. A.N. Tchernitchin et al. Rev. Environ Contam Toxicol 185:93-139 © Springer 2005 120 anterior frontal increased perfusion hyperfrontality. One year after leaving Antofagasta, the hypoperfusion areas worsend as well as the hyperperfusion in the anterior frontal brain, which increased further in the father. The alterations progressed only slightly in the child and showed a moderate regression in the mother. In the father, neurocognitive testing revealed damage as an incomplete Wisconsin test at the 14th percentile. Electromyograms and nerve impulse conduction velocity measurements in the father revealed a distal polyneuropathy, predominantly sensitive, and a psychological examination revealed depression, psychoorganic damage mainly in short-term auditory and visual memory, and possible alteration of personality. In the child, the psychological analysis showed a diagnosis of aggressive behavior at 3 yr of age. These findings reveal that although lead blood levels decreased to low levels after 1 yr of living away from the exposure source, the neurological sequelae persisted and even worsened in two of the three family members. B. The Arica Case: Toxic Wastes from Sweden and Mineral Concentrates from Bolivia Arica is the most northern Chilean city and port, situated a few kilometers south of the Chilean border with Peru. There were two main sources of lead pollution: transport and storage of lead mineral concentrates from Bolivia and the “import” of toxic wastes from Europe. The first source of lead exposure in Arica was from powdered lead mineral concentrates, mainly lead sulfide containing about 26.5% lead Until recently, this mineral was transported through the city and openly stored near densely populated parts of the city, in open places near the railroad until 1993, and from then on at the port itself. The mineral comes by railroad from Bolivia. According to an old international treaty signed between both countries in 1904, Chile is obliged to allow free transit of Bolivian merchandise through Chilean territory to its ports until it can be exported by ship to other countries. According to available information, 340,000 t of concentrates are shipped every year through Chilean ports in Arica and Antofagasta. The storage areas were not protected against wind; therefore, an important amount of lead-containing particles was blown throughout the vicinity, where there are many homes, whose inhabitants are exposed to high levels of lead in air and soil. The second source of exposure was to “toxic raw material for industrial purposes” imported by Promel from the Swedish company Boliden Metal. This material turned out to be hazardous toxic wastes sent to Chile by Boliden Metal and deposited without any protection in the suburbs of Arica between 1983 and 1985 where, a few years later, new low-income dwellings were constructed and residents were exposed for more than 10 yr. Although the local health authorities (1983-1985) knew the exact composition of the toxic wastes, they allowed the entry of these wastes to Chile and informed that “the material is not toxic, anybody can manage it, it can not be ingested”. To the lead pollution just described there is an added adverse situation: Arica has an extremely arid climatic condition, Annual rainfall is about 0.5 mm/yr (30-yr avg) which
  • 29. A.N. Tchernitchin et al. Rev. Environ Contam Toxicol 185:93-139 © Springer 2005 121 prevents lead movement from the surface to lower soil layers or its removal by rain as occurs under different climatic conditions. The Colegio Médico Regional Arica (Arica Regional Medical Association) concluded that there was massive exposure to lead around 1997, based on signs and symptoms suggesting lead and arsenic toxicity in patients living in the vicinity of these toxic wastes. This was the origin of the Arica Study (1998 and 1999) performed by the Colegio Médico de Chile (National Chilean Medical Association) and associated researchers (A.N.T., N.L., and N.A.T.) reported below. This study also discovered a very important lead exposure source, the old lead mineral concentrate storage area that was not suspected previously, and it was included in the study. Lead Measurements in Blood, 1998 and 1999 We investigated blood levels in exposed and control children from Arica in two stages. The first was in 1998 in Poblacion Los Industriales and Cerro Chuño and in Villa Santa Maria. The second, which included a larger number of subjects, was in 1999 and included the same two areas from Arica and a third additional area, Pampa Nueva, which was used as a control area supposedly with low environmental lead levels. In both studies, blood samples were taken from these residents who accepted the procedure. Levels were measured by the electrochemical method (Leadcare). Additionally, in the second study a computational test to detect a delay in hand-motor response to three sensorial stimuli was applied, and samples of head hair were taken to measure lead content. Most children in the 1998 study were also included in the 1999 studies. Table 17 describes the general population investigated in two areas of Arica 1998 whose lead levels and other parameters were again investigated in 1999. One of the areas, Poblacion Los Industriales and Cerro Chuño had new low-income dwellings constructed near the disposal area where toxic wastes were stored by Boliden Metal and were still there during the study. Those investigated lived within 200 m of the waste location. The general population from the other area, Villa Santa Maria, was initially intended to be the control subjects, but displayed very high blood levels. It was found later that the Villa was composed of new houses built for a middle- or higher-income population near an old storage site for lead mineral concentrates from Bolivia. Possibly some of the houses were Table 17. Age distribution in the Arica 1998 lead study group, comprising residents living at two locations, whose blood lead levels were measured again in the 1999 study Age (years) Santa Maria Los Industriales and Cerro Chuño 5 2 6 6 1 9 7 4 12 8 2 5 Total 9 32
  • 30. A.N. Tchernitchin et al. Rev. Environ Contam Toxicol 185:93-139 © Springer 2005 122 Table 18. Changes in blood lead levels in the same children from 1998 to January 1999 Arica study groups in Santa Maria (S M) and Los Industriales and Cerro Chuño (L I & C C) Location Date n Mean Pb, µg/dL Percent ≥10 µg/dL Percent ≥20 µg/dL Percent ≥30 µg /dL S M 1998 9 21.8 100 67 11 S M Jan 99 9 20.1 89 44 11 L I & C C 1998 32 8.3 38 0 0 L I & C C Jan 99 32 8.4 31 1 1 constructed on the old storage site that never was cleaned up. Table 18 shows blood lead levels in 5 to less than 9 yr old living in both areas and compares the change of blood levels between the first and second measurements. The 1999 study comprised a larger number of exposed children than in the 1998 study, mainly from Poblacion Los Industriales and Cerro Chuño, and additionally a new area of Arica, Pampa Nueva, located far from lead sources, was incorporated into the study as a control area. Subjects from Poblacion Los Industriales and Cerro Chuño and those from Pampa Nueva belong to a low-income socioeconomic class, whereas residents from Villa Santa Maria are in the higher-income group with higher educational status. Figure 18 shows blood lead levels in children from these areas, distributed according to age. Blood levels in children from Villa Santa Maria were very high and displayed the highest values in yunger ages, but tended to decrease rapidly with age, which does not occur in children from Los Industriales and Cerro Chuño. Levels in children from Pampa Nueva were the lowest, except in one cluster of three subjects of 9 to <10 yr of age, who lived on the same street <100 m of each other. In the homes of two, there were some labor activities with lead. 0 5 10 15 20 25 30 5 6 7 8 9 10 - 11 Age (years) Meanleadconcenrationinblood(µg/dL) Santa Maria L Ind & C Chuño Pampa Nueva Fig. 18. Blood lead levels according to age in the Arica 1999 lead study universe, comprising children living at three different locations, whose head hair levels were measured
  • 31. A.N. Tchernitchin et al. Rev. Environ Contam Toxicol 185:93-139 © Springer 2005 123 Table 19. Blood lead levels in the group 5- to 8-yr-old children living in three areas of Arica, 1999. Santa Maria Los Industriales & Cerro Chuño Pampa Nueva N 12 116 13 Mean Pb µg/dL 18.1 8.5 5.8 SD 8.5 5.7 2.5 SD: standard deviation Considering this cluster of subjects with high blood levels, Tables 19 and 20 show blood levels in children 5 to <9 yr old distributed according to their residence area and the children’s distribution according to their blood levels. Tables 21 and 22 show the same results in all children in the study 5 to 11 yr old. In Tables 19 and 20, a clear difference is observed between levels from Villa Santa Maria, the highest levels, and Los Industriales and Cerro Chuño, and the controls residing in Pampa Nueva. Measurements of Head Hair Lead Concentration At the same time blood was taken from children in the three areas of Arica (1999), a sample of head hair was taken for lead measurement. Table 23 shows lead content in children 5 to <9 yr old, and Table 24 shows values in 5 to 11 yr old. The same differences described for lead in blood were observed in hair. Evaluation of Effects Associated with Lead Taking into consideration the effect of lead on central and peripheral nervous system, specially on easily measurable parameters, such as the decrease in the nerve impulse transport by myelin nerves, which was supposed to cause a delay in stimuli motor response, we designed a computer program (Silva et al. 1999) that allows the quantification of the delay between sensitive stimuli and a motor response to that stimuli. Three different kinds of stimuli were applied: (a) a simple visual stimulus such as a simple object suddenly visible on a computer screen, (b) a more-complex visual stimulus that requires brain processing to discriminate among Table 20. Distribution of children 5 to 8 yr old, according to blood lead levels in the groups from three areas of Arica, 1999. Level (µg/dL) Santa Maria Los Industriales & Cerro Chuño Pampa Nueva 0-9.9 2 81 12 10-19.9 6 31 1 20-29.9 3 1 0 30-39.9 1 3 0
  • 32. A.N. Tchernitchin et al. Rev. Environ Contam Toxicol 185:93-139 © Springer 2005 124 Table 21. Blood lead levels in the group of 5- to 11-yr-old children living in three areas of Arica, 1999. Santa Maria Los Industriales & Cerro Chuño Pampa Nueva N 21 170 21 Mean Pb µg/dL 16.1 8.7 7.2 SD 8.1 6.3 5.2 several visual images appearing on the computer screen, and (c) an auditory stimulus (acute sound) produced by the computer. Each kind of stimulus was applied several times each, to allow learning. Table 25 shows the delay in response to auditory stimulus in children of the same age with blood levels ≥10 µg/dL compared to children with <10 µg/dL. Results show that there is a delay in response to sensory stimulus starting at <10 µg/dL, at much lower levels than those causing a decrease in the velocity of nerve conductance through motor myelinated nerve. It is possible to speculate that in addition to a delay in motor nerve impulse transmission, lead additionally causes some delay in another site, at the central nervous system or at the synapse level. These possibilities deserve future studies to better understand the mechanisms of lead interaction with nerve cells at blood lead levels >10 µg/dL. Actions Taken The Colegio Médico de Chile informed the local and national health authorities about these results and further informed the local population through the press and through a health campaign. These activities of the Colegio Médico motivated implementation of several measures by the government to prevent or mitigate damage, summarized as follows: a. Removal of toxic wastes from the Los Industriales and Cerro Chuño area of Arica 2 km away to Quebrada Encantada in 1998-1999, an uninhabited creek, and covered these wastes with 50 cm soil protected by surrounding the site with a 2.20-m-high wall. Table 22. Distribution of 5- to 11-yr-old children according to their blood lead levels, in the groups from three areas of Arica, 1999. Level (µg/dL) Santa Maria Los Industriales & Cerro Chuño Pampa Nueva 0-9.9 5 121 17 10-19.9 10 41 3 20-29.9 5 3 1 30-39.9 1 5 0
  • 33. A.N. Tchernitchin et al. Rev. Environ Contam Toxicol 185:93-139 © Springer 2005 125 Table 23. Lead concentration in hair from 5- to 8-yr-old children samples living in three areas of Arica, 1999. Santa María Los Industriales & Cerro Chuño Pampa Nueva N 11 96 8 Mean Pb µg/g hair 52.5 18.3 16.1 SD 35.6 10.4 8.1 b. After waste was removed from the original site, it was covered with about 60 cm soil, partially paved, and surrounded with walls while waiting to completely pave that area c. Soil samples from streets and squares for lead measurements. d. Cleaning of houses and roofs in Los Industriales and Cerro Chuño. e. Decontamination of the railroad lead mineral storage area Chinchorro near Villa Santa María. f. Soil samples from the railroad storage site, surrounding area, and streets in the Villa Santa María. g. Cleaning of houses and roofs in Villa Santa Maria. h. Cleaning of the Arica Port lead mineral storage area, and construction of new storage areas to decrease lead contamination of surrounding area. i. Measurement of blood lead levels in exposed population. j. A protocol of actions and/or treatment of children according to blood lead levels, which consisted of family education, Fe supplementation in diet, calcium supplementation in diet, hemogram evaluations, new lead level controls in blood, investigation of home conditions that favored lead exposure, and therapeutic procedures, according to blood levels. Measurements of blood lead levels by the local Health Service of Arica. The local Health Service reported the evaluation of 155 individuals among children and adults living in Villa Santa María within the last semester of 1998 and 1999 (Servicio de Salud de Arica 2000). Blood was collected by digital puncture for lead measurement by the electrochemical method (Leadcare) or by venupuncture for measurement by atomic Table 24. Lead concentration in hair from 5- to 11-yr-old children living in three areas of Arica, 1999. Santa María Los Industriales & Cerro Chuño Pampa Nueva n 25 169 23 Mean Pb µg/g hair 55.7 18.7 20 SD 32.6 11.2 24.9
  • 34. A.N. Tchernitchin et al. Rev. Environ Contam Toxicol 185:93-139 © Springer 2005 126 Table 25. Delay in response to auditory stimulus in children with lead blood levels ≥10 µg/dL absorption spectroscopy at the Institute of Public Health (ISP) of the Ministry of Health. Results of blood levels ≥10µg/dL are shown in Table 26. The Local Health Service of Arica reported (Servicio Municipal de Salud Arica 2001; Servicio de Salud de Arica 2001) that it took 4990 blood samples from subjects from Los Industriales and Cerro Chuño, composed of 3240 children (65%) and 1750 adults (35%), for lead measurement. Results showed 4411 samples were <10 µg/dL and 579 ≥10 µg/dL. Of the “positive” 579 subjects, blood was collected from 538 (92%) and measured at the Public Health Institute (ISP) of the Ministry of Health of Chile. Results showed 131 subjects had ≥10 µg/dL and 407 <10 µg/dL; of 120 children (<15 yr old) and 11 adults. Data from the 120 children showing age distribution and blood levels are given in Table 27. Table 26. Subjects from sample population of Villa Santa María displaying high blood lead levels according evaluation by the Health Service of Arica in 1998-1999. Level (µg/dL) Electro chemical method (Leadcare) Atomic absorption spectroscopy, 1998 Atomic absorption Spectroscopy, 1999 Total subjects 10-19.9 32 51 15 20-29.9 3 16 4 30-39.9 0 2 1 Children under 9 yr of age 10-19.9 11 28 9 20-29.9 1 9 3 30-39.9 0 1 1 Source: Servicio de Salud de Arica (2000). Response (sec) in 8-yr-old children Response (sec) in 9-yr-old children Blood lead level (µg/dL) < 10 ≥ 10 Statistical differencea < 10 ≥ 10 Statistical differencea n 22 12 35 12 Mean 0.469 0.522 2p < 0.001 0.422 0.476 1p < 0.05 SD 0.075 0.088 0.029 0.070 SEM 0.016 0.025 0.005 0.020
  • 35. A.N. Tchernitchin et al. Rev. Environ Contam Toxicol 185:93-139 © Springer 2005 127 Table 27. Age and blood lead level distribution of children from Población Los Industriales and Cerro Chuño displaying blood lead blood ≥10 µg/dL, from a study of the Local Health Service during 2000. Age 10 to 14 µg/dL 15 to 19 µg/dL 20 to 34 µg/dL TOTAL < 2 yr 16 7 1 22 2-5 yr 48 12 3 63 6-9 yr 19 2 2 23 10-14 yr 7 3 2 12 Total 90 22 8 120 Source: Servicio Municipal de Salud Arica (2001); Servicio de Salud de Arica (2001). VII. Other Sources The most relevant sources of lead, affecting mainly the urban population, were leaded gasoline and high lead content in household paints. New regulations on these sources contributed to an overall decrease in exposure to lead in Chile. Lead originating from gasoline is still present at high levels in soil of large cities and from the vicinity of high- traffic highways. Dwellings painted before 1998 also constitute an important source of lead contamination. Other sources of lead in Chile are children’s toys and school implements, occupational exposure to lead, and lead contamination of food., Several industrial activities occur, mainly in cities. Many of them recover lead from car batteries and (some are licensed others are clandestine), and there are industries melting metals painted with leaded paints. There are many families working at these activities in their homes, such as recovering lead from batteries and making different objects with lead, and some working in stained glass, and welders, etc. Children’s Toys and School Implements Lead exposure may occur from children’s toys, pencils, and other school tools and implements, which children frequently take into their mouth. These items may be imported from countries without lead regulations. Occupational Exposure Occupational exposure frequently occurs in painters, welders, glass handicraft workers, and miners and smelting workers. Atmospheric lead may be originated from industries melting metals painted with leaded paints, affecting their workers and the population living in the vicinity. Food Contamination Food may be a source of various degrees of exposure to lead. The use of ceramics covered with low-quality leaded paint is not frequent in Chile; however, these ceramics can be imported from countries without regulations. Vegetables growing in or near highly populated areas and specially the metropolitan area of Santiago or near heavy traffic highways concentrate lead from soil, adding to the lead burden in humans. Lead may come from water flowing through lead pipes in old dwellings or copper pipes
  • 36. A.N. Tchernitchin et al. Rev. Environ Contam Toxicol 185:93-139 © Springer 2005 128 Table 28. Lead content in food products purchased in Santiago metropolitan area, 1995 Lettuce 0.3-56 µg/g dry wt (average, 12 µg/g) Carrots 4 µg/g dry wt Beans 4 µg/g dry wt Potatoes 1.6 µg/g dry wt Wheat products < 1 µg/g dry wt Canned evaporated milk 202 mg/L Fruits juice, packed > 100 mg/L Source: Díaz and García (2003) welded with lead. Food cans are not welded with lead welding anymore, but before 2000 most canned food was packed in lead-welded cans. Due to population ignorance, once opened, food sometimes was kept in these cans, leading to increasing concentrations of lead in food. The frequent marketing of bruised or accidentally deformed cans, in which the welded layer was affected, constituted an important source of lead in food. In packaged food, lead can also originate from the packing material, especially for various beverages such as milk or fruit juice. Few studies were performed in Chile on lead content in food. Table 28 shows data on lead in several food products, investigated at the University of Chile in 1995, and Table 29 shows lead levels in fish products measured at the University of Santiago (Díaz and García 2003). A study directed by one of us (A.N.T.) confirmed high lead levels in lettuce cultivated near a high-traffic highway (50 m) in the coastal zone of Central Chile (Briones and Vera 2002). Samples of lettuce were taken in that site 1 yr after the ban of leaded gasoline. These displayed a high concentration of lead (50-55 µg/g), suggesting that the pollutant from leaded gasoline accumulated in the soil and was absorbed by the plants through their roots. Recently, a study measured lead content in breakfasts and lunches given at a primary school in the VII Region (300 km south Santiago) within a governmental program of food assistance to economically deprived children (Bastías et al. 2004). Each breakfast Table 29. Lead content in fish species or food products purchased in Santiago metropolitan area. Merluccius gayi 0.72-0.94 µg/g wet wt Truchurus murpyi 1.16-1.41 µg/g wet wt Fish flour 0.46 µg/g dry wt Fish oil 0.13 µg/g dry wt Canned fish 0.57 µg/g dry wt Source: Díaz and García (2003)
  • 37. A.N. Tchernitchin et al. Rev. Environ Contam Toxicol 185:93-139 © Springer 2005 129 ration contained 1.3 µg/g lead and each lunch portion contained 0.6 µg/g lead, which totaled 714.1 µg lead/d. This contamination clearly exceeded the recommendation of the Mixed Expert Committee from the FAO/WHO experts on food additives (Comité Mixto FAO/OMS de Expertos en Aditivos Alimentarios 1999) of a maximum of 25 µg lead/kg body wt/wk. In Chile, regulations on lead in food (D 977/96 Ministry of Health Chile 1996; D 475/99 Ministry of Health, Chile 1999; D 238/2000 Ministry of Health, Chile 2000) are not precise and are also insufficient, revealing a disparity in legislative criteria (Bastías et al. 2004). There is no regulation forbidding the use of lead in food can welding; although it is assumed it is no longer done, there is no regulation to that effect. According to food sanitary regulations (D 977/96 Ministry of Health, Chile 1996; D 475/99 Ministry of Health, Chile 1999; D 238/2000 Ministry of Health, Chile 2000), metals in contact with food should contain less than 1% of the sum of the following elements (among others); lead, copper, chromium, antimony, tin, and/or iron. Metal cans with canned food contain higher amounts of at least one of these elements (Fe), and there are no controls to check whether dangerous elements are in higher amounts than those allowed by regulations. VIII.Lead in Soil Few studies were done to analyze lead content in soils of different Chilean regions. Most of these were done locally to ascertain soil levels within the areas influenced by different sources of pollution, mainly before actions intended to clean up these sites, or in places such as Arica or Antofagasta, where the effects of lead contamination on humans is evident. 0 50 100 150 200 250 Huasco Elqui Limari Aconcagua Puchumo Mapocho Maipo Cachapoal Tinguiririca Mataquito Maule VIIIRegion IXRegion XRegion XIRegion Place (vicinity of river) Leadinsoil(mg/kg) Minimum Mean Maximum Fig. 19. Lead content in soils under the influence of various Chilean rivers. (From CONAMA Chile 1994; González 1994.)
  • 38. A.N. Tchernitchin et al. Rev. Environ Contam Toxicol 185:93-139 © Springer 2005 130 Table 30. Lead concentration in soils located neara or farb from industrial pollution sources (copper smelters) in the V Region (north and north-west of Santiago). Agroecological unit Sector Cu (mg/kg) Pb (mg/kg) Zn (mg/kg) Aconcagua Catemu1 319 29 59 Aconcagua Nogales2, 3 135 8 28 Aconcagua The rest2 63 8 89 Puchuncavi Less than 3 km from smelter1 281 115 144 Puchuncavi More than 3 km from smelter2 38 40 110 c Nogales is located far from polluting source but was contaminated by a collapse of a reservoir containing mineral wastes. Source: González (1994) A study investigated lead concentration in soil in the vicinity of several rivers. In some, lead was considered to originate from natural sources, while in others, it is anthropogenic. Figure 19 shows lead content in these soils (CONAMA Chile 1994; González 1994). The profile shows that variation of values for each ecosystem is low. Within the agroecological unit of the Aconcagua Valley (100 km north of Santiago), it was found that variation of lead levels in soil, especially the mean levels and the absolute maximal values of lead, coincided with those of copper (results not shown), suggesting anthropogenic contamination with both metals. In the sectors of Puchuncaví (Puchumo) and Nos (Maipo valley), high lead concentrations were from anthropogenic sources, associated with industrial processes. Puchuncaví is in the area of copper smelter emission of large amounts of sulfur dioxide and arsenic, together with other heavy metals. A decrease in concentration of lead at lower valley locations may result from dilution of the valley river water by cleaner river affluent. Table 30 shows mean values of various heavy metals in soils (0-20 cm) at sites located near and far from contamination sources. Copper smelters are located in Catemu and Puchuncavi. Nogales suffered from a collapse of a reservoir dam containing mineral wastes. In some places, lead content in soil increases, presumably due to combination with other molecules present in soil and its precipitation as nonsoluble compounds. These studies concluded that in many places the total lead content results from natural origin but in others it may be anthropogenic. There was no relation, however, between increased lead content in soil and the existence of lead mineral zones such as the Maipo Valley and the XI Region, suggesting that these minerals do not naturally dissolve in water. IX.Recommendations Exposure to lead is known to affect various organs and systems in humans and in experimental animals. In adults, exposure to moderate lead levels can cause damage that
  • 39. A.N. Tchernitchin et al. Rev. Environ Contam Toxicol 185:93-139 © Springer 2005 131 can be reversed, at least in part, after decreasing lead levels in the blood and an additional recovery time. Exposure of children, and especially during the neonatal period of life and during fetal stages of intrauterine development, even at much lower lead concentrations, causes irreversible changes that persist through life. This is the basis for recommending extreme caution to avoid lead exposure of children, of babies during the early stages of their development, and of fetuses during the last months of intrauterine life. This is also the reason why norms and regulations for labor lead exposure levels or for maximal allowed lead concentrations in blood should be much lower for females than for males. Taking into consideration that the organism does not distinguish between lead and calcium, in a lead-exposed population lead will accumulate in bones together with calcium. In contrast to males, females become pregnant and obtain calcium for fetal needs from their own bone reserves, so that if lead content in her bones is elevated, the mother will withdraw calcium together with lead, which will affect the fetal tissues. Further, during breastfeeding, mothers draw additional calcium needed for the child’s growth, and if lead is accumulated in maternal bones, it will result in newborn exposure to this toxic element. Based on the these considerations, we recommend: (a) further changes in lead regulations, (b) formal educational programs, (c) informal educational campaigns through mass communication media, (d) high-level educational campaigns for the political sector, public administration, and the enterprise management sector, (e) administrative actions to decontaminate polluted areas, and (f) medical actions aimed mainly at detection and therapeutics, with special consideration of nutritional intervention and special care for pregnancy, early postnatal life, and childhood. In addition, we recommend international agreements regulating commerce of products dangerous to health, including lead. New Chilean regulations on lead content in air and paints are described above. Both are significant advances and are similar to those recommended by the World Health Organization (WHO) (lead in air) or in force in Europe (lead in air) or the U.S. (lead in paints). The limits of biological tolerance to lead were established in Chile in 1992 by Decree 745/92, art. 101, as 50 µg/dL lead in blood (D 745/92, Ministry of Health, Chile 1992). In 1999, stricter limits of biological tolerance were established by Decree 594, art. 113 (D 594/99, Ministry of Health, Chile 1999), decreasing tolerance for males to 40 µg/dL and for females to 30 µg/dL. These changes generated polemics at the political level and pressure from economically affected sectors to lessen regulations, and a new regulation established by Decree 201/2001, art. 17 (D 201/2001, Ministry of Health Chile, 2001) again changed the limits of biological tolerance, increasing it for females to 40 µg/dL and keeping the 40 µg/dL value for males. The Colegio Médico de Chile submitted a critical analysis with all scientific arguments to reverse that decree (Tchernitchin and Castro 2001), but no satisfactory results were obtained. We strongly recommend improving regulations on biological tolerance aimed fundamentally at the protection of children and women. We further recommend improving norms on lead content in drinking water and drawing regulations on lead content in food and in several products accessible to children. All these measures will be useless if these regulations are not accompanied with improved control measures and strict penalties for transgressions, both of which are deficient in Chile.
  • 40. A.N. Tchernitchin et al. Rev. Environ Contam Toxicol 185:93-139 © Springer 2005 132 Formal education programs on health and environmental effects of lead and other pollutants are important to change human behavior for prevention and mitigation. Recently programmed changes in education by the government mainly aimed at environmental protection but were not sufficiently strong on environmental toxicology and health effects. Informal educational campaigns have been done since 1996 by the Colegio Médico de Chile and were sufficiently effective in changing peoples attitude toward several pollutants, including lead. Recently, several nongovernmental organizations with participation of scientists or physicians also contributed to this purpose. During recent years, the Chilean Colegio Médico implemented a course on environmental changes and health effects for television, radio and press reporters who specialized on health and the environment. This course contributed to improving the quality and credibility of the articles they present in the media, helping to increase acceptance of the described environmental problems by citizens and also by politicians. The Colegio Médico de Chile sent technical information to several political parties and presented several lectures to transmit this knowledge to this sector. The Chilean Parliament, both the Lower Chamber (Chamber of Deputies) and the Higher Chamber (Chamber of Senators), usually requires information about lead or other pollutants from the Colegio Médico, and several presentations in extenso were also prepared for them. Our participations in the Commission of the Chamber of Deputies to investigate the effects of lead in Arica and propose a decontamination plan was a result of this campaign. This is a good example showing that scientists need to work together with politicians, legislators, and the educational sector to obtain results in lead decontamination as well as in other areas of environmental toxicology. Many administrative actions were undertaken by local or central Chilean authorities under the pressure of population awareness of the damage caused by lead, following the campaign designed by the Chilean Colegio Médico. Cleaning up of contaminated areas in Arica and Antofagasta, relocation of toxic wastes to a desert area near Arica, plans to transfer the port from which the lead mineral concentrates are shipped from Antofagasta to Mejillones and to declare the zone of Antofagasta as a National Catastrophe Zone to obtain funds to make these changes, all were these actions taken under the social and political pressure of the population who for the first time felt damaged by lead exposure. From this it can be concluded that changes favoring health of the population are done most efficiently and rapidly if there is pressure from the population, and that arguments are difficult to refute when based on scientific knowledge. Therefore, the best way to solve environmental or health problems is to communicate them to the entire population, providing valid and solid scientific arguments, and await population pressure on the responsible authorities. Medical actions need to focus mainly on the detection of lead exposure and to therapeutic procedures to treat or to prevent sequelae. It is necessary to take special consideration for those groups that are more vulnerable to lead effects or develop irreversible changes which persist through life: newborns or babies during their early postnatal life, children, and pregnant mothers, to avoid damage of their fetuses. Therefore
  • 41. A.N. Tchernitchin et al. Rev. Environ Contam Toxicol 185:93-139 © Springer 2005 133 it is necessary to develop methods for screening and detecting affected subjects with inexpensive methods, to avoid further exposure, to decrease blood lead levels, or to treat the effects. Prevention methods may involve changes in diet, especially calcium and iron supplementation and decrease in lipid ingestion. It is necessary to take into consideration the most conspicuous effects of lead exposure: decrease in intelligence coefficient and in attention and memory capacity, hyperactive behavior, aggressive behavior, and delinquent behavior in adolescence. Therefore, all schoolchildren with these characteristics in the contaminated areas (Arica, Antofagasta) should be investigated for blood lead content. It is highly recommended that mothers planning to get pregnant have their blood lead levels screened, so that they may be treated with pharmaceutical therapy (including chelation therapy) before the initiation of pregnancy. All pregnant women should measure their blood lead levels to decide a therapy with less risk for the child such as calcium or vitamin supplementation, besides the need to identify the lead source to avoid further exposure. After delivery, blood should be analyzed for lead level measurement in both mothers and newborns to decide on the convenience of breastfeeding or artificial feeding. All children from families with history of lead exposure should be screened periodically to prevent irreversible damage by lead. The hyperactive or aggressive behavior induced by early exposure to lead may be irreversible. This behavior risks the development of antisocial or delinquent behavior later in adolescence. We propose that this aggressive behavior can be sublimated, under psychological treatment, to other aggression-like activities, such as sports, dance, hobbies, or many other activities. Therefore, we recommend hiring psychologists at schools so that they can help children to sublimate this aggressive behavior and to channel it to socially positive behavior and avoid children transforming into a delinquent population. Finally, we recommend the implementation of international agreements regulating commerce of products containing components dangerous for health. Governments of different countries should agree to prohibit export of such products, those containing lead for instance, when their constituents are prohibited or regulated in the countries of their origin, because of ethical reasons even when there is no such regulation in the importing country. Summary Lead is a very toxic environmental pollutant that affects people living or working in contaminated areas or ingesting this element. Since the beginning of lead use, it has left evidence of lead poisoning with dramatic effects on the destiny of ancient civilizations. It was recently proposed that this toxicity can also contribute to the decline of current societies through lead-induced impairment of intelligence, increased tendency to abuse of drugs, psychological and behavioral changes, and increase in delinquent behavior. The effects of chronic exposure to lead in adolescents or adults may be reversed, at least in part, after a decrease in the blood lead levels. In contrast, in children, especially at earlier ages, the effects are irreversible, may persist through life, and some of them may
  • 42. A.N. Tchernitchin et al. Rev. Environ Contam Toxicol 185:93-139 © Springer 2005 134 be induced by the mechanism of imprinting. Exposure to lead during the perinatal period of life may occur in mothers previously exposed to the metal, presenting increased concentration of lead in bones; fetuses and newborns are most vulnerable to the toxic effects of lead because the damage persists throughout life. The various sources of lead exposure In Chile as well as the evolution of regulations and mitigation measures are reviewed. An important source of contamination with lead was the existence of paints with high lead content, used to paint house walls, children’s furniture, and toys, among other objects. The highest content of lead in paints was not in those bearing Chilean trademark names, but from a foreign trademark with formulas licensed to produce in Chile, although the same products in the country of origin (U.S.) did not present measurable lead levels. From 1997 on, new legislation regulated lead content in paints. Many houses, furniture, children’s toys, and other objects painted before 1997 are still an important source of exposure to lead, mainly for children. Formerly, the widest source of lead contamination in Chile was the use of leaded gasoline, mainly in greatly populated cities. There has been a progressive decrease in lead content in leaded gasoline, which was banned in April 2001. Lead pollution still persists in highly populated cities as city soil, home soil, and as soil contamination near highways. Clusters of different magnitude originated from point sources, of which the most relevant in magnitude was which occurred in Ñuble with the use of wheat flour contaminated with lead, caused by the use of a mill whose stone was repaired by lead welding. Several other clusters of smaller magnitude are frequently caused by the widespread practice of battery repair and recovery by small enterprises or as a familial productive activity, affecting all the family group and occasionally persons living in the vicinity. Two special cases of very important environmental contamination occurred, affecting the population of two major cities. The most dramatic case was the storage of powdered lead mineral concentrates at the ports or the railroad terminals within the cities of Arica and Antofagasta, where it usually remained until shipped to other countries. Lead from this source is the most relevant source of exposure in the cities of Arica and Antofagasta. Another source of lead, which affected the population of Arica, originated from toxic wastes imported by Promel from the Swedish company Boliden Metal, stored without protection in Arica suburbs, where a few years later new dwellings were constructed and residents were exposed for more than 10 years. Occupational exposure frequently occurs in painters, welders, and mining or smelting workers. Various degrees of food lead contamination may increase exposure to the metal. Vegetables grown in or near highly populated areas, lead pipes in old dwellings or copper pipes welded with lead, and formerly lead from canned food, especially those that had been accidentally deformed or were opened and the food stored in those cans. Little information exists on lead content in soil. There are sites where lead concentrations are increased from anthropogenic sources. In regions known to have abundant lead minerals, soil is not contaminated in the vicinity of rivers, suggesting that raw lead minerals do not dissolve in water and do not affect the soil.
  • 43. A.N. Tchernitchin et al. Rev. Environ Contam Toxicol 185:93-139 © Springer 2005 135 Acknowledgements Financed in part by funds from the Colegio Médico de Chile, the Arica study was financed in part by Fund of the Americas grant. Lead measurements in blood and in household paints by the Institute of Public Health ISP from the Chilean Ministry of Health are acknowledged. Technical help from Gladys Cisternas, Bernardita Araya, Dora Méndez and Leonardo Figueroa is appreciated. References Al-Hakkak ZS, Hamamy HA, Murad AMB, Hussain AF (1986) Chromosome aberrations in workers at a storage battery plant in Iraq. Mutat Res 171:53-60. Alonso P, Castro H, Davis ME, Goza J, Hargous J, Rivera L, Tassara E (1997) Intoxicación por plomo: estudio epidemiológico Ñuble, Chile 1996. EPI Visión, Ministerio de Salud, Chile 1997:10-15. Banks EC, Ferretti LE, Shucard DW (1997) Effects of low level lead exposure on cognitive function in children: a review of behavioral, neuropsychological and biological evidence. Neurotoxicology 18:237-282. Baker EL, Landrigan PJ, Barbour AG, Cox DH, Folland DS, Ligo RN, Throckmorton J (1979) Occupational lead poisoning in the United States: clinical and biochemical findings related to blood lead levels. Br J Ind Med 36:314-322. Bastías JM, Muñoz O, Moreno I, Rubilar C (2004) Evaluación del contenido de arsénico y plomo en raciones de desayuno y almuerzos entregados a escolares de la VII región, Chile. CD Abstracts XIII Latin American and Caribean Seminar on Food Science and Technology, Montevideo, Uruguay. Bornschein RL, Grote J, Mitchell T, Succop PA, Dietrich KN, Krafft KM, Hammond PB (1989) Effects of prenatal lead exposure on infant size at birth. In: Smith MA, Grant LD & Sors AI (eds) Lead Exposure and Child Development. An Internacional Assessment. Klower, Dordrecht, pp 307-319 Briones MJ, Vera PA (2002) Prospección y caracterización de los metales pesados en Chile, un caso particular: plomo en hortalizas cultivadas en la Provincia de San Antonio, V Región. Tesis, UTEM, Santiago Chile. Byers RK, Lord E (1943) Late effects of lead poisoning on mental development. Amer J Dis Child 66:471-494. Cardenas A, Roels H, Bernard AM, Barbon R, Buchet JP, Lauwerys RR, Rosello J, Ramis I, Mutti A, Franchini I, Fels LM, Stolte H, de Broe ME, Nuyts GD, Taylor SA, Price RG (1993) Markers of early renal changes induced by industrial pollutants. II. Application to workers exposed to lead. Br J Ind Med 50:28-36. Cisternas R, Sáez M (1980) Liberación de delta-ala en orina de niños: un indicador de contaminación por plomo en Santiago. Rev Chil Pediatr 51:13-18. Cohen N, Modai D, Golik A, Weissgarten J, Peller S, Katz A, Averbukh Z, Shaked U (1989) Increased concanavalin A-induced suppressor cell activity in humans with occupational lead exposure. environ Res 48:1-6. Comité Mixto FAO/OMS de Expertos en Aditivos Alimentarios (1999) Evaluación de ciertos aditivos alimentarios y contaminantes de alimentos. 53° Informe de JECFA. N°896. Ginebra.