Downloaded 683 times
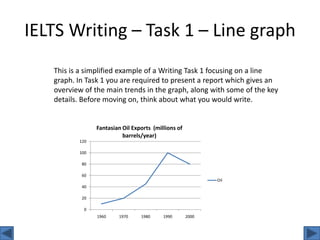
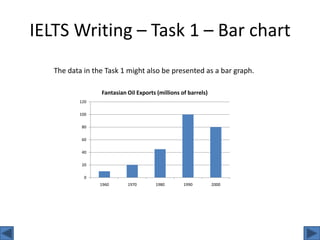

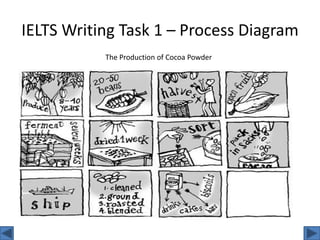


This document provides an overview of IELTS Writing Task 1. It explains that Task 1 requires a short report summarizing the key details and trends shown in a graph, chart or diagram. It offers examples of line graphs, bar charts and pie charts that may appear, as well as a process diagram. Useful language for describing changes over time, comparisons, and processes is also provided. The key points emphasize reading the question carefully, writing at least 150 words, paraphrasing the prompt, including an overview and organizing ideas logically.


