1. BORDER In other words there is a measurable
recession time. (Remember that when
STRIP IRRIGATION water is turned off in a furrow, it
SYSTEMS disappears from the furrow relatively
quickly.)
• Also, because more surface area is
Introduction...........................................3.8-1
wetted with border strips it doesn't
Advance-Recession Curves ..................3.8-2
take as long to soak in the same
Tailwater with Border Strips.................3.8-3
amount of water. You do not have to
Improving Border Strip DU ..................3.8-3
wait for water to sub across a bed or
Efficiency with Border Strips ...............3.8-4
into a dry furrow. Thus, sets are
Border Strip Evaluations and
usually shorter with border strips than
Recommendations ................................3.8-4
with furrows.
• Finally, with a wide strip and the
broadcast seeding that usually
INTRODUCTION accompanies their use, there is not a
problem with cross-row uniformity as
Border strips are run entirely differently than with furrows.
furrows. When water is turned off in a furrow
it is essentially gone from the furrow Example 1, Poor Uniformity
immediately. In a border strip, because of the
configuration and the crop friction, water
takes a long time to run off. Thus, water is
turned off in a border strip before it reaches
the end of a strip. Border strips can be the
most complex to manage as they are usually
efficient only for a very narrow range of
applications. If you know you will be
applying small, frequent irrigations, make the
strips shorter and narrower. See the following
link for information of selecting an irrigation
method (ftp://ftp-nhq.sc.egov.usda.gov/NHQ
/pub/outgoing/jbernard/CED-Directives/neh-
2of2/neh15/neh-15-03.pdf) from the NRCS
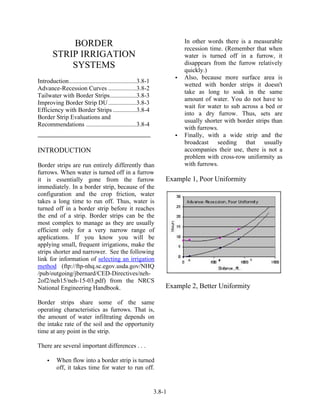
National Engineering Handbook. Example 2, Better Uniformity
Border strips share some of the same
operating characteristics as furrows. That is,
the amount of water infiltrating depends on
the intake rate of the soil and the opportunity
time at any point in the strip.
There are several important differences . . .
• When flow into a border strip is turned
off, it takes time for water to run off.
3.8-1
2. water was turned off eight hours after it was
turned on, when it was about 1000' down the
1100' strip. This recession curve shows that
water disappeared from the 600 foot mark
about 9 1/2 hours after the irrigation was
started.
Remember that recession is the rate at which
water disappears from the soil surface. In the
figure above, the distance 'A' between the
advance curve and the recession curve is how
long water was on the soil surface,
infiltrating. It is the OPPORTUNITY TIME.
ADVANCE-RECESSION CURVES
In Example 1 there was about 8 hours of
The important operational characteristic of opportunity time at the 100 foot mark
border strips is that they usually have (distance A). Water advanced to the 100 foot
measurable recession time. That is, when you mark in about 1/2 hour. It finally receded
turn water off in a border, it takes a from the 100 foot mark at about 8 1/2 hours
significant, measurable amount of time for into the irrigation. Thus, water was on the
water to run off the strip. surface at the 100 foot mark for about 8 hours
(8 1/2 recession - 1/2 advance). In contrast
A major reason for this is the obstruction of there was only five hours at the 900 foot mark
the crop in the strip. Water is held back by the (distance B). And only 3 hours at the end of
crop, both when it is advancing down the strip the strip (distance C).
and when it is running off. Another reason is
that the water in a strip is not confined as it is We've said before that good distribution
in a furrow and thus, doesn't build up as much uniformity with surface systems means
head (depth of flow). Because of this getting the opportunity times close together.
measurable recession we do not have to get In border strips we are saying we want the
the advance ratios as in furrows. Although set rate of recession to equal the rate of advance
times in border strips are generally shorter as much as possible. The previous figure is
than in furrows (because we are wetting more not very good DU. Example 2 depicts a much
soil and thus, soaking water into the field better irrigation.
faster), we normally turn the water off in a
border strip before it reaches the end. Note that there is 7 1/2 hours of opportunity
time at the 100 foot mark, 6 1/2 at 900 feet,
The impact of recession time is shown in and 5 1/2 at the end of the strip. Also, note
Example 1. It depicts the advance and that the advance curve and recession curve are
recession of water in a border strip during an close to parallel over much of the strip.
irrigation. The bottom, solid line is the
advance of water. This particular irrigation The improvement is due to speeding the water
got water to the 600 foot mark in about four advance. You can tell this by the difference in
hours (at 'B', note the intersection of 600 feet the Advance Curves. The curve in Example 2
on the horizontal line with 4 hours on the is flatter than that in Example 1 . Water
vertical). The upper, dashed line is the moved faster over the strip. Where water took
recession as water is turned off. Note that
3.8-2
3. 4 hours to reach 600 feet in the previous One important fact is that for any given slope,
irrigation, it only took about 2 1/2 hours in the strip width, soil, and crop, the recession curve
irrigation in Example 2 (at 'B'). will stay relatively constant, no matter what
the inflow or the time of set. Thus, evening up
How close you should try to make the the opportunity time may be a matter of
opportunity times in a border strip depends on increasing/decreasing the inflow.
the type of soil. As with furrows, the coarser
the soil, the closer the opportunity times need Border strips can be the most complex to
to be. manage as they are usually only efficient in a
narrow range of applied depths. If you know
TAILWATER WITH BORDER STRIPS you are going to be consistently applying
small depths, use shorter, narrower strips.
There should not be much tailwater generated And vice-versa for larger applications.
with border strip systems. Note the shaded
portion of the two previous figures. This area
represents tailwater (see how the Advance
Curve "goes beyond" the end of the strip,
point "C", indicating the start of runoff). If the
area between the Advance Curve and
Recession Curve past the end of the strip is
large, then the amount of tailwater generated
is large.
IMPROVING BORDER STRIP DU
Modifying border strip irrigation for
distribution uniformity can be done in a
number of ways, all related to evening the
opportunity time down the strip . . .
• Increase/decrease the flow into the
strip.
• Turn off the water sooner/later in the
strip.
• Make the strip wider/narrower
depending on side fall.
• Make the strip longer/shorter.
There is no benchmark recommendation for
border strips as there is with furrows--no
advance ratio that will change with soils. The
most valuable tool used in border strip
irrigations may be the soil probe . Use it after
an irrigation to judge how far water infiltrated
at the top, middle, and bottom of the strips.
3.8-3
4. EFFICIENCY WITH BORDER STRIPS Also, when determining NET APPLIED, the
saved runoff percentage, SAVED RO, should
You should do the same sort of preplanning be smaller than with a furrow system. And
that was described for furrows. The same again, you will have to react to the results of
equations can be used. the first set. Use a soil probe to judge the total
amount of water infiltrating as well as the
(1) GROSS APPLIED = amount infiltrating at the top, middle and
GPM x HOURS x 96.3 / AREA bottom of the strip.
where: BORDER STRIP EVALUATIONS
GROSS APPLIED is the inches of water AND RECOMMENDATIONS
applied to the AREA.
The major part of evaluating a border strip
GPM is the flow in gallons per minute per irrigation is to plot the advance and recession
strip. curves. The evaluator will mark off 100 foot
increments of the strip and time the advance
HOURS is the total set time in hours. of water. Then, after water is turned off, the
rate at which water disappears from the
AREA would be the width of the strip times surface down the strip will be plotted. These
the length of the strip. plots can indicate whether inflow should be
increased or decreased and also show where
The GROSS APPLIED is the amount of water there are high or low spots in the field. A soil
that was turned on to the strip. If tailwater is probe is used to see if enough water
allowed, subtract the percentage of GROSS infiltrated.
APPLIED you think you can recover in
surface runoff. That is, determine how much Border strips are usually only efficient in a
water that you apply will runoff the field and very narrow range of application depths.
be used. Then, subtract this from the depth When the crop needs fall in that range, the
applied. utilization of this irrigation system can be
very good. Operational flexibility is
Use the following equation . . . necessary to improve the performance of this
(2) NET APPLIED = type of system . The ability to efficiently deal
(1 - SAVED RO/100) x GROSS APPLIED with tailwater is key to improving flexibility.
Increasing set times to increase application
where: amounts will likely entail larger tailwater
NET APPLIED is the net average depth of streams. Increasing onflow streams to
water infiltrated in the furrow in inches improve advance times and distribution
uniformity will also likely entail the
SAVED RO is the percentage(0-100) of management of larger tailwater amounts.
GROSS APPLIED that you think will be
saved as surface runoff
GROSS APPLIED is the gross applied as
previously calculated. Further reading, FAO Irrigation Methods,
IWTM 5 (http://www.fao.org/docrep/S8684E
/s8684e00.htm).
3.8-4