SlideShare a Scribd company logo
1 of 56
Dell In-Depth Case Study Rubric
Level of Achievement
Criteria
Poor
0-20%
Fair
20-45%
Good
45-80%
Excellent
80-100%
Content
25 points
Most questions NOT addressed.
Elaboration and detail are not nominally evident. Information
is not clear and/or developed. Answers reflect little complexity
and critical thinking. Discussion is difficult to understand with
little clarity. Lacks meaning, applicability.
Some questions are addressed.
Some information relative to the topic but lacking elaboration
and detail. Answers reflect a basic understanding of the
material but no critical thinking or complexity is evident.
Discussion is understood but lacks some clarity. Lacks
relevancy, meaning, applicability and is somewhat difficult to
understand.
Most questions addressed.
Clear information relative to the topic but lacking elaboration
and detail. Answers reflect some complexity and critical
thinking is not fully developed. Discussion is understood but
lacks some clarity. Mostly relevant, meaningful, applicable and
can be understood.
All questions are addressed.
Elaborate and detailed information relative to the topic.
Critical thinking and insight evident in the complexity of
answers. Discussion is articulated in a clear manner.
Answers are relevant, meaningful, applicable and easily
understood.
Grammar
10 points
Several spelling, grammar or sentence structure errors. The
structure of the paper has many discrepancies to the
requirements of: clear paragraphs for each question, double
spacing, 12-point font, and 1-inch margins. Paper is
significantly short of four full pages.
Moderate number of spelling or grammar errors. The
requirements for the structure of the paper are lacking: clear
paragraphs for each question, double spacing, 12-point font, and
1-inch margins. Paper is somewhat short of four full pages.
A couple of spelling, grammar or sentence structure errors. The
structure of the paper mostly meets the requirements of: clear
paragraphs for each question, double spacing, 12-point font, and
1-inch margins. Paper is marginally short of four full pages.
No spelling, grammar or sentence structure errors. The
structure of the paper should have clear paragraphs for each
question. Four-page minimum, double spaced, 12-point font, 1-
inch margins.
Organization
10 points
Few or no answers are organized, easy to follow and logical.
Answers do not include supporting details and/or examples.
Some answers are organized, easy to follow and logical.
Answers do not include supporting details and/or examples.
Most answers are organized, easy to follow and logical.
Answers include some supporting details and/or examples.
All answers are organized, easy to follow and logical. Answers
include several supporting details and/or examples.
.
Bibliography
Citation
5 points
No required citations referenced on last page.
Few required citations referenced on last page.
Some sources referenced are appropriate and applicable to the
topic.
Most required citations clearly referenced on last page.
Most sources referenced are appropriate and applicable to the
topic.
All required citations clearly referenced on last page.
All sources referenced are appropriate and applicable to the
topic.
OLCU 613 Paper 1: Employee Engagement
Prepare 4 - 5 page paper that 1) identifies two (2) best practices
to effectively engage employees, 2)
compares the best practices to the actual practices of a specific
organization, 3) makes specific
recommendations for that organization, and 4) identifies two (2)
insights gained into employee
engagement including specific actions to enhance leader
effectiveness. Support your analysis with four
(4) scholarly sources three of which are journal articles.
Criteria Requirements
Clearly and concisely describes 2 best practices supported by
citations of expert theories and research. Defines all
key terms and comprehensively discusses why each practice is
effective.
Clearly and concisely compares and contrasts an actual
organization’s efforts to engage employees with 2 identified
best practices. Supports discussion with evidence such as
specific examples for each actual practice.
Accurately uses findings of comparing best and actual
organizational practices to make specific recommendations
that would strengthen employee engagement.
Clearly and concisely discusses 2 insights gained into
effectively engaging employees. Identifies specific actions to
enhance leadership effectiveness in engaging employees.
Uses 4 or more scholarly sources including 3 journal articles.
Accurately adheres to APA standards; reference page
and citations are correct. All sources listed in References are
cited in paper
Paper is logical and well-written; spelling, grammar and
punctuation are accurate. Paper is the required length of 4 –
5 pages of content, and includes a correctly prepared title page.
Inventory Decisions in Dell's Supply Chain
Author(s): Roman Kapuscinski, Rachel Q. Zhang, Paul
Carbonneau, Robert Moore and Bill
Reeves
Source: Interfaces, Vol. 34, No. 3 (May - Jun., 2004), pp. 191-
205
Published by: INFORMS
Stable URL: https://www.jstor.org/stable/25062900
Accessed: 13-02-2019 19:24 UTC
JSTOR is a not-for-profit service that helps scholars,
researchers, and students discover, use, and build upon a wide
range of content in a trusted digital archive. We use information
technology and tools to increase productivity and
facilitate new forms of scholarship. For more information about
JSTOR, please contact [email protected]
Your use of the JSTOR archive indicates your acceptance of the
Terms & Conditions of Use, available at
https://about.jstor.org/terms
INFORMS is collaborating with JSTOR to digitize, preserve and
extend access to Interfaces
This content downloaded from 141.217.20.120 on Wed, 13 Feb
2019 19:24:25 UTC
All use subject to https://about.jstor.org/terms
Interfaces infjIML
Vol. 34, No. 3, May-June 2004, pp. 191-205 DOI
i0.1287/inte.l030.0068
ISSN 0092-21021 eissn 1526-551X1041340310191 @ 2004
INFORMS
Inventory Decisions in Dell's Supply Chain
Roman Kapuscinski
University of Michigan Business School, Ann Arbor, Michigan
48109, [email protected]
Rachel Q. Zhang
Johnson Graduate School of Management, Cornell University,
Ithaca, New York 14853, [email protected]
Paul Carbonneau
McKinsey & Company, 3 Landmark Square, Stamford,
Connecticut 06901, [email protected]
Robert Moore, Bill Reeves
Dell Inc., Mail Stop 6363, Austin, Texas 78682
{[email protected], [email protected]}
The Tauber Manufacturing Institute (TMI) is a partnership
between the engineering and business schools at
the University of Michigan. In the summer of 1999, a TMI team
spent 14 weeks at Dell Inc. in Austin, Texas,
and developed an inventory model to identify inventory drivers
and quantify target levels for inventory in the
final stage of Dell's supply chain, the revolvers or supplier
logistics centers (SLC). With the information and
analysis provided by this model, Dell's regional materials
organizations could tactically manage revolver inven
tory while Dell's worldwide commodity management could
partner with suppliers in improvement projects to
identify inventory drivers and to reduce inventory. Dell also
initiated a pilot program for procurement of XDX
(a disguised name for one of the major components of personal
computers (PCs)) in the United States to insti
tutionalize the model and promote partnership with suppliers.
Based on the model predictions, Dell launched
e-commerce and manufacturing initiatives with its suppliers to
lower supply-chain-inventory costs by reducing
revolver inventory by 40 percent. This reduction would raise
the corresponding inventory turns by 67 percent.
Net Present Value (NPV) calculations for XDX alone suggest
$43 million in potential savings. To ensure project
longevity, Dell formed the supply-chain-optimization team and
charged it with incorporating the model into a
strategic redesign of Dell's business practices and supervising
improvement projects the model identified.
Key words: inventory, production: applications; industries:
computer, electronic.
History: This paper was refereed.
Dell and Our Project
Dell is the largest computer-systems company based
on estimates of global market share. It is also the
fastest growing of the major computer-systems com
panies competing in the business, education, gov
ernment, and consumer markets. Dell's product line
includes desktop computers, notebook computers,
network servers, workstations, and storage products.
Michael Dell founded the company based on the con
cept of bypassing retailers and selling personal com
puter systems directly to customers, thereby avoiding
the delays and costs of an additional stage in the
supply chain. Much of Dell's superior financial per
formance can be attributed to its successful imple
mentation of this direct-sales model.
While the computer industry has grown tremen
dously over the past decade, firms in this industry
face their own challenges. First, rapid changes in tech
nology make holding inventory a huge liability. Many
components lose 0.5 to 2.0 percent of their value per
week, and a supply chain packed with yesterday's
technology is nearly worthless. With its direct sales,
however, Dell carries very little inventory: the whole
organization concentrates on speeding components
and products through its supply chain. Dell delivers
new products to market faster than its competitors
and does not have to sell old products at a discount,
because it has none. Second, the traditional model of
vertical integration that the original equipment man
ufacturers (OEMs) follow to manufacture all of the
major components of their products has almost disap
peared in the computer industry. Research and devel
opment (R and D) costs are too high and technology
changes too rapid for one company to sustain lead
ership in every component of its product lines. Dell
has close-relationship agreements with its suppliers
that allow them to focus on their specific compo
nents. At the same time, Dell concentrates its research
on customer-focused, collaborative efforts to lever
age the collective R and D of its partners (Dell and
Magretta 1998), which includes cultivating its supply
chain competence.
Dell management was concerned that, although the
firm carried almost no inventory, its suppliers might
191
This content downloaded from 141.217.20.120 on Wed, 13 Feb
2019 19:24:25 UTC
All use subject to https://about.jstor.org/terms
Kapuscinski et al.: Inventory Decisions in Dell's Supply Chain
192 Interfaces 34(3), pp. 191-205, ?2004 INFORMS
be holding much more inventory than was needed to
provide desired customer service. For this reason, Dell
asked a team from the Tauber Manufacturing Institute
(TMI), a partnership between the engineering and
business schools at the University of Michigan, to
study this issue. Dell sought recommendations for
a sustainable process and decision-support tools for
determining optimal levels of component inventory
to support the final assembly process.
Dell bases its business model on integrating five
key strategies: rapid time to volume, products built
to order, elimination of reseller markups, superior
service and support, and low inventory and capital
investment. We designed our project and the resulting
tools to support Dell's low-inventory and low-capital
investment strategy and to extend its impact beyond
the plant floor into the preceding stage of its supply
chain. Tom Meredith, at the time chief financial offi
cer, said in the May 18,1999 earnings conference call:
"Customers see no advantage in a manufacturer low
ering inventory to six days if there are still 90 days in
the supply line." Our project was the first step taken
to combat the "90 days in the supply line."
Dell's Supply Chain
Dell's supply chain works as follows. After a cus
tomer places an order, either by phone or through the
Internet on www.dell.com, Dell processes the order
through financial evaluation (credit checking) and
configuration evaluations (checking the feasibility of
a specific technical configuration), which takes two
to three days, after which it sends the order to one
of its manufacturing plants in Austin, Texas. These
plants can build, test, and package the product in
about eight hours. The general rule for production
is first in, first out, and Dell typically plans to ship
all orders no later than five days after receipt. There
are, however, some exceptions. For example, Dell may
manipulate the schedule when there is a need to
replace defective units or when facing large customers
with specific service-level agreements (who have non
standard quoted manufacturing lead times) for their
orders.
In most cases, Dell has significantly less time to
respond to customers than it takes to transport com
ponents from its suppliers to its assembly plants.
Many of the suppliers are located in Southeast Asia
and their transportation times to Austin range from
seven days for air shipments to upwards of 30 days
by water and ground. To compensate for long lead
times and buffer against demand variability, Dell
requires its suppliers to keep inventory on hand
in the Austin revolvers (for "revolving" inventory).
Revolvers or supplier logistics centers (SLCs) are
small warehouses located within a few miles of Dell's
assembly plants. Each of the revolvers is shared
by several suppliers who pay rents for using their
revolver.
Dell does not own the inventory in its revolvers;
this inventory is owned by suppliers and charged to
Dell indirectly through component pricing. The cost
of maintaining inventory in the supply chain is, how
ever, eventually included in the final prices of the
computers. Therefore, any reduction in inventory ben
efits Dell's customers directly by reducing product
prices. Low inventories also lead to higher product
quality, because Dell detects any quality problems
more quickly than it would with high inventories.
Dell wishes to stay ahead of competitors who
adopt a direct-sales approach, and it must be able to
reduce supplier inventory to gain significant lever
age. Although arguably supply-chain costs include all
costs incurred from raw parts to final assembly, Dell
concentrates on Dell-specific inventory (that is, parts
designed to Dell's specifications or stored in Dell
specific locations, such as its revolvers and assembly
plants). Because assembly plants hold inventories for
only a few hours, Dell's primary target, and ours in
this project, was the inventory in revolvers.
Dell has a special vendor-managed-inventory
(VMI) arrangement with its suppliers: suppliers
decide how much inventory to order and when to
order while Dell sets target inventory levels and
records suppliers' deviations from the targets. Dell
heuristically chose an inventory target of 10 days
supply, and it uses a quarterly supplier scorecard to
evaluate how well each supplier does in maintaining
this target inventory in the revolver. Dell withdraws
inventory from the revolvers as needed, on average
every two hours. If the commodity is multisourced
(that is, parts from different suppliers are completely
interchangeable), Dell can withdraw (pull) those com
ponents from any subset of the suppliers. Dell often
withdraws components from one supplier for a few
days before switching to another. Suppliers decide
when to send their goods to their revolvers. In prac
tice, most suppliers deliver to their revolvers on aver
age three times a week.
To help suppliers make good ordering decisions,
Dell shares its forecasts with them once per month.
These forecasts are generated by Dell's line of busi
ness (LOB) marketing department. In addition to
product-specific trends, they obviously reflect the
seasonality in sales. For home systems, Christmas
is the top time of the year. Other high-demand
periods include the back-to-school season, the end
of the year when the government makes big pur
chases, and country-specific high seasons for foreign
purchases (foreign language keyboards are especially
influenced). Dell sales also increase at the ends of
quarters (referred to as the hockey stick).
This content downloaded from 141.217.20.120 on Wed, 13 Feb
2019 19:24:25 UTC
All use subject to https://about.jstor.org/terms
Kapuscinski et al.: Inventory Decisions in Dell's Supply Chain
Interfaces 34(3), pp. 191-205, ?2004 INFORMS 193
After the center of competence (COC) checks a fore
cast for predicted availability of components, the fore
cast goes to Dell's commodity teams and becomes the
basis for a six-month rolling forecast that they update
weekly. The commodity teams make generic forecasts
for systems and components and break those forecasts
down to a level of the specific parts that need to be
ordered. If the forecast is not feasible, the LOB mar
keting department revises it, although such revisions
are very rare. The buyer-planner for each commodity
receives an updated rolling forecast weekly; suppliers
receive forecasts monthly.
The objectives of our project were to recommend
target inventories for the revolvers to minimize
inventory-related costs subject to a service-level con
straint and to develop a process and tools for iden
tifying and updating target levels for inventories of
the items in the revolvers. (Suppliers who make the
replenishment decisions attempt to follow Dell's tar
gets and guidelines.) Dell had been setting inventory
targets based on empirical data and judgment with
no clear reference to any desired service levels. Dell
hypothesized that it could reduce revolver inventory
markedly by using a more rigorous approach and
gaining better visibility of the inventory throughout
the supply chain. Once it determined an optimized
inventory level, Dell could collaborate with its sup
pliers to eliminate excess inventory.
Dell emphasized that it wanted to sustain any
changes over the long term, which would require
integrating them into its informational infrastruc
ture. ValueChain is a program intended to extend
Dell's successful direct-sales approach back into the
supply chain with the goal of increasing the speed
and quality of the information flow between Dell
and its supply base. The corresponding Web site
valuechain.dell.com is an extranet for sharing such
information as points of contact, inventory in the sup
ply chain, supply and demand data, component qual
ity metrics, and new part transitions. Dell envisions
using this site to exchange with suppliers current
data, forecasted data, new product ideas, and other
dynamic information that might help it to optimize
the flow of information and materials in the supply
chain.
By integrating the process and associated tools
that we developed with valuechain.dell.com, we want
to make the tools part of Dell's and its suppliers'
procurement-business processes. Dell and its suppli
ers through ValueChain can share such information
as target inventory levels to support collaboration on
future improvements.
Our Approach
We concentrated on the last stage of Dell's supply
chain, the revolvers, where the inventories of all com
ponents are Dell specific. Dell believes that inventory
savings at this level will produce comparable supply
chain savings. Also, analysis of this stage is a neces
sary first step to further improve the whole supply
chain. We looked at the inventories of an important
component, XDX, in the revolvers themselves and in
transit to revolvers. XDX is one of the major compo
nents of PCs, supplied by a few suppliers, that is fully
interchangeable (customers do not choose the man
ufacturer of this component when ordering the final
product).
In our analysis, we made several simplifying
assumptions. Because the supply chain provides a
fairly high service level, simultaneous shortages of
multiple components are very infrequent, and thus,
we could ignore them without significantly altering
the results. Although Dell regularly updates its fore
casts of demand and hence its desired inventory lev
els, we assumed stationary demand and inventory
targets during a rolling forecast horizon of 10 busi
ness days. We realized that the behaviors of demand
and inventories at the beginning and the end of a
product's life cycle differ from those mid life cycle;
however, we handled them separately and do not
describe them here. (Kurawarwala and Matsuo 1996
describe ramp-on using the Bass 1969 model.) We
call the inventory in the revolvers the revolver inven
tory and the revolver inventory plus any inventory
ordered but not yet delivered the system inventory.
Although revolver inventory determines the availabil
ity of parts, Dell can control it only by placing new
orders (increasing the system inventory).
Currently, Dell's suppliers order in batches (to off
set fixed ordering costs incurred every time an order
is placed) when inventory levels drop. However, the
actual order (batch) sizes and points (levels) at which
the suppliers reorder are quite inconsistent. Our first
task was to develop a tool that would bring con
sistency to suppliers' ordering decisions. (Our esti
mates of the benefits do not include benefits from
eliminating existing inconsistencies.) We considered
using continuous-time, discrete-time (time buckets),
or fixed-time-period approaches. Because suppliers
and buyer-planners react to changes in conditions
as they occur, we used a continuous-time approach
and the corresponding optimal policy, a (Q, R) pol
icy. Also, we found that (Q,R) policies are far eas
ier for the managers at Dell to understand and use
than the (s, S) policies used in periodic settings. In
a (Q, R) policy, R denotes the reorder point and Q is
the size of the order (that is, we order a batch of
size Q whenever system inventory drops to R). Con
sequently, R + Q denotes the order-up-to level. We
also used the newsvendor ratio to heuristically find
the best reorder point, R. We focused on identifying
the optimal reorder point R for XDX and assumed
that the order size Q would remain at its current level.
This content downloaded from 141.217.20.120 on Wed, 13 Feb
2019 19:24:25 UTC
All use subject to https://about.jstor.org/terms
Kapuscinski et al.: Inventory Decisions in Dell's Supply Chain
194 Interfaces 34(3), pp. 191-205, ?2004 INFORMS
That is, based on long-term data, we estimated the
order size Q suppliers were using and assumed it
would not change.
The reorder point is closely related to safety stock,
which is the extra inventory held to buffer against
multiple sources of variability. Specifically, safety stock
is the difference between the reorder point and the
average requirements during replenishment lead time
(the latter is also called pipeline inventory). Assum
ing normal distributions of forecast error and of
replenishment lead time and independence of fore
cast errors, the safety stock level for (Q, R) policy is
given by Z * Jfi2a2--?m^j, and the reorder point is
the sum of the pipeline inventory and safety stock.
That is,
R = lil?if + zJfjL2f a2 + iLi<Tf, where
[if is the average of the daily forecasted demand
during replenishment lead time,
ay is the standard deviation of daily forecast error
during replenishment lead time,
?jl1 and <jx are the mean and standard deviation of
the replenishment time, and
Z is a score that links safety stock with required
service level. For a desired service level defined as the
probability that demand is met from stock, Z = <?>-1
(service level), where <?( ) is the cumulative standard
normal distribution.
Safety stock protects against variability of demand
during lead time. Here, we control safety stock
through the total system inventory (the inventory in
the revolvers and the inventory on order), as these
two differ only by a constant. We can approximate
the optimal safety stock using the newsvendor logic
(Nahmias 1997). According to this approximation,
the probability of satisfying all demand (or the ser
vice level) needs to be equal to the critical fractile
cu/(cu + c0), where cu is the cost of not being able
to satisfy one unit of demand (underage cost), and
c0 is the cost of maintaining an unused unit of inven
tory between consecutive ordering decisions (overage
cost). The critical fractile is thus the same as the ser
vice level that balances the costs of carrying one too
many items versus one too few items in inventory.
With 4>() being the cumulative standard normal dis
tribution, optimal Z = ^>~1(cu/(cu + c0)). To calculate
the optimal service level, we needed data to estimate
cu and c0.
After specifying the model, we decided how to esti
mate the input parameters (for example, demand data
and cost coefficients) and focused on the supply chain
for XDX. For all of the input parameters, we used his
torical data.
We developed a user-friendly spreadsheet tem
plate, the revolver inventory model, which allows a
buyer-planner to set target inventory levels and track
actual inventory levels daily. The spreadsheet uses
historical data to estimate demand. It also estimates
such parameters as the costs of underage and over
age, calculates the suggested policy, illustrates the his
torical behavior, and permits numerical and graphical
analyses of scenarios. The revolver inventory model
also serves as a strategic or diagnostic tool by relating
components of the total-required-inventory levels to
the various underlying causes. For example, we could
determine what portion of the required inventory is
due to variation in the forecast error. We collected his
torical data for XDX for each of the variables identi
fied by the model and performed our original analysis
for the period from December 1,1998 through May 27,
1999 (we included a methodology for daily updates).
In the final step in this portion of the project, we used
the analysis of the data and the model to identify
areas for improvement.
The Golf Analogy at Dell
While many people at Dell understand inventory
replenishment concepts, we found that they had no
knowledge of formal operations-management theo
ries. To explain these ideas, we used an analogy from
golf, employing terms from the sport to describe the
expressions and conditions commonly found in basic
inventory equations. A golf course provides many
physical obstacles, such as sand traps, water hazards,
and the long distances to the hole. All of these ele
ments are completely out of the control of the golfer,
and they must accommodate these perils through
out the game. Like water hazards and sand traps,
several factors can hinder a smooth delivery of com
ponents in a supply chain, such as road construc
tion or congested highways. The distance between
the tee and the hole is analogous to the distance
from suppliers to the OEM. In golf, each hole has a
standard, or par that the course designer sets based
on a variety of factors. This par will not change
unless the designers of the course return and make
fundamental alterations to the layout. The interest
ing thing about par is that it gives golfers a target
to strive for. They have constant feedback on how
they are doing, compared to a set standard. With no
variability in the system, the inventory necessary to
maintain steady production depends on only three
factors: demand, replenishment time, and shipping
frequency (or the size of shipments). We dubbed this
level of inventory as par, based on the notion that a
problem-free manufacturing environment should run
efficiently with a certain natural level of inventory
just as an average, problem-free golfer should achieve
an expected score on a course. We calculated the par
This content downloaded from 141.217.20.120 on Wed, 13 Feb
2019 19:24:25 UTC
All use subject to https://about.jstor.org/terms
Kapuscinski et al.: Inventory Decisions in Dell's Supply Chain
Interfaces 34(3), pp. 191-205, ?2004 INFORMS 195
level of inventory for several points in the supply
chain:
total system par
= forecasted demand for time period
* (replenishment time for the supplier
+ time between shipments/2).
The first part of the total system par is some
times called the pipeline inventory, that is, the aver
age inventory ordered but not yet delivered, while
the second part is the cycle inventory, inventory
due to batching. By Little's law, the average time
between orders is given by Q/fif (Nahmias 1997) for
given order quantity Q and forecasted average daily
demand during replenishment lead time fij.
Dell's Handicap
In golf, a handicap is a measure of a golfer's perfor
mance relative to an expected baseline, the par. As a
golfer improves over time, his or her handicap score
decreases. We used this term and found it very effec
tive to describe safety stock and the reasons why the
organization might carry extra material.
Safety stock insures against potential variations on
both Dell's side and the supplier's side of the sup
ply chain. To gauge improvements and to determine
causes of variation, we separated the sources of vari
ance. We referred to the safety stock required to cover
problems and variance within Dell's portion of the
supply chain as Dell's handicap, and we referred to
the remaining inventory needed to guard against the
supplier's failures to deliver quality goods consis
tently on time as the supplier's handicap. For the
project, Dell and its suppliers agreed to outline the
elements that would constitute the supplier's handi
cap. We planned to make the supplier's handicap part
of the supplier scorecard.
Important elements of Dell's handicap are forecast
error and pull variance. We use variance in the sta
tistical sense as the expected value of the square of
deviations from target values. Dell forecasts its need
for individual components in two stages. In the first
stage, it forecasts an aggregate number of final prod
ucts; in the second, it estimates the mix of compo
nents (corresponding to different features). An error
is associated with each of the two stages. The absolute
difference between the number of units actually sold
on the aggregate level and the number forecasted is
called the aggregate deviation. The difference between
the actual units and the forecasted units that incorpo
rate a specific component (feature) is another forecast
error, labeled the attach deviation. Both are absolute
differences, not fractions. Outside of the forecasting
process, a deviation also exists between what Dell
pulls out of the revolver daily and what the supplier
expected Dell would pull based on the production
schedule. This is the pull deviation.
While aggregate demand is generally predictable
and not a major contributor to the safety stock, the
attach rate varies noticeably. Customer preferences
change every day, sometimes drastically, despite
Dell's amplifying or reducing demand through sales
and price reductions or increases for various compo
nents. The attach deviation is the difference between
the expected demand for a component and the actual
number of components Dell uses, assuming that Dell
pulls at the predetermined percentage and has made
no aggregate-level error. For example, suppose that
Dell forecasts an aggregate demand for 4,000 units,
2,000 of which would have XDXs attached, represent
ing a 50 percent attach rate. If the actual demand
turns out to be 3,200 units, then the forecasted
demand at the aggregate level deviates from the
actual by 800 units. However, suppose that demand
perfectly matches the forecast of 4,000 (resulting in
an aggregate deviation of 0), but only 1,500 com
puters need an XDX. In this case, the actual attach
rate is only 37.5 percent and the attach deviation is
2,000 - 1,500 = 500. This attach deviation can be cal
culated for each supplier. If Suppliers A and B each
have 50 percent of Dell's business for this device, Dell
would plan to consume 1,000 of A's XDXs and 1,000
of B's XDXs. If the pulled quantities are proportional
to the allocated ratios (50 percent for each supplier),
then each would provide 750 units. In this case, the
attach deviation equals 1,000 ? 750 = 250 for each sup
plier. (The actual pull is 250 units less than the fore
casted pull of 1,000 units.)
Safety stock is driven by variances (in the square
root formula for safety stock), and therefore, we trans
late all of the deviations into corresponding variances.
Our objective is to examine the total variance and to
attribute it to specific causes. Because it is more dif
ficult to forecast on the component level than on the
aggregate level, we expect that the attach variance will
be greater than or equal to the aggregate-level vari
ance. By subtracting the aggregate-level variance from
the attach variance, we can estimate the incremen
tal contribution of attach rates to the variance, even
though these effects are obviously not independent.
If the commodity in question is multisourced, Dell
must further allocate the attach rate forecast to indi
vidual suppliers. Dell tends to pull material from
competing suppliers in batches, switching from one to
the other, rather than taking a fixed percentage from
each one. Thus, even without any aggregate-level
variance or attach variance, the suppliers' inventory
is different than forecasted. This is referred to as the
pull variance (Figure 1). Dell pulled different numbers
of units of XDX from two suppliers' revolvers. Dell's
This content downloaded from 141.217.20.120 on Wed, 13 Feb
2019 19:24:25 UTC
All use subject to https://about.jstor.org/terms
196
Kapuscinski et al.: Inventory Decisions in Dell's Supply Chain
Interfaces 34(3), pp. 191-205, ?2004 INFORMS
12/1 12/2 12/3 12/4 12/5 12/7 12/8 12/9 12/10 12/1112/12
12/14 12/15 12/16 12/17 12/18 12/19 12/21
I Supplier A M Supplier B Date
Figure 1: Dell pulled different numbers of units of XDX from
two suppliers' revolvers. Light bars and dark bars
correspond to quantities pulled by two different suppliers. The
arrows above the graph denote the range of days
during which Dell pulled predominately one supplier's goods.
Dell's pulling in batches of different sizes results
in a larger forecast error than would be the case if it used all
components in a fixed ratio (level schedule or
level pull).
pulling in batches of different sizes results in a larger
forecast error than would be the case if it used
all components in a fixed ratio (level schedule or
level pull). Even though the suppliers do not order
every day, they continuously monitor the inventory
levels and, therefore, the pull variance influences their
decisions.
We compute the pull variance using the same
underlying logic as the other two variances except
that it derives from the build-pull error instead of the
forecast-build error. So, if Dell expected to use 2,000
XDXs per day and it actually used 2,000, the aggre
gate and attach deviations would be zero. If each of
the two suppliers has 50 percent of the business, then
each would expect to supply 1,000 units during the
day. However, if Dell ignored the percentage of busi
ness and pulled all 2,000 units from Supplier A and
none from Supplier B, it would cause high levels of
forecast error (and confusion) for both suppliers. If,
on the other hand, Dell pulled according to the fore
casted business percentage for each supplier, it would
eliminate the pull deviations (and consequently vari
ance). The data clearly indicate that the variance from
Dell's pulls is greater than the variance in the attach
rate, which is greater than the aggregate variance,
thus leading to inflated inventories.
Using these three variances as inputs to the model
results in three different inventory requirements. Even
though interdependencies exist among these vari
ances, by calculating the differences between these
inventory requirements, Dell can estimate the cost of
error propagation from the aggregate level, through
the detailed component level, to the actual variance
of pulls from the revolvers (Figure 2). The inventory
Safety stock = Z * ?l?)o] + ?i<?
Figure 2: In this breakdown of Dell's handicap, the left side
shows the levels of inventory required due to the
accumulation of variance. The right side illustrates how we
associate the inventory with each of the underlying
causes. We interpret the incremental inventory as a result of
the three causes.
This content downloaded from 141.217.20.120 on Wed, 13 Feb
2019 19:24:25 UTC
All use subject to https://about.jstor.org/terms
Kapuscinski et al.: Inventory Decisions in Dell's Supply Chain
Interfaces 34(3), pp. 191-205, ?2004 INFORMS 197
Supplier's
handicap
Dell's
handicap
Replenishment time
Figure 3: We developed a total inventory breakdown assuming
the current
sources of inefficiency, and we call the inventory driven by
aggregate vari
ance, attach variance, and pull variance Dell's handicap.
driven by aggregate variance, attach variance, and
pull variance is called Dell's handicap (Figure 3). Our
next logical step was to attack this level of inventory
through various improvement initiatives.
Data Collection and Analysis
The model provides Dell with a scientific tool to
determine the revolver inventory levels and hence to
manage its supply chain in a systematic way. The
model can also create a reference point for future
improvements and estimate the savings Dell can
obtain by changing its current manufacturing sys
tem. Specifically, buyer-planners can use the model to
manage their inventory at a desired service level, and
commodity managers can use it to measure improve
ments in the supply chain. To implement the model,
we needed to gather historical data and create a self
contained, user-friendly spreadsheet template buyer
planners can use daily.
Data Collection
We collected data for the period from December 1,
1998 through May 27, 1999. Three companies (A, B,
and C) supplied XDXs to Dell during this period.
Supplier A supplied two different XDXs, Supplier B
and Supplier C each provided one part number but
many versions of that part. The parts supplied by A,
B, and C are labeled as XA1, XA2, XB, and XC.
We used two groups of data in our analysis: data
related to the economics of safety stock (mainly the
costs of underage and of overage) and data related
to historical estimates of the variance of lead-time
demand.
The Cost of Underage
We calculated the cost of underage by evaluating the
impact of not having an XDX in inventory. We did
not consider the costs of switching among suppliers
but instead concentrated on the cost of running out
of XDXs altogether. Consequently, we based lost mar
gins on cancelled orders and compensation for the
expedited shipping costs for delayed orders. The data
included estimates of
?the lost profit from a canceled order,
?increased shipping cost for not having a compo
nent when needed (the product is express shipped to
the customer or the shipping charges are reduced or
waived or both),
?the portion of customer orders that results in a
lost profit, and
?the fraction of orders that incur higher shipping
costs.
Several costs (for example, for substitution and for
air freight) are caused by part shortages, and they are
not easy to quantify; many have a greater impact on
profit than lost sales. We advised Dell to try to quan
tify all of these costs in the future. They include
?providing a better part at the same price as the
requested part,
?paying a penalty, for example, a percentage of the
price of the system for each day above the standard
lead time (as specified in some of Dell's contracts),
?making price concessions on future orders
because of noncompliance with stated lead times,
?losing sales opportunities with disappointed cus
tomers, and
?losing sales when sales representatives call cus
tomers to explain delinquent orders instead of calling
other customers to make new sales.
The Cost of Overage
In calculating the cost of overage, we recognize that
the effect of current ordering decisions is limited to
the time between consecutive deliveries of the compo
nent. During that time, capital is tied up, price erosion
occurs, and the revolver assesses a storage charge. We
considered the following data in determining the cost
of overage:
?We assumed that the supplier's annual cost of
capital was slightly higher than Dell's.
?We estimated price erosion based on empirical
data on price decreases for XDXs.
?We estimated that the average time between
deliveries was two days based on conversations with
sales representatives from all suppliers. Most said that
they order from their factories approximately three
times per week. Dell's need for the parts and suppli
ers' presumptions about the size of the order, and not
preset schedules, drive their ordering.
This content downloaded from 141.217.20.120 on Wed, 13 Feb
2019 19:24:25 UTC
All use subject to https://about.jstor.org/terms
Kapuscinski et al.: Inventory Decisions in Dell's Supply Chain
198 Interfaces 34(3), pp. 191-205, ?2004 INFORMS
Lead Time Demand Variance
We collected the following data for use in our histor
ical study of variance of lead-time demand for XDXs:
?Dell's daily pulls from the revolver for produc
tion but not other pulls (for replacement parts or for
quality issues), although they were still used to deter
mine the inventory level in the revolver,
?daily receipts of suppliers' components at the
revolver,
?daily quantities of in-transit inventory between
the suppliers and the revolver,
?daily sales or builds of systems needing XDXs,
?Dell's forecasts to its suppliers specifying the
quantity of each supplier's XDX that Dell expects to
use during the next month, and
?the suppliers lead times for XDXs obtained
from the suppliers' representatives in Austin (includ
ing day stamps indicating when parts became
Dell-specific), transport times, and the amount of
Dell-specific finished-goods inventory suppliers held
at their manufacturing and configuration sites.
We could not calculate the standard deviation of
supplier lead times with the data collected; we esti
mated it based on anecdotal evidence. Also, in many
cases, suppliers made deliveries of more than one
batch, which meant that average lead time could be
an inappropriate variable. Because the purpose of
safety stock is to reduce the risk of running out of
inventory, we used the lead time for the first batch as
an estimate of the relevant variable.
Other Parameters
We collected the data to derive values for other
needed parameters.
?We calculated the daily quantity of inventory in
the system (the system inventory) by adding inven
tory in the revolver to that in transit for each part
number on each production day.
?We calculated the forecast error for demand dur
ing lead time by directly collecting data on the quan
tity analyzed. That is, we considered buckets of time
equal to the lead time and calculated the forecast error
for each bucket by summing the forecasted demand
for all days in the bucket and subtracting Dell' actual
pulls over the same period. Then, we calculated a
standard deviation of these errors. To express the
error as a portion of average demand, we divided
the result by the average of the forecasts for the next
10 days, a number we believed was appropriate after
observing some real data.
?We calculated the days of inventory Dell held
(a measure common at Dell) by dividing a given day's
inventory level by the average of the forecasts for the
next 10 days. In addition to expressing a given day's
inventory in terms of inventory days, we also calcu
late the average inventory in units.
?To assess Dell's method of making ordering deci
sion, we translated the system inventory levels just
before orders into corresponding Z-scores. That is, we
used the system inventory to solve for the Z-score
for each lead-time bucket and then converted the
Z-score into the corresponding service level, using the
standard normal distribution. The resulting quantity
described the imputed service level.
?We determined the optimal XDX inventory lev
els, in transit and system inventory levels, for the
aggregate and for individual suppliers that should
have been carried. These values were calculated using
the following formulas:
average in-transit inventory = ^??x^, and
average system inventory = R + Q/2 = (/x? + L/2)fif
~^~Zo"DfLT,
where Q is the order size, L is the average time
between shipments received at the revolver, (rDfLT =
JfjAaf +/??aj is the standard deviation of demand
during the lead time, and R = ?n^f + ZaD LT is the
reorder point.
?We calculated the optimal number of days of
XDX that Dell should have held by dividing each
day's optimal inventory by the average of the fore
casts for the next 10 days. We calculated these figures
for each part number for each date included in the
study. (We wanted to compare the optimal number of
days with the actual number of days of inventory in
the system.)
Data Analysis
Although interested in the inventory savings, Dell's
management wanted to be very cautious and to over
estimate, rather than underestimate, inventory needs
to avoid damaging customer service due to unavail
ability of components.
Although our model can handle all the factors listed
below, we initially ignored some factors that would
have reduced inventory needs even further. First, Dell
assembles most of its products two or three days after
receiving an order. To be conservative, we ignored
this extra lead time. We can easily incorporate its
effects by reducing suppliers' delivery times to the
revolvers. Second, Dell wanted to run the model at
its current average service levels for each component
before making any further changes. Third, pooling
might provide benefits because three firms were sup
plying interchangeable parts. For all three suppliers
combined, to achieve a 98 percent service level, each
would need to achieve a much lower service level
(about 70 to 75 percent if they were of comparable
sizes). Before exploiting the benefits of pooling, Dell
wanted to eliminate the current operational disadvan
tages caused by clumpy pulls. Also, we ignored ramp
up and ramp-down effects.
This content downloaded from 141.217.20.120 on Wed, 13 Feb
2019 19:24:25 UTC
All use subject to https://about.jstor.org/terms
Kapuscinski et al.: Inventory Decisions in Dell's Supply Chain
Interfaces 34(3), pp. 191-205, ?2004 INFORMS 199
Part number System Z-score System service level (%)
Aggregate 2.26 98.80
XA1(A) 1.50 93.27
XA2(A) 1.51 93.49
XB(B) 1.25 89.35
XC(C) 0.93 82.42
Table 1: In this table of historical average system service
levels (as of
May 27,1999), the parts supplied by A, B, and C are labeled as
XA1, XA2,
XB, and XC.
Given these simplifications and Dell's require
ments, we started by investigating the historical ser
vice levels and then the forecast error.
Service Level
The aggregated imputed historical service level of
98.80 percent was surprisingly close to the optimal
service level of 98.66 percent provided by the model
(Table 1). Individual products, however, had signif
icantly different average service levels, and actual
service levels (and the corresponding Z-scores) var
ied significantly over the course of the study (Fig
ure 4). Inventory theory would suggest a fairly stable
level of service. If demand were stationary, both the
reorder point and the inventory order-up-to levels
would be constant. Even when demand forecasts vary
from period to period, because the costs of underage
and overage are very stable, the expected service level
and the corresponding Z-score, where Z = 4>_1(cM/
(cu + c0)), should remain constant (unless there are
substantial nonstationarities). We therefore expressed
the inventory levels just before orders were placed
as Z-scores. Our results show major swings of the
Z-scores, which indicates that Dell's suppliers do not
follow a (Q, R) policy. We understood that they used
ad hoc techniques, and we were not able to capture
them formally. We suspect that these swings were
caused by suppliers overreacting to current situations
and possibly by long-term trends. (We performed the
same analysis for inventory order-up-to levels, which
should also remain stable, yet they were equally
volatile.) While individual orders varied widely dur
ing the study period, the average service level for
all three suppliers combined was very close to the
optimal.
Our estimates of the average historical service level
are very close to the estimates of optimal service lev
els, and thus the average service level should remain
at the current level. However, because in the past
inventories shifted erratically and Dell had no consis
tent policy, it should be able to reduce average inven
tory by following a consistent policy.
Forecast Error
We gathered information on historical forecasts for
XDX and the actual Dell pulls and compared the two
for each of the replenishment periods. Forecast error
is a critical input in determining the optimal inven
tory level. In our model, we assumed the errors to
be random. However, it was apparent (and confirmed
by formal analysis) that at the commodity level the
errors are not independent from period to period. The
error showed strong linear trends (Figure 5).
The strong error trends could arise from several
factors, including forecasting. Like many companies,
Dell passes forecasts through various internal organi
zations before disseminating them to suppliers. While
innocently acting with the company's best interest
in mind, each group used its own judgment and
biases to modify the forecasts of demand. Such iter
ative hedges and adjustments can erode the qual
ity of the original information. Dell's supply-chain
7 -
6
5 (fi
(D
8 4
CO
*3
2
1
0
%
20 40 60 80
Time
100 120 140
Figure 4: In this graph of Z-scores for system inventory
associated with historical service levels over the course
of the study, each point corresponds to a placed order.
This content downloaded from 141.217.20.120 on Wed, 13 Feb
2019 19:24:25 UTC
All use subject to https://about.jstor.org/terms
200
Kapuscinski et al.: Inventory Decisions in Dell's Supply Chain
Interfaces 34(3), pp. 191-205, ?2004 INFORMS
O
c
2.50
2.00
1.50
1.00
? 0.50 c
O
CO
CO
?
0.00
-0.50
-1.00
-1.50
-2.00
-2.50
/ v.* ~?
-"V
r
11/21 12/11 12/31 1/20 2/9 3/1 3/21 4/10 4/30 5/20 6/9
Figure 5: The forecast error for XDX over the course of study
showed strong linear trends.
optimization team has targeted these forecasts for
process improvement. Despite this concern, we used
the forecast data to estimate inventory levels. We exer
cised extra caution, however, and to reduce potential
inaccuracy, we dealt with the lack of independence
heuristically (as described in the data analysis sec
tion). In this way, we believe that we did not compro
mise the results from the model, even though the lack
of independence reduced the accuracy of the model's
recommendations.
In graphing forecast error for XA2, we observed
strong cyclic behavior (Figure 6). This can be
attributed to the frequency and format of the data
Dell provides to the suppliers. The information is pro
vided weekly in monthly buckets. Suppliers generally
divide these aggregate monthly figures evenly into
four weekly buckets but do not divide it further by
days of the week. Sometimes they may even consider
the forecast for two weeks as demand needed in one
day (the first day of the two weeks). As a result, the
forecast for cumulative demand becomes a step func
tion, while it actually grows linearly.
Several other factors (most related to human errors)
can contribute to forecast inaccuracies beyond nor
mally expected levels. Ultimately, these forecast errors
could prompt Dell to investigate its forecasting pro
cedures and possibly adopt a more quantitative
approach.
Results Analysis
After analyzing the data required for the model, we
created an Excel-based tool for the buyer-planners.
This spreadsheet-based tool was self-contained and
included an overview of an input area, actual cal
culations, suggested decisions, and explanations of
the logic for each step. To provide detailed infor
mation on each component, we created a series of
charts dynamically linked to source data. These charts
depicted
?current inventory versus recommended inven
tory in units,
?current days of inventory versus recommended
days of inventory (the above output translated into
days),
/ * * #
*
11/21 12/11 12/31 1/20 2/9 3/1 3/21 4/10 4/30 5/20 6/9
Figure 6: The forecast error for XA2 over the course of study
showed a difference between actual orders and
forecasted values before Christmas in December of 1998.
This content downloaded from 141.217.20.120 on Wed, 13 Feb
2019 19:24:25 UTC
All use subject to https://about.jstor.org/terms
Kapuscinski et al.: Inventory Decisions in Dell's Supply Chain
Interfaces 34(3), pp. 191-205, ?2004 INFORMS 201
?current service level compared to the recom
mended level,
?inventory drivers, that is, inventory units broken
down into causes (such as aggregate error, attach rate
error, and pull error), and
?inventory percentage drivers, that is, inven
tory units broken down into causes and listed as
percentages.
Data at this moment must be manually (copy and
paste) entered, but Dell is independently proceeding
with automating this link.
Service Levels
After developing a format for the data and determin
ing the historical service levels, we examined what
the model's recommendations would have been for
the past six months. Because the levels of service
for individual products were significantly different
from those the model would have recommended, Dell
and the TMI team agreed to implement the model.
The implementation, however, would be split into
two stages. In stage 1, historical service levels would
be imposed and used as an input to the model; in
stage 2, service levels for individual products would
be adjusted in accordance with the model's recom
mendations. Not surprisingly, in stage 1, the model's
outputs were close to the average historical levels
(Table 2).
Optimal vs. Actual Inventory Levels
While the order-up-to levels that we calculated using
the model remained fairly stable over time, the actual
Average historical Average level
level suggested by the model
Part number Units Days Units Days
Aggregate 81,606 11.0 77,643 10.7
XA1(A) 32,351 11.2 24,625 8.4
XA2(A) 26,625 22.1 27,147 23.7
XB(B) 21,111 9.8 18,186 8.2
XC(C) 44,109 9.6 43,414 9.3
Table 2: The historical average inventory levels were fairly
close to aver
age inventory levels suggested by the model as of May
27,1999.
system inventory levels fluctuated widely (Figure 7).
The average system inventory levels were close to
those suggested by the model, but the actual num
ber of units in the system at any time differed drasti
cally from the number required. For example, around
February 1, 1999, the model showed that the sys
tem should have held nine to 11 days of inventory
to handle expected fluctuations in demand and sup
ply. However, the actual number in the system was
close to 18 days of inventory. The extra seven days of
inventory in the revolver were costly for the supplier.
Likewise, in the beginning of March, Dell was carry
ing five to seven days worth of inventory, while the
model showed that eight to 10 days were required.
This means Dell was at a much higher risk of stock
ing out during that period. Clearly Dell should avoid
such huge fluctuations. The systematic ordering pol
icy we proposed will eliminate most of them and
make Dell aware of the remaining ones.
10 t
Actual Inventory
Order-up-to Level
- Average Recommended Inventory
Reorder Point
12/01/98 01/20/99 03/11/99 04/30/99
Figure 7: Although on average actual XC inventory was close
to the average recommended by the model, the indi
vidual observations indicate that most of the time the actuals
differed from the recommended levels significantly.
This content downloaded from 141.217.20.120 on Wed, 13 Feb
2019 19:24:25 UTC
All use subject to https://about.jstor.org/terms
Kapuscinski et al.: Inventory Decisions in Dell's Supply Chain
202 Interfaces 34(3), pp. 191-205, ?2004 INFORMS
These two examples illustrate the potential bene
fits of a management tool like the proposed inventory
model that can quantify the inventory needed in the
system at any time. Dell's buyer-planners who mon
itor the inventory levels should communicate with
suppliers and require inventory levels based on the
model's recommendations to prevent Dell from risk
ing a stock-out or paying for unnecessary inventory.
Inventory Percentage Drivers
One of the important features of the model is its
ability to categorize causes of required inventory. We
analyzed the historical data for XDX and found that
attach variance and pull variance each contributed
20 to 25 percent to the total inventory. After hearing
several suppliers complain about the clumpy pull, we
expected the pull variance to be nonnegligible. The
attach variance shows that Dell's forecasts at the com
modity level leave room for further refinement (Fig
ure 8). We broke down the drivers for inventory based
on the following assumptions:
?The supplier handicap was one day based on the
procurement team's experience with supplier delay,
?the replenishment time variance was (one day)2,
and
?the aggregate variance we assumed to be zero
because no data were available. (Should the data
become available, they would not change the aggre
gate level of inventory recommended but would alter
the breakdown percentages.)
Around 15 percent of the total inventory is associ
ated with par. If there were no variance in the entire
manufacturing system, Dell would need only 15 per
cent of the inventory it needed at the time of our study.
Granted, problems and fluctuations will always exist,
but this lower bound shows that Dell has tremendous
Supplier
Handicap (Days)
Pull (or Supplier
Part) Variance
(Days)
Attach (or
Component)
Variance (Days)
Replenishment
Time Variance
(Days)
Par (Days)
Figure 8: This breakdown of total inventory shows the
inventory
associated with the drivers of inventory (based on historical
data).
room for inventory reductions if it can implement and
sustain the recommended improvements.
Days of Inventory vs. Units of Inventory
Dell and its suppliers describe inventory levels in
terms of days of supply. Days of supply is a much
more stable measure than units of inventory. As long
as target service levels remain unchanged over a
given period and demand does not change dramat
ically, days of inventory will not vary significantly.
(When the coefficient of variation is constant, days
of inventory should remain constant.) However, the
actual units of inventory may change over time as
demand changes (Figures 9 and 10). The compo
nent has a recommended inventory level of close to
60 days for nearly the entire product life span, yet
the actual reorder points fluctuate widely. In particu
lar, there is a dramatic drop in recommended days of
inventory in early January 1999. Although the recom
mended days of inventory decrease, the units recom
mended do not because the average demand per day
is rapidly increasing (Figure 10). The day calculation
is an average of 10 future days' forecasts; in this case,
the forecasts were increasing rapidly. Furthermore,
two more factors amplify the level of fluctuation: the
historical service level of 99 percent and the tremen
dous supplier pull variance. This example shows why
it is important for the buyer-planners to manage
inventory in terms of both units and days. The combi
nation of the two charts will allow better understand
ing and improved decisions, which should translate
into decreased costs for Dell and its suppliers. While
we believe that days of inventory will remain the pri
mary tool for deciding how much to order, buyer
planners can use graphs of units of inventory to
see whether the requirements for a given part are
stable or changing. They can interpret any difference
between the targeted number of days and the actual
number of days of inventory into monetary exposure
from holding too much or too little inventory.
Our model does not capture ramp-up and ramp
down scenarios. XA2 was in its ramp-down phase
between late March and early April of 1999, after
which Dell ceased using the product. Looking at both
graphs of units of inventory and days of inventory,
however, one can easily recognize such ramp-down
and ramp-up periods.
Our results highlight the degree of error in the fore
casts suppliers were using and should encourage Dell
to investigate why the error was higher than expected
(for example, Dell may not have informed the sup
pliers promptly of changes or Dell may have delayed
a product launch because of a quality problem). This
should spark Dell's immediate action to correct data
frequently and improve its business process.
Furthermore, the high inventory level should
encourage Dell to reconsider the optimal service level
This content downloaded from 141.217.20.120 on Wed, 13 Feb
2019 19:24:25 UTC
All use subject to https://about.jstor.org/terms
Kapuscinski et al.: Inventory Decisions in Dell's Supply Chain
Interfaces 34(3), pp. 191-205, ?2004 INFORMS 203
Order-up-to Level
Average Recommended Inventory
Reorder Point
-Actual Inventory
12/01/98 01/20/99 03/11/99 04/30/99
Figure 9: The XA2 component has a recommended inventory
level close to 60 days, but the actual reorder points
fluctuate widely. The recommended days of inventory
decreased at the end of December and beginning of January
because the forecasts were growing rapidly.
120,000
100,000 4
80,000 4
60,000
40,000 4
20,000
Order-up-to Level
Average Recommended Inventory
Reorder Point
Actual Inventory
12/01/98 01/20/99 03/11/99 04/30/99
Figure 10: The recommended units of XA2 inventory increase
in January due to increased demand.
This content downloaded from 141.217.20.120 on Wed, 13 Feb
2019 19:24:25 UTC
All use subject to https://about.jstor.org/terms
Kapuscinski et al.: Inventory Decisions in Dell's Supply Chain
204 Interfaces 34(3), pp. 191-205, ?2004 INFORMS
for a supplier. Dell specified that it wanted to main
tain the existing service levels initially. A service level
of 99 percent is extremely high and most likely exces
sive given the data we collected. For this compo
nent, Dell could operate with a lower level of supplier
service.
Trial Implementation and Impact
After we analyzed the data and developed the tools,
we moved to initial implementation. We conducted
several tutorials, during which we discussed the the
ory behind the model and the specific instructions for
using the tools (in Excel format).
The goal of the tutorials varied depending on the
group targeted. For instance, in training the buyer
planners of XDXs, we focused on using the tactical
tool (to set inventory levels and track them); whereas
in training the supply-chain-optimization team, we
stressed the theory behind the model and the drivers
of inventory levels (so that they could conduct
improvement projects and quantify their impact). In a
tutorial for all of the XDX suppliers, we concentrated
on Dell's efforts to reduce the inventories it required
them to hold and asked them to help Dell to collect
the data needed to run the model.
We also assessed the improvement projects we
identified earlier. Other supply-chain-optimization
team members were identified as leaders for these
projects, and we roughly quantified the effects some
of the improvement projects will have on Dell and its
suppliers.
Finally, we discussed our project with teams for
commodities other than XDX with the idea of find
ing commodities most appropriate for analysis with
our model and validating the model's assumptions
for other commodities.
The vocabulary we introduced in our project per
sists at Dell, particularly par and handicap. Dell
has started other projects to eliminate elements of
its handicap. It has defined sources of variability
and linked various variance-increasing and variance
decreasing actions to costs and benefits. On a tactical
level, our project led to Dell's implementing tools to
identify optimal inventory levels.
We analyzed a number of scenarios to estimate
the financial impact of various improvement projects.
Using the model to extrapolate savings across all
XDXs, we calculated the cost savings Dell could
achieve by reducing inventory. We used inventory
drivers and the corresponding breakdown of inven
tory costs to estimate the reductions in inventory that
could be achieved through various improvements.
Eliminating the clumpy pull, reducing the replen
ishment time by 25 percent, doubling the delivery
frequency, and reducing the attach-rate error through
scheduling methods would all help to decrease
inventory. Using specific estimates (for price erosion,
storage charges, and costs of parts), we estimated
that Dell could reduce the current 10.5 days average
inventory level by 38 percent. By removing approxi
mately four days of safety-stock inventory, Dell could
achieve perpetual savings for all XDXs that will pass
through the revolver in the future. The resulting NPV
of savings is $43 million, at an eight percent cost of
capital. While the actual implementation for XDX is
still under way, Dell has used the model to set tar
get inventory levels for networking accessories at the
revolvers. So far Dell has decreased inventories for
its PowerConnect line of business from 20 days to
between 10 and 15 days, which is close to the target
of 10 days recommended by the model, and it expects
estimated annual savings of $2.7 million.
These benefits are likely lower than the true savings
possible as they ignore the facts that Dell does not
implement the current inventory policy consistently
(the Z-scores are not stable) and does not set service
levels correctly, basing them on historical service lev
els. Consequently, we expect actual savings to be even
higher than our estimates.
Throughout the project, we concentrated on a basic
solution and showed its use as not only a tactical, but
also a diagnostic tool. If such a tool yields savings
for a fairly sophisticated manufacturer like Dell Inc.,
most likely it would also benefit other companies with
similar supply-chain issues.
We presented the model to all the stakeholders
and prepared the buyer-planners to use it before we
departed. Also, the project was awarded the second
prize at the Spotlight (a formal festive presentation of
results from all TMI projects) held at the University
of Michigan in September 1999. A second TMI team
continued the project, focusing on decreasing variance
on the suppliers' side, and a third team focused on
an efficient process for collecting and maintaining the
inputs to the model.
References
Bass, F. M. 1969. A new product growth for model consumer
durables. Management Sei. 15(5) 215-227.
Dell, M., J. Magretta. 1998. The power of virtual integration:
An
interview with Dell Computer's Michael Dell. Harvard Bus.
Rev.
76(2) 72-84.
Kurawarwala, A. A., H. Matsuo. 1996. Forecasting and inven
tory management of short life-cycle products. Oper. Res. 44(1)
131-150.
Nahmias, S. 1997. Production and Operations Analysis, 3rd ed.
Irwin,
Boston, MA.
Dick Hunter, Vice President, Americas Manufac
turing Operations, Dell Inc., One Dell Way, Round
Rock, Texas 78682-2244, writes: "Thank you for the
This content downloaded from 141.217.20.120 on Wed, 13 Feb
2019 19:24:25 UTC
All use subject to https://about.jstor.org/terms
Kapuscinski et al.: Inventory Decisions in Dell's Supply Chain
Interfaces 34(3), pp. 191-205, ?2004 INFORMS 205
opportunity to describe the benefits that Dell Com
puter Corporation has experienced by implementing
the Inventory Analysis model in our supply chain. A
team of University of Michigan Tauber Manufactur
ing Institute students and professors developed this
model with us in 1999. This model and corresponding
logic changed our thinking by directing us to focus on
the drivers of variation in our supply chain as a key
method to reduce inventory and improve velocity.
"Understanding the variation drivers quantified in
this model, we have taken action to change how we
pull inventory from supplier logistics centers into our
factories. As a result, our suppliers see a more linear,
predictable pull of product. For Dell, this means that
supply continuity becomes more robust as suppliers
are better able to handle unforecasted upsides.
"Supplier logistics center inventory levels have not
been reduced so far; rather we have increased our
service level to our factories and customers. Dell's
ability to deliver quality systems to our customers has
increased since inventory previously in place to han
dle pull-variation is now able to extend our imple
mentation time for quality improvements. Similarly,
exogenous factors such as overseas natural disasters
are less likely to impact the velocity with which we
deliver our systems.
"A systematic reduction of inventory using this
model requires an integrated solution with a signif
icant I/T investment. Dell is working towards that
direction based on the model algorithms to minimize
channel inventory and reap the benefits of increased
service levels through reduced variation."
This content downloaded from 141.217.20.120 on Wed, 13 Feb
2019 19:24:25 UTC
All use subject to https://about.jstor.org/terms
Contents191192193194195196197198199200201202203204205I
ssue Table of ContentsInterfaces, Vol. 34, No. 3 (May - Jun.,
2004), pp. 171-244Front MatterMetrics for Managing Online
Procurement Auctions [pp. 171-179]Allocating Vendor Risks in
the Hanford Waste Cleanup [pp. 180-190]Inventory Decisions in
Dell's Supply Chain [pp. 191-205]Practice Abstracts [pp. 206-
207]Schlumberger Optimizes Receiver Location for Automated
Meter Reading [pp. 208-214]The Slab-Design Problem in the
Steel Industry [pp. 215-225]Decision Rules for the Academy
Awards versus Those for Elections [pp. 226-234]Book
ReviewsReview: untitled [pp. 235-236]Review: untitled [pp.
236-237]Review: untitled [pp. 237-238]Review: untitled [pp.
238-239]Review: untitled [pp. 239-240]Books Received for
Review [pp. 240-241]Back Matter
Reproduced with permission of the copyright owner. Further
reproduction prohibited without permission.
Dell's Supply Chain DNA
Fugate, Brian S;Mentzer, John T
Supply Chain Management Review; Oct 2004; 8, 7; Business
Premium Collection
pg. 20
Reproduced with permission of the copyright owner. Further
reproduction prohibited without permission.
Reproduced with permission of the copyright owner. Further
reproduction prohibited without permission.
Reproduced with permission of the copyright owner. Further
reproduction prohibited without permission.
Reproduced with permission of the copyright owner. Further
reproduction prohibited without permission.
MGT 542 Individual In-Depth Case Study
Undergraduate Requirement
50 Points per Weekly Submission
1) Read the two identified Dell articles and answer all the
questions listed below. You can find the articles in the content
tab in Blackboard titled “Course Reserves”.
2) Each question should be answered with a minimum of one
paragraph. A paragraph is a minimum of 3 complete sentences.
3) A minimum of 4 pages per submission of written content is
required. Some sections will require more pages to fulfill the
requirements of the rubric and the in-depth case study
instructions listed here.
4) APA format is required.
5) A minimum of 2 additional sources per submission are
required to be cited.
6) A bibliography with all citations, including the given
articles, is required.
7) There will be four in-depth case study submissions. Please
reference the course schedule in the syllabus for the required
dates of each submission.
SECTION 1 - 50 Points
Kapuscinski, R., Zhang, R.Q., Carbonneau, P., Moore, R., &
Reeves, B. (2004). Inventory Decisions in Dell’s Supply Chain,
Interfaces 34(3), 191-205.
1. Describe the Supply Chain Business Model used by Dell.
2. How does Dell Supply Chain benefit from low inventory
levels?
3. What does Dell do to help their suppliers make optimum
ordering decisions?
4. Describe Dell’s relationship with their suppliers.
5. Describe the revolver inventory model.
6. Describe the purpose of the golf analogy as it relates to
inventory concepts. Include the analogy for the handicap
(Dell’s and the Supplier’s).
7. What is the purpose of safety stock and how is it controlled?
SECTION 2 – 50 Points
Kapuscinski, R., Zhang, R.Q., Carbonneau, P., Moore, R., &
Reeves, B. (2004). Inventory Decisions in Dell’s Supply
Chain, Interfaces 34(3), 191-205.
8. Describe the impact of the pull variance if a commodity is
multi-sourced.
a. Explain how an uneven pull from different suppliers of the
same commodity effect the suppliers’ inventory levels,
planning, and forecasting.
9. The balancing act: Discuss the cost of underage and overage
as it relates to inventory
10. The article references “Z scores” as the system inventory
levels just before orders are placed to understand Dell’s method
of making ordering decisions. Explain the logic of why there
was significant volatility found of the “Z scores”.
11. Forecast errors are an input in determining the optimal
inventory levels. In Dell’s case, it was found the forecast errors
at the commodity level were not independent from time period
to time period. Why was this the case and what could be done
differently to minimize forecast error?
12. Explain the impact of the actual system inventory level
fluctuations. What are the benefits and risks. Should high
fluctuations be avoided?
13. Discuss describing inventory levels in terms of “days of
supply” vs. “units of inventory”. What would you recommend
and why?
14. Is 100% service level an ideal recommendation? Why or
why not? How does this impact inventory levels?
Section 3 – 50 Points
Fugate, B.S., Mentzer, J.T. (2004). Dell’s Supply Chain DNA,
Supply Chain Management Review; October 20-24.
1. What are the four qualities of Dell’s supply chain
competency?
2. Describe the concept of each one individually.
3. Discuss the Business Process Improvement that shifted Dell
from brand-specific assembly plants to generic factories. Why
was this successful?
Section 4 – 50 Points
Final Questions
1. What advice would you have for Dell’s Supply Chain
business model? What would you do differently? Why?
2. What are the main challenges in front of Dell in reducing
inventory while maintaining their Direct Sales model?
3. What inventory reduction improvement initiatives would you
recommend?
4. What would you recommend that Dell try differently to
further optimize their supply chain?
2

More Related Content

Similar to Dell In-Depth Case Study RubricLevel of AchievementCri.docx

Searching Databases.docx
Searching Databases.docxSearching Databases.docx
Searching Databases.docxwrite4
 
IntroductionThis is an individual project. Each student must comp.docx
IntroductionThis is an individual project.  Each student must comp.docxIntroductionThis is an individual project.  Each student must comp.docx
IntroductionThis is an individual project. Each student must comp.docxmariuse18nolet
 
Using the READ Scale To Track the Difficulty of Electronic Resource Access Is...
Using the READ Scale To Track the Difficulty of Electronic Resource Access Is...Using the READ Scale To Track the Difficulty of Electronic Resource Access Is...
Using the READ Scale To Track the Difficulty of Electronic Resource Access Is...Margaret Heller
 
DBA CAPSTONE TEMPLATEThe pages in this template are correctl.docx
DBA CAPSTONE TEMPLATEThe pages in this template are correctl.docxDBA CAPSTONE TEMPLATEThe pages in this template are correctl.docx
DBA CAPSTONE TEMPLATEThe pages in this template are correctl.docxedwardmarivel
 
IntroductionThis is an individual project. Each student must comp.docx
IntroductionThis is an individual project.  Each student must comp.docxIntroductionThis is an individual project.  Each student must comp.docx
IntroductionThis is an individual project. Each student must comp.docxnormanibarber20063
 
Cause and Eect Final Draft RubricPlease note Any student
Cause and Eect Final Draft RubricPlease note Any studentCause and Eect Final Draft RubricPlease note Any student
Cause and Eect Final Draft RubricPlease note Any studentMaximaSheffield592
 
Managing data in the cloud can be a very difficult task. It is made .docx
Managing data in the cloud can be a very difficult task. It is made .docxManaging data in the cloud can be a very difficult task. It is made .docx
Managing data in the cloud can be a very difficult task. It is made .docxlashandaotley
 
Open Quick LinksQuick LinksPage LandmarksContent OutlineKe.docx
Open Quick LinksQuick LinksPage LandmarksContent OutlineKe.docxOpen Quick LinksQuick LinksPage LandmarksContent OutlineKe.docx
Open Quick LinksQuick LinksPage LandmarksContent OutlineKe.docxvannagoforth
 
n this assignment, you will demonstrate your mastery of the followin.docx
n this assignment, you will demonstrate your mastery of the followin.docxn this assignment, you will demonstrate your mastery of the followin.docx
n this assignment, you will demonstrate your mastery of the followin.docxveachflossie
 
Ciphered Numeration System on Lattice MultiplicationA. Wri.docx
Ciphered Numeration System on Lattice MultiplicationA. Wri.docxCiphered Numeration System on Lattice MultiplicationA. Wri.docx
Ciphered Numeration System on Lattice MultiplicationA. Wri.docxchristinemaritza
 
These are topics we have worked in residency week in group project
These are topics we have worked in residency week in group projectThese are topics we have worked in residency week in group project
These are topics we have worked in residency week in group projectchestnutkaitlyn
 
These are topics we have worked in residency week in group project.docx
These are topics we have worked in residency week in group project.docxThese are topics we have worked in residency week in group project.docx
These are topics we have worked in residency week in group project.docxrandymartin91030
 
ITS 632 Module Four Practical Connection Assignment Guidelin.docx
ITS 632 Module Four Practical Connection Assignment Guidelin.docxITS 632 Module Four Practical Connection Assignment Guidelin.docx
ITS 632 Module Four Practical Connection Assignment Guidelin.docxvrickens
 

Similar to Dell In-Depth Case Study RubricLevel of AchievementCri.docx (14)

Searching Databases.docx
Searching Databases.docxSearching Databases.docx
Searching Databases.docx
 
IntroductionThis is an individual project. Each student must comp.docx
IntroductionThis is an individual project.  Each student must comp.docxIntroductionThis is an individual project.  Each student must comp.docx
IntroductionThis is an individual project. Each student must comp.docx
 
Using the READ Scale To Track the Difficulty of Electronic Resource Access Is...
Using the READ Scale To Track the Difficulty of Electronic Resource Access Is...Using the READ Scale To Track the Difficulty of Electronic Resource Access Is...
Using the READ Scale To Track the Difficulty of Electronic Resource Access Is...
 
DBA CAPSTONE TEMPLATEThe pages in this template are correctl.docx
DBA CAPSTONE TEMPLATEThe pages in this template are correctl.docxDBA CAPSTONE TEMPLATEThe pages in this template are correctl.docx
DBA CAPSTONE TEMPLATEThe pages in this template are correctl.docx
 
IntroductionThis is an individual project. Each student must comp.docx
IntroductionThis is an individual project.  Each student must comp.docxIntroductionThis is an individual project.  Each student must comp.docx
IntroductionThis is an individual project. Each student must comp.docx
 
Cause and Eect Final Draft RubricPlease note Any student
Cause and Eect Final Draft RubricPlease note Any studentCause and Eect Final Draft RubricPlease note Any student
Cause and Eect Final Draft RubricPlease note Any student
 
Managing data in the cloud can be a very difficult task. It is made .docx
Managing data in the cloud can be a very difficult task. It is made .docxManaging data in the cloud can be a very difficult task. It is made .docx
Managing data in the cloud can be a very difficult task. It is made .docx
 
Open Quick LinksQuick LinksPage LandmarksContent OutlineKe.docx
Open Quick LinksQuick LinksPage LandmarksContent OutlineKe.docxOpen Quick LinksQuick LinksPage LandmarksContent OutlineKe.docx
Open Quick LinksQuick LinksPage LandmarksContent OutlineKe.docx
 
n this assignment, you will demonstrate your mastery of the followin.docx
n this assignment, you will demonstrate your mastery of the followin.docxn this assignment, you will demonstrate your mastery of the followin.docx
n this assignment, you will demonstrate your mastery of the followin.docx
 
Ciphered Numeration System on Lattice MultiplicationA. Wri.docx
Ciphered Numeration System on Lattice MultiplicationA. Wri.docxCiphered Numeration System on Lattice MultiplicationA. Wri.docx
Ciphered Numeration System on Lattice MultiplicationA. Wri.docx
 
Editing Sample
Editing SampleEditing Sample
Editing Sample
 
These are topics we have worked in residency week in group project
These are topics we have worked in residency week in group projectThese are topics we have worked in residency week in group project
These are topics we have worked in residency week in group project
 
These are topics we have worked in residency week in group project.docx
These are topics we have worked in residency week in group project.docxThese are topics we have worked in residency week in group project.docx
These are topics we have worked in residency week in group project.docx
 
ITS 632 Module Four Practical Connection Assignment Guidelin.docx
ITS 632 Module Four Practical Connection Assignment Guidelin.docxITS 632 Module Four Practical Connection Assignment Guidelin.docx
ITS 632 Module Four Practical Connection Assignment Guidelin.docx
 

More from cuddietheresa

1. A corporations distribution of additional shares of its own s.docx
1.  A corporations distribution of additional shares of its own s.docx1.  A corporations distribution of additional shares of its own s.docx
1. A corporations distribution of additional shares of its own s.docxcuddietheresa
 
1. Like the modernists, postmodern writers focused on subjective e.docx
1.   Like the modernists, postmodern writers focused on subjective e.docx1.   Like the modernists, postmodern writers focused on subjective e.docx
1. Like the modernists, postmodern writers focused on subjective e.docxcuddietheresa
 
1. As the degree of freedom increase indefinitely, the t distribu.docx
1.  As the degree of freedom increase indefinitely, the t distribu.docx1.  As the degree of freedom increase indefinitely, the t distribu.docx
1. As the degree of freedom increase indefinitely, the t distribu.docxcuddietheresa
 
1-Explain how the topography of the United states can affect the wea.docx
1-Explain how the topography of the United states can affect the wea.docx1-Explain how the topography of the United states can affect the wea.docx
1-Explain how the topography of the United states can affect the wea.docxcuddietheresa
 
1. An exporter faced with exposure to a depreciating currency can.docx
1.  An exporter faced with exposure to a depreciating currency can.docx1.  An exporter faced with exposure to a depreciating currency can.docx
1. An exporter faced with exposure to a depreciating currency can.docxcuddietheresa
 
1. According to the central limit theorem, a population which is .docx
1.  According to the central limit theorem, a population which is .docx1.  According to the central limit theorem, a population which is .docx
1. According to the central limit theorem, a population which is .docxcuddietheresa
 
1. Which of the following is not a class of essential nutrient.docx
1.     Which of the following is not a class of essential nutrient.docx1.     Which of the following is not a class of essential nutrient.docx
1. Which of the following is not a class of essential nutrient.docxcuddietheresa
 
1. The process by which one group takes on the cultural and other .docx
1.   The process by which one group takes on the cultural and other .docx1.   The process by which one group takes on the cultural and other .docx
1. The process by which one group takes on the cultural and other .docxcuddietheresa
 
1. Milestone InvestingCompare and contrast the interests of .docx
1.   Milestone InvestingCompare and contrast the interests of .docx1.   Milestone InvestingCompare and contrast the interests of .docx
1. Milestone InvestingCompare and contrast the interests of .docxcuddietheresa
 
1. All dogs are warm-blooded. All warm-blooded creatures are mamm.docx
1.  All dogs are warm-blooded. All warm-blooded creatures are mamm.docx1.  All dogs are warm-blooded. All warm-blooded creatures are mamm.docx
1. All dogs are warm-blooded. All warm-blooded creatures are mamm.docxcuddietheresa
 
1-3 Final Project Milestone #1 ProposalThroughout this course.docx
1-3 Final Project Milestone #1 ProposalThroughout this course.docx1-3 Final Project Milestone #1 ProposalThroughout this course.docx
1-3 Final Project Milestone #1 ProposalThroughout this course.docxcuddietheresa
 
1-Please explain Ethical Universalism. Should organizations be socia.docx
1-Please explain Ethical Universalism. Should organizations be socia.docx1-Please explain Ethical Universalism. Should organizations be socia.docx
1-Please explain Ethical Universalism. Should organizations be socia.docxcuddietheresa
 
1-an explanation of why the Marbury v. Madison case is a landmar.docx
1-an explanation of why the Marbury v. Madison case is a landmar.docx1-an explanation of why the Marbury v. Madison case is a landmar.docx
1-an explanation of why the Marbury v. Madison case is a landmar.docxcuddietheresa
 
1-Discuss research that supports the hypothesis that a person’s ac.docx
1-Discuss research that supports the hypothesis that a person’s ac.docx1-Discuss research that supports the hypothesis that a person’s ac.docx
1-Discuss research that supports the hypothesis that a person’s ac.docxcuddietheresa
 
1-Imagine you are a historian, and the only existing sources of evid.docx
1-Imagine you are a historian, and the only existing sources of evid.docx1-Imagine you are a historian, and the only existing sources of evid.docx
1-Imagine you are a historian, and the only existing sources of evid.docxcuddietheresa
 
1-How does relative humidity affect the comfort of people Can you e.docx
1-How does relative humidity affect the comfort of people Can you e.docx1-How does relative humidity affect the comfort of people Can you e.docx
1-How does relative humidity affect the comfort of people Can you e.docxcuddietheresa
 
1-1) In general, what is the effect of one party being mistaken abou.docx
1-1) In general, what is the effect of one party being mistaken abou.docx1-1) In general, what is the effect of one party being mistaken abou.docx
1-1) In general, what is the effect of one party being mistaken abou.docxcuddietheresa
 
1- How did the United States become involved in the politics of Sout.docx
1- How did the United States become involved in the politics of Sout.docx1- How did the United States become involved in the politics of Sout.docx
1- How did the United States become involved in the politics of Sout.docxcuddietheresa
 
1- I need someone who read the book (V for Vendetta) and saw the mov.docx
1- I need someone who read the book (V for Vendetta) and saw the mov.docx1- I need someone who read the book (V for Vendetta) and saw the mov.docx
1- I need someone who read the book (V for Vendetta) and saw the mov.docxcuddietheresa
 
1- Define arbitration.2- Who is responsible for paying an arbitr.docx
1- Define arbitration.2- Who is responsible for paying an arbitr.docx1- Define arbitration.2- Who is responsible for paying an arbitr.docx
1- Define arbitration.2- Who is responsible for paying an arbitr.docxcuddietheresa
 

More from cuddietheresa (20)

1. A corporations distribution of additional shares of its own s.docx
1.  A corporations distribution of additional shares of its own s.docx1.  A corporations distribution of additional shares of its own s.docx
1. A corporations distribution of additional shares of its own s.docx
 
1. Like the modernists, postmodern writers focused on subjective e.docx
1.   Like the modernists, postmodern writers focused on subjective e.docx1.   Like the modernists, postmodern writers focused on subjective e.docx
1. Like the modernists, postmodern writers focused on subjective e.docx
 
1. As the degree of freedom increase indefinitely, the t distribu.docx
1.  As the degree of freedom increase indefinitely, the t distribu.docx1.  As the degree of freedom increase indefinitely, the t distribu.docx
1. As the degree of freedom increase indefinitely, the t distribu.docx
 
1-Explain how the topography of the United states can affect the wea.docx
1-Explain how the topography of the United states can affect the wea.docx1-Explain how the topography of the United states can affect the wea.docx
1-Explain how the topography of the United states can affect the wea.docx
 
1. An exporter faced with exposure to a depreciating currency can.docx
1.  An exporter faced with exposure to a depreciating currency can.docx1.  An exporter faced with exposure to a depreciating currency can.docx
1. An exporter faced with exposure to a depreciating currency can.docx
 
1. According to the central limit theorem, a population which is .docx
1.  According to the central limit theorem, a population which is .docx1.  According to the central limit theorem, a population which is .docx
1. According to the central limit theorem, a population which is .docx
 
1. Which of the following is not a class of essential nutrient.docx
1.     Which of the following is not a class of essential nutrient.docx1.     Which of the following is not a class of essential nutrient.docx
1. Which of the following is not a class of essential nutrient.docx
 
1. The process by which one group takes on the cultural and other .docx
1.   The process by which one group takes on the cultural and other .docx1.   The process by which one group takes on the cultural and other .docx
1. The process by which one group takes on the cultural and other .docx
 
1. Milestone InvestingCompare and contrast the interests of .docx
1.   Milestone InvestingCompare and contrast the interests of .docx1.   Milestone InvestingCompare and contrast the interests of .docx
1. Milestone InvestingCompare and contrast the interests of .docx
 
1. All dogs are warm-blooded. All warm-blooded creatures are mamm.docx
1.  All dogs are warm-blooded. All warm-blooded creatures are mamm.docx1.  All dogs are warm-blooded. All warm-blooded creatures are mamm.docx
1. All dogs are warm-blooded. All warm-blooded creatures are mamm.docx
 
1-3 Final Project Milestone #1 ProposalThroughout this course.docx
1-3 Final Project Milestone #1 ProposalThroughout this course.docx1-3 Final Project Milestone #1 ProposalThroughout this course.docx
1-3 Final Project Milestone #1 ProposalThroughout this course.docx
 
1-Please explain Ethical Universalism. Should organizations be socia.docx
1-Please explain Ethical Universalism. Should organizations be socia.docx1-Please explain Ethical Universalism. Should organizations be socia.docx
1-Please explain Ethical Universalism. Should organizations be socia.docx
 
1-an explanation of why the Marbury v. Madison case is a landmar.docx
1-an explanation of why the Marbury v. Madison case is a landmar.docx1-an explanation of why the Marbury v. Madison case is a landmar.docx
1-an explanation of why the Marbury v. Madison case is a landmar.docx
 
1-Discuss research that supports the hypothesis that a person’s ac.docx
1-Discuss research that supports the hypothesis that a person’s ac.docx1-Discuss research that supports the hypothesis that a person’s ac.docx
1-Discuss research that supports the hypothesis that a person’s ac.docx
 
1-Imagine you are a historian, and the only existing sources of evid.docx
1-Imagine you are a historian, and the only existing sources of evid.docx1-Imagine you are a historian, and the only existing sources of evid.docx
1-Imagine you are a historian, and the only existing sources of evid.docx
 
1-How does relative humidity affect the comfort of people Can you e.docx
1-How does relative humidity affect the comfort of people Can you e.docx1-How does relative humidity affect the comfort of people Can you e.docx
1-How does relative humidity affect the comfort of people Can you e.docx
 
1-1) In general, what is the effect of one party being mistaken abou.docx
1-1) In general, what is the effect of one party being mistaken abou.docx1-1) In general, what is the effect of one party being mistaken abou.docx
1-1) In general, what is the effect of one party being mistaken abou.docx
 
1- How did the United States become involved in the politics of Sout.docx
1- How did the United States become involved in the politics of Sout.docx1- How did the United States become involved in the politics of Sout.docx
1- How did the United States become involved in the politics of Sout.docx
 
1- I need someone who read the book (V for Vendetta) and saw the mov.docx
1- I need someone who read the book (V for Vendetta) and saw the mov.docx1- I need someone who read the book (V for Vendetta) and saw the mov.docx
1- I need someone who read the book (V for Vendetta) and saw the mov.docx
 
1- Define arbitration.2- Who is responsible for paying an arbitr.docx
1- Define arbitration.2- Who is responsible for paying an arbitr.docx1- Define arbitration.2- Who is responsible for paying an arbitr.docx
1- Define arbitration.2- Who is responsible for paying an arbitr.docx
 

Recently uploaded

SECOND SEMESTER TOPIC COVERAGE SY 2023-2024 Trends, Networks, and Critical Th...
SECOND SEMESTER TOPIC COVERAGE SY 2023-2024 Trends, Networks, and Critical Th...SECOND SEMESTER TOPIC COVERAGE SY 2023-2024 Trends, Networks, and Critical Th...
SECOND SEMESTER TOPIC COVERAGE SY 2023-2024 Trends, Networks, and Critical Th...KokoStevan
 
Application orientated numerical on hev.ppt
Application orientated numerical on hev.pptApplication orientated numerical on hev.ppt
Application orientated numerical on hev.pptRamjanShidvankar
 
Making and Justifying Mathematical Decisions.pdf
Making and Justifying Mathematical Decisions.pdfMaking and Justifying Mathematical Decisions.pdf
Making and Justifying Mathematical Decisions.pdfChris Hunter
 
How to Give a Domain for a Field in Odoo 17
How to Give a Domain for a Field in Odoo 17How to Give a Domain for a Field in Odoo 17
How to Give a Domain for a Field in Odoo 17Celine George
 
1029-Danh muc Sach Giao Khoa khoi 6.pdf
1029-Danh muc Sach Giao Khoa khoi  6.pdf1029-Danh muc Sach Giao Khoa khoi  6.pdf
1029-Danh muc Sach Giao Khoa khoi 6.pdfQucHHunhnh
 
Mixin Classes in Odoo 17 How to Extend Models Using Mixin Classes
Mixin Classes in Odoo 17  How to Extend Models Using Mixin ClassesMixin Classes in Odoo 17  How to Extend Models Using Mixin Classes
Mixin Classes in Odoo 17 How to Extend Models Using Mixin ClassesCeline George
 
microwave assisted reaction. General introduction
microwave assisted reaction. General introductionmicrowave assisted reaction. General introduction
microwave assisted reaction. General introductionMaksud Ahmed
 
fourth grading exam for kindergarten in writing
fourth grading exam for kindergarten in writingfourth grading exam for kindergarten in writing
fourth grading exam for kindergarten in writingTeacherCyreneCayanan
 
PROCESS RECORDING FORMAT.docx
PROCESS      RECORDING        FORMAT.docxPROCESS      RECORDING        FORMAT.docx
PROCESS RECORDING FORMAT.docxPoojaSen20
 
psychiatric nursing HISTORY COLLECTION .docx
psychiatric  nursing HISTORY  COLLECTION  .docxpsychiatric  nursing HISTORY  COLLECTION  .docx
psychiatric nursing HISTORY COLLECTION .docxPoojaSen20
 
Grant Readiness 101 TechSoup and Remy Consulting
Grant Readiness 101 TechSoup and Remy ConsultingGrant Readiness 101 TechSoup and Remy Consulting
Grant Readiness 101 TechSoup and Remy ConsultingTechSoup
 
Introduction to Nonprofit Accounting: The Basics
Introduction to Nonprofit Accounting: The BasicsIntroduction to Nonprofit Accounting: The Basics
Introduction to Nonprofit Accounting: The BasicsTechSoup
 
Z Score,T Score, Percential Rank and Box Plot Graph
Z Score,T Score, Percential Rank and Box Plot GraphZ Score,T Score, Percential Rank and Box Plot Graph
Z Score,T Score, Percential Rank and Box Plot GraphThiyagu K
 
Web & Social Media Analytics Previous Year Question Paper.pdf
Web & Social Media Analytics Previous Year Question Paper.pdfWeb & Social Media Analytics Previous Year Question Paper.pdf
Web & Social Media Analytics Previous Year Question Paper.pdfJayanti Pande
 
Explore beautiful and ugly buildings. Mathematics helps us create beautiful d...
Explore beautiful and ugly buildings. Mathematics helps us create beautiful d...Explore beautiful and ugly buildings. Mathematics helps us create beautiful d...
Explore beautiful and ugly buildings. Mathematics helps us create beautiful d...christianmathematics
 
ICT Role in 21st Century Education & its Challenges.pptx
ICT Role in 21st Century Education & its Challenges.pptxICT Role in 21st Century Education & its Challenges.pptx
ICT Role in 21st Century Education & its Challenges.pptxAreebaZafar22
 
Measures of Central Tendency: Mean, Median and Mode
Measures of Central Tendency: Mean, Median and ModeMeasures of Central Tendency: Mean, Median and Mode
Measures of Central Tendency: Mean, Median and ModeThiyagu K
 

Recently uploaded (20)

SECOND SEMESTER TOPIC COVERAGE SY 2023-2024 Trends, Networks, and Critical Th...
SECOND SEMESTER TOPIC COVERAGE SY 2023-2024 Trends, Networks, and Critical Th...SECOND SEMESTER TOPIC COVERAGE SY 2023-2024 Trends, Networks, and Critical Th...
SECOND SEMESTER TOPIC COVERAGE SY 2023-2024 Trends, Networks, and Critical Th...
 
Application orientated numerical on hev.ppt
Application orientated numerical on hev.pptApplication orientated numerical on hev.ppt
Application orientated numerical on hev.ppt
 
Mehran University Newsletter Vol-X, Issue-I, 2024
Mehran University Newsletter Vol-X, Issue-I, 2024Mehran University Newsletter Vol-X, Issue-I, 2024
Mehran University Newsletter Vol-X, Issue-I, 2024
 
Making and Justifying Mathematical Decisions.pdf
Making and Justifying Mathematical Decisions.pdfMaking and Justifying Mathematical Decisions.pdf
Making and Justifying Mathematical Decisions.pdf
 
How to Give a Domain for a Field in Odoo 17
How to Give a Domain for a Field in Odoo 17How to Give a Domain for a Field in Odoo 17
How to Give a Domain for a Field in Odoo 17
 
1029-Danh muc Sach Giao Khoa khoi 6.pdf
1029-Danh muc Sach Giao Khoa khoi  6.pdf1029-Danh muc Sach Giao Khoa khoi  6.pdf
1029-Danh muc Sach Giao Khoa khoi 6.pdf
 
Mattingly "AI & Prompt Design: The Basics of Prompt Design"
Mattingly "AI & Prompt Design: The Basics of Prompt Design"Mattingly "AI & Prompt Design: The Basics of Prompt Design"
Mattingly "AI & Prompt Design: The Basics of Prompt Design"
 
Mixin Classes in Odoo 17 How to Extend Models Using Mixin Classes
Mixin Classes in Odoo 17  How to Extend Models Using Mixin ClassesMixin Classes in Odoo 17  How to Extend Models Using Mixin Classes
Mixin Classes in Odoo 17 How to Extend Models Using Mixin Classes
 
microwave assisted reaction. General introduction
microwave assisted reaction. General introductionmicrowave assisted reaction. General introduction
microwave assisted reaction. General introduction
 
fourth grading exam for kindergarten in writing
fourth grading exam for kindergarten in writingfourth grading exam for kindergarten in writing
fourth grading exam for kindergarten in writing
 
PROCESS RECORDING FORMAT.docx
PROCESS      RECORDING        FORMAT.docxPROCESS      RECORDING        FORMAT.docx
PROCESS RECORDING FORMAT.docx
 
psychiatric nursing HISTORY COLLECTION .docx
psychiatric  nursing HISTORY  COLLECTION  .docxpsychiatric  nursing HISTORY  COLLECTION  .docx
psychiatric nursing HISTORY COLLECTION .docx
 
Grant Readiness 101 TechSoup and Remy Consulting
Grant Readiness 101 TechSoup and Remy ConsultingGrant Readiness 101 TechSoup and Remy Consulting
Grant Readiness 101 TechSoup and Remy Consulting
 
Introduction to Nonprofit Accounting: The Basics
Introduction to Nonprofit Accounting: The BasicsIntroduction to Nonprofit Accounting: The Basics
Introduction to Nonprofit Accounting: The Basics
 
Z Score,T Score, Percential Rank and Box Plot Graph
Z Score,T Score, Percential Rank and Box Plot GraphZ Score,T Score, Percential Rank and Box Plot Graph
Z Score,T Score, Percential Rank and Box Plot Graph
 
Advance Mobile Application Development class 07
Advance Mobile Application Development class 07Advance Mobile Application Development class 07
Advance Mobile Application Development class 07
 
Web & Social Media Analytics Previous Year Question Paper.pdf
Web & Social Media Analytics Previous Year Question Paper.pdfWeb & Social Media Analytics Previous Year Question Paper.pdf
Web & Social Media Analytics Previous Year Question Paper.pdf
 
Explore beautiful and ugly buildings. Mathematics helps us create beautiful d...
Explore beautiful and ugly buildings. Mathematics helps us create beautiful d...Explore beautiful and ugly buildings. Mathematics helps us create beautiful d...
Explore beautiful and ugly buildings. Mathematics helps us create beautiful d...
 
ICT Role in 21st Century Education & its Challenges.pptx
ICT Role in 21st Century Education & its Challenges.pptxICT Role in 21st Century Education & its Challenges.pptx
ICT Role in 21st Century Education & its Challenges.pptx
 
Measures of Central Tendency: Mean, Median and Mode
Measures of Central Tendency: Mean, Median and ModeMeasures of Central Tendency: Mean, Median and Mode
Measures of Central Tendency: Mean, Median and Mode
 

Dell In-Depth Case Study RubricLevel of AchievementCri.docx

  • 1. Dell In-Depth Case Study Rubric Level of Achievement Criteria Poor 0-20% Fair 20-45% Good 45-80% Excellent 80-100% Content 25 points Most questions NOT addressed. Elaboration and detail are not nominally evident. Information is not clear and/or developed. Answers reflect little complexity and critical thinking. Discussion is difficult to understand with little clarity. Lacks meaning, applicability. Some questions are addressed. Some information relative to the topic but lacking elaboration and detail. Answers reflect a basic understanding of the material but no critical thinking or complexity is evident. Discussion is understood but lacks some clarity. Lacks relevancy, meaning, applicability and is somewhat difficult to understand. Most questions addressed. Clear information relative to the topic but lacking elaboration and detail. Answers reflect some complexity and critical thinking is not fully developed. Discussion is understood but
  • 2. lacks some clarity. Mostly relevant, meaningful, applicable and can be understood. All questions are addressed. Elaborate and detailed information relative to the topic. Critical thinking and insight evident in the complexity of answers. Discussion is articulated in a clear manner. Answers are relevant, meaningful, applicable and easily understood. Grammar 10 points Several spelling, grammar or sentence structure errors. The structure of the paper has many discrepancies to the requirements of: clear paragraphs for each question, double spacing, 12-point font, and 1-inch margins. Paper is significantly short of four full pages. Moderate number of spelling or grammar errors. The requirements for the structure of the paper are lacking: clear paragraphs for each question, double spacing, 12-point font, and 1-inch margins. Paper is somewhat short of four full pages. A couple of spelling, grammar or sentence structure errors. The structure of the paper mostly meets the requirements of: clear paragraphs for each question, double spacing, 12-point font, and 1-inch margins. Paper is marginally short of four full pages. No spelling, grammar or sentence structure errors. The structure of the paper should have clear paragraphs for each question. Four-page minimum, double spaced, 12-point font, 1- inch margins. Organization 10 points
  • 3. Few or no answers are organized, easy to follow and logical. Answers do not include supporting details and/or examples. Some answers are organized, easy to follow and logical. Answers do not include supporting details and/or examples. Most answers are organized, easy to follow and logical. Answers include some supporting details and/or examples. All answers are organized, easy to follow and logical. Answers include several supporting details and/or examples. . Bibliography Citation 5 points No required citations referenced on last page. Few required citations referenced on last page. Some sources referenced are appropriate and applicable to the topic. Most required citations clearly referenced on last page. Most sources referenced are appropriate and applicable to the topic. All required citations clearly referenced on last page. All sources referenced are appropriate and applicable to the topic. OLCU 613 Paper 1: Employee Engagement Prepare 4 - 5 page paper that 1) identifies two (2) best practices to effectively engage employees, 2)
  • 4. compares the best practices to the actual practices of a specific organization, 3) makes specific recommendations for that organization, and 4) identifies two (2) insights gained into employee engagement including specific actions to enhance leader effectiveness. Support your analysis with four (4) scholarly sources three of which are journal articles. Criteria Requirements Clearly and concisely describes 2 best practices supported by citations of expert theories and research. Defines all key terms and comprehensively discusses why each practice is effective. Clearly and concisely compares and contrasts an actual organization’s efforts to engage employees with 2 identified best practices. Supports discussion with evidence such as specific examples for each actual practice. Accurately uses findings of comparing best and actual organizational practices to make specific recommendations that would strengthen employee engagement. Clearly and concisely discusses 2 insights gained into effectively engaging employees. Identifies specific actions to enhance leadership effectiveness in engaging employees. Uses 4 or more scholarly sources including 3 journal articles. Accurately adheres to APA standards; reference page and citations are correct. All sources listed in References are cited in paper Paper is logical and well-written; spelling, grammar and punctuation are accurate. Paper is the required length of 4 –
  • 5. 5 pages of content, and includes a correctly prepared title page. Inventory Decisions in Dell's Supply Chain Author(s): Roman Kapuscinski, Rachel Q. Zhang, Paul Carbonneau, Robert Moore and Bill Reeves Source: Interfaces, Vol. 34, No. 3 (May - Jun., 2004), pp. 191- 205 Published by: INFORMS Stable URL: https://www.jstor.org/stable/25062900 Accessed: 13-02-2019 19:24 UTC JSTOR is a not-for-profit service that helps scholars, researchers, and students discover, use, and build upon a wide range of content in a trusted digital archive. We use information technology and tools to increase productivity and facilitate new forms of scholarship. For more information about JSTOR, please contact [email protected] Your use of the JSTOR archive indicates your acceptance of the Terms & Conditions of Use, available at https://about.jstor.org/terms INFORMS is collaborating with JSTOR to digitize, preserve and extend access to Interfaces
  • 6. This content downloaded from 141.217.20.120 on Wed, 13 Feb 2019 19:24:25 UTC All use subject to https://about.jstor.org/terms Interfaces infjIML Vol. 34, No. 3, May-June 2004, pp. 191-205 DOI i0.1287/inte.l030.0068 ISSN 0092-21021 eissn 1526-551X1041340310191 @ 2004 INFORMS Inventory Decisions in Dell's Supply Chain Roman Kapuscinski University of Michigan Business School, Ann Arbor, Michigan 48109, [email protected] Rachel Q. Zhang Johnson Graduate School of Management, Cornell University, Ithaca, New York 14853, [email protected] Paul Carbonneau McKinsey & Company, 3 Landmark Square, Stamford, Connecticut 06901, [email protected] Robert Moore, Bill Reeves Dell Inc., Mail Stop 6363, Austin, Texas 78682 {[email protected], [email protected]} The Tauber Manufacturing Institute (TMI) is a partnership between the engineering and business schools at the University of Michigan. In the summer of 1999, a TMI team spent 14 weeks at Dell Inc. in Austin, Texas, and developed an inventory model to identify inventory drivers and quantify target levels for inventory in the final stage of Dell's supply chain, the revolvers or supplier logistics centers (SLC). With the information and analysis provided by this model, Dell's regional materials
  • 7. organizations could tactically manage revolver inven tory while Dell's worldwide commodity management could partner with suppliers in improvement projects to identify inventory drivers and to reduce inventory. Dell also initiated a pilot program for procurement of XDX (a disguised name for one of the major components of personal computers (PCs)) in the United States to insti tutionalize the model and promote partnership with suppliers. Based on the model predictions, Dell launched e-commerce and manufacturing initiatives with its suppliers to lower supply-chain-inventory costs by reducing revolver inventory by 40 percent. This reduction would raise the corresponding inventory turns by 67 percent. Net Present Value (NPV) calculations for XDX alone suggest $43 million in potential savings. To ensure project longevity, Dell formed the supply-chain-optimization team and charged it with incorporating the model into a strategic redesign of Dell's business practices and supervising improvement projects the model identified. Key words: inventory, production: applications; industries: computer, electronic. History: This paper was refereed. Dell and Our Project Dell is the largest computer-systems company based on estimates of global market share. It is also the fastest growing of the major computer-systems com panies competing in the business, education, gov ernment, and consumer markets. Dell's product line includes desktop computers, notebook computers, network servers, workstations, and storage products. Michael Dell founded the company based on the con cept of bypassing retailers and selling personal com puter systems directly to customers, thereby avoiding the delays and costs of an additional stage in the
  • 8. supply chain. Much of Dell's superior financial per formance can be attributed to its successful imple mentation of this direct-sales model. While the computer industry has grown tremen dously over the past decade, firms in this industry face their own challenges. First, rapid changes in tech nology make holding inventory a huge liability. Many components lose 0.5 to 2.0 percent of their value per week, and a supply chain packed with yesterday's technology is nearly worthless. With its direct sales, however, Dell carries very little inventory: the whole organization concentrates on speeding components and products through its supply chain. Dell delivers new products to market faster than its competitors and does not have to sell old products at a discount, because it has none. Second, the traditional model of vertical integration that the original equipment man ufacturers (OEMs) follow to manufacture all of the major components of their products has almost disap peared in the computer industry. Research and devel opment (R and D) costs are too high and technology changes too rapid for one company to sustain lead ership in every component of its product lines. Dell has close-relationship agreements with its suppliers that allow them to focus on their specific compo nents. At the same time, Dell concentrates its research on customer-focused, collaborative efforts to lever age the collective R and D of its partners (Dell and Magretta 1998), which includes cultivating its supply chain competence. Dell management was concerned that, although the firm carried almost no inventory, its suppliers might 191
  • 9. This content downloaded from 141.217.20.120 on Wed, 13 Feb 2019 19:24:25 UTC All use subject to https://about.jstor.org/terms Kapuscinski et al.: Inventory Decisions in Dell's Supply Chain 192 Interfaces 34(3), pp. 191-205, ?2004 INFORMS be holding much more inventory than was needed to provide desired customer service. For this reason, Dell asked a team from the Tauber Manufacturing Institute (TMI), a partnership between the engineering and business schools at the University of Michigan, to study this issue. Dell sought recommendations for a sustainable process and decision-support tools for determining optimal levels of component inventory to support the final assembly process. Dell bases its business model on integrating five key strategies: rapid time to volume, products built to order, elimination of reseller markups, superior service and support, and low inventory and capital investment. We designed our project and the resulting tools to support Dell's low-inventory and low-capital investment strategy and to extend its impact beyond the plant floor into the preceding stage of its supply chain. Tom Meredith, at the time chief financial offi cer, said in the May 18,1999 earnings conference call: "Customers see no advantage in a manufacturer low ering inventory to six days if there are still 90 days in the supply line." Our project was the first step taken to combat the "90 days in the supply line." Dell's Supply Chain
  • 10. Dell's supply chain works as follows. After a cus tomer places an order, either by phone or through the Internet on www.dell.com, Dell processes the order through financial evaluation (credit checking) and configuration evaluations (checking the feasibility of a specific technical configuration), which takes two to three days, after which it sends the order to one of its manufacturing plants in Austin, Texas. These plants can build, test, and package the product in about eight hours. The general rule for production is first in, first out, and Dell typically plans to ship all orders no later than five days after receipt. There are, however, some exceptions. For example, Dell may manipulate the schedule when there is a need to replace defective units or when facing large customers with specific service-level agreements (who have non standard quoted manufacturing lead times) for their orders. In most cases, Dell has significantly less time to respond to customers than it takes to transport com ponents from its suppliers to its assembly plants. Many of the suppliers are located in Southeast Asia and their transportation times to Austin range from seven days for air shipments to upwards of 30 days by water and ground. To compensate for long lead times and buffer against demand variability, Dell requires its suppliers to keep inventory on hand in the Austin revolvers (for "revolving" inventory). Revolvers or supplier logistics centers (SLCs) are small warehouses located within a few miles of Dell's assembly plants. Each of the revolvers is shared by several suppliers who pay rents for using their revolver.
  • 11. Dell does not own the inventory in its revolvers; this inventory is owned by suppliers and charged to Dell indirectly through component pricing. The cost of maintaining inventory in the supply chain is, how ever, eventually included in the final prices of the computers. Therefore, any reduction in inventory ben efits Dell's customers directly by reducing product prices. Low inventories also lead to higher product quality, because Dell detects any quality problems more quickly than it would with high inventories. Dell wishes to stay ahead of competitors who adopt a direct-sales approach, and it must be able to reduce supplier inventory to gain significant lever age. Although arguably supply-chain costs include all costs incurred from raw parts to final assembly, Dell concentrates on Dell-specific inventory (that is, parts designed to Dell's specifications or stored in Dell specific locations, such as its revolvers and assembly plants). Because assembly plants hold inventories for only a few hours, Dell's primary target, and ours in this project, was the inventory in revolvers. Dell has a special vendor-managed-inventory (VMI) arrangement with its suppliers: suppliers decide how much inventory to order and when to order while Dell sets target inventory levels and records suppliers' deviations from the targets. Dell heuristically chose an inventory target of 10 days supply, and it uses a quarterly supplier scorecard to evaluate how well each supplier does in maintaining this target inventory in the revolver. Dell withdraws inventory from the revolvers as needed, on average every two hours. If the commodity is multisourced (that is, parts from different suppliers are completely
  • 12. interchangeable), Dell can withdraw (pull) those com ponents from any subset of the suppliers. Dell often withdraws components from one supplier for a few days before switching to another. Suppliers decide when to send their goods to their revolvers. In prac tice, most suppliers deliver to their revolvers on aver age three times a week. To help suppliers make good ordering decisions, Dell shares its forecasts with them once per month. These forecasts are generated by Dell's line of busi ness (LOB) marketing department. In addition to product-specific trends, they obviously reflect the seasonality in sales. For home systems, Christmas is the top time of the year. Other high-demand periods include the back-to-school season, the end of the year when the government makes big pur chases, and country-specific high seasons for foreign purchases (foreign language keyboards are especially influenced). Dell sales also increase at the ends of quarters (referred to as the hockey stick). This content downloaded from 141.217.20.120 on Wed, 13 Feb 2019 19:24:25 UTC All use subject to https://about.jstor.org/terms Kapuscinski et al.: Inventory Decisions in Dell's Supply Chain Interfaces 34(3), pp. 191-205, ?2004 INFORMS 193 After the center of competence (COC) checks a fore cast for predicted availability of components, the fore cast goes to Dell's commodity teams and becomes the basis for a six-month rolling forecast that they update weekly. The commodity teams make generic forecasts
  • 13. for systems and components and break those forecasts down to a level of the specific parts that need to be ordered. If the forecast is not feasible, the LOB mar keting department revises it, although such revisions are very rare. The buyer-planner for each commodity receives an updated rolling forecast weekly; suppliers receive forecasts monthly. The objectives of our project were to recommend target inventories for the revolvers to minimize inventory-related costs subject to a service-level con straint and to develop a process and tools for iden tifying and updating target levels for inventories of the items in the revolvers. (Suppliers who make the replenishment decisions attempt to follow Dell's tar gets and guidelines.) Dell had been setting inventory targets based on empirical data and judgment with no clear reference to any desired service levels. Dell hypothesized that it could reduce revolver inventory markedly by using a more rigorous approach and gaining better visibility of the inventory throughout the supply chain. Once it determined an optimized inventory level, Dell could collaborate with its sup pliers to eliminate excess inventory. Dell emphasized that it wanted to sustain any changes over the long term, which would require integrating them into its informational infrastruc ture. ValueChain is a program intended to extend Dell's successful direct-sales approach back into the supply chain with the goal of increasing the speed and quality of the information flow between Dell and its supply base. The corresponding Web site valuechain.dell.com is an extranet for sharing such information as points of contact, inventory in the sup ply chain, supply and demand data, component qual
  • 14. ity metrics, and new part transitions. Dell envisions using this site to exchange with suppliers current data, forecasted data, new product ideas, and other dynamic information that might help it to optimize the flow of information and materials in the supply chain. By integrating the process and associated tools that we developed with valuechain.dell.com, we want to make the tools part of Dell's and its suppliers' procurement-business processes. Dell and its suppli ers through ValueChain can share such information as target inventory levels to support collaboration on future improvements. Our Approach We concentrated on the last stage of Dell's supply chain, the revolvers, where the inventories of all com ponents are Dell specific. Dell believes that inventory savings at this level will produce comparable supply chain savings. Also, analysis of this stage is a neces sary first step to further improve the whole supply chain. We looked at the inventories of an important component, XDX, in the revolvers themselves and in transit to revolvers. XDX is one of the major compo nents of PCs, supplied by a few suppliers, that is fully interchangeable (customers do not choose the man ufacturer of this component when ordering the final product). In our analysis, we made several simplifying assumptions. Because the supply chain provides a fairly high service level, simultaneous shortages of multiple components are very infrequent, and thus,
  • 15. we could ignore them without significantly altering the results. Although Dell regularly updates its fore casts of demand and hence its desired inventory lev els, we assumed stationary demand and inventory targets during a rolling forecast horizon of 10 busi ness days. We realized that the behaviors of demand and inventories at the beginning and the end of a product's life cycle differ from those mid life cycle; however, we handled them separately and do not describe them here. (Kurawarwala and Matsuo 1996 describe ramp-on using the Bass 1969 model.) We call the inventory in the revolvers the revolver inven tory and the revolver inventory plus any inventory ordered but not yet delivered the system inventory. Although revolver inventory determines the availabil ity of parts, Dell can control it only by placing new orders (increasing the system inventory). Currently, Dell's suppliers order in batches (to off set fixed ordering costs incurred every time an order is placed) when inventory levels drop. However, the actual order (batch) sizes and points (levels) at which the suppliers reorder are quite inconsistent. Our first task was to develop a tool that would bring con sistency to suppliers' ordering decisions. (Our esti mates of the benefits do not include benefits from eliminating existing inconsistencies.) We considered using continuous-time, discrete-time (time buckets), or fixed-time-period approaches. Because suppliers and buyer-planners react to changes in conditions as they occur, we used a continuous-time approach and the corresponding optimal policy, a (Q, R) pol icy. Also, we found that (Q,R) policies are far eas ier for the managers at Dell to understand and use than the (s, S) policies used in periodic settings. In
  • 16. a (Q, R) policy, R denotes the reorder point and Q is the size of the order (that is, we order a batch of size Q whenever system inventory drops to R). Con sequently, R + Q denotes the order-up-to level. We also used the newsvendor ratio to heuristically find the best reorder point, R. We focused on identifying the optimal reorder point R for XDX and assumed that the order size Q would remain at its current level. This content downloaded from 141.217.20.120 on Wed, 13 Feb 2019 19:24:25 UTC All use subject to https://about.jstor.org/terms Kapuscinski et al.: Inventory Decisions in Dell's Supply Chain 194 Interfaces 34(3), pp. 191-205, ?2004 INFORMS That is, based on long-term data, we estimated the order size Q suppliers were using and assumed it would not change. The reorder point is closely related to safety stock, which is the extra inventory held to buffer against multiple sources of variability. Specifically, safety stock is the difference between the reorder point and the average requirements during replenishment lead time (the latter is also called pipeline inventory). Assum ing normal distributions of forecast error and of replenishment lead time and independence of fore cast errors, the safety stock level for (Q, R) policy is given by Z * Jfi2a2--?m^j, and the reorder point is the sum of the pipeline inventory and safety stock. That is,
  • 17. R = lil?if + zJfjL2f a2 + iLi<Tf, where [if is the average of the daily forecasted demand during replenishment lead time, ay is the standard deviation of daily forecast error during replenishment lead time, ?jl1 and <jx are the mean and standard deviation of the replenishment time, and Z is a score that links safety stock with required service level. For a desired service level defined as the probability that demand is met from stock, Z = <?>-1 (service level), where <?( ) is the cumulative standard normal distribution. Safety stock protects against variability of demand during lead time. Here, we control safety stock through the total system inventory (the inventory in the revolvers and the inventory on order), as these two differ only by a constant. We can approximate the optimal safety stock using the newsvendor logic (Nahmias 1997). According to this approximation, the probability of satisfying all demand (or the ser vice level) needs to be equal to the critical fractile cu/(cu + c0), where cu is the cost of not being able to satisfy one unit of demand (underage cost), and c0 is the cost of maintaining an unused unit of inven tory between consecutive ordering decisions (overage cost). The critical fractile is thus the same as the ser vice level that balances the costs of carrying one too many items versus one too few items in inventory. With 4>() being the cumulative standard normal dis
  • 18. tribution, optimal Z = ^>~1(cu/(cu + c0)). To calculate the optimal service level, we needed data to estimate cu and c0. After specifying the model, we decided how to esti mate the input parameters (for example, demand data and cost coefficients) and focused on the supply chain for XDX. For all of the input parameters, we used his torical data. We developed a user-friendly spreadsheet tem plate, the revolver inventory model, which allows a buyer-planner to set target inventory levels and track actual inventory levels daily. The spreadsheet uses historical data to estimate demand. It also estimates such parameters as the costs of underage and over age, calculates the suggested policy, illustrates the his torical behavior, and permits numerical and graphical analyses of scenarios. The revolver inventory model also serves as a strategic or diagnostic tool by relating components of the total-required-inventory levels to the various underlying causes. For example, we could determine what portion of the required inventory is due to variation in the forecast error. We collected his torical data for XDX for each of the variables identi fied by the model and performed our original analysis for the period from December 1,1998 through May 27, 1999 (we included a methodology for daily updates). In the final step in this portion of the project, we used the analysis of the data and the model to identify areas for improvement. The Golf Analogy at Dell
  • 19. While many people at Dell understand inventory replenishment concepts, we found that they had no knowledge of formal operations-management theo ries. To explain these ideas, we used an analogy from golf, employing terms from the sport to describe the expressions and conditions commonly found in basic inventory equations. A golf course provides many physical obstacles, such as sand traps, water hazards, and the long distances to the hole. All of these ele ments are completely out of the control of the golfer, and they must accommodate these perils through out the game. Like water hazards and sand traps, several factors can hinder a smooth delivery of com ponents in a supply chain, such as road construc tion or congested highways. The distance between the tee and the hole is analogous to the distance from suppliers to the OEM. In golf, each hole has a standard, or par that the course designer sets based on a variety of factors. This par will not change unless the designers of the course return and make fundamental alterations to the layout. The interest ing thing about par is that it gives golfers a target to strive for. They have constant feedback on how they are doing, compared to a set standard. With no variability in the system, the inventory necessary to maintain steady production depends on only three factors: demand, replenishment time, and shipping frequency (or the size of shipments). We dubbed this level of inventory as par, based on the notion that a problem-free manufacturing environment should run efficiently with a certain natural level of inventory just as an average, problem-free golfer should achieve an expected score on a course. We calculated the par This content downloaded from 141.217.20.120 on Wed, 13 Feb 2019 19:24:25 UTC
  • 20. All use subject to https://about.jstor.org/terms Kapuscinski et al.: Inventory Decisions in Dell's Supply Chain Interfaces 34(3), pp. 191-205, ?2004 INFORMS 195 level of inventory for several points in the supply chain: total system par = forecasted demand for time period * (replenishment time for the supplier + time between shipments/2). The first part of the total system par is some times called the pipeline inventory, that is, the aver age inventory ordered but not yet delivered, while the second part is the cycle inventory, inventory due to batching. By Little's law, the average time between orders is given by Q/fif (Nahmias 1997) for given order quantity Q and forecasted average daily demand during replenishment lead time fij. Dell's Handicap In golf, a handicap is a measure of a golfer's perfor mance relative to an expected baseline, the par. As a golfer improves over time, his or her handicap score decreases. We used this term and found it very effec tive to describe safety stock and the reasons why the organization might carry extra material. Safety stock insures against potential variations on both Dell's side and the supplier's side of the sup
  • 21. ply chain. To gauge improvements and to determine causes of variation, we separated the sources of vari ance. We referred to the safety stock required to cover problems and variance within Dell's portion of the supply chain as Dell's handicap, and we referred to the remaining inventory needed to guard against the supplier's failures to deliver quality goods consis tently on time as the supplier's handicap. For the project, Dell and its suppliers agreed to outline the elements that would constitute the supplier's handi cap. We planned to make the supplier's handicap part of the supplier scorecard. Important elements of Dell's handicap are forecast error and pull variance. We use variance in the sta tistical sense as the expected value of the square of deviations from target values. Dell forecasts its need for individual components in two stages. In the first stage, it forecasts an aggregate number of final prod ucts; in the second, it estimates the mix of compo nents (corresponding to different features). An error is associated with each of the two stages. The absolute difference between the number of units actually sold on the aggregate level and the number forecasted is called the aggregate deviation. The difference between the actual units and the forecasted units that incorpo rate a specific component (feature) is another forecast error, labeled the attach deviation. Both are absolute differences, not fractions. Outside of the forecasting process, a deviation also exists between what Dell pulls out of the revolver daily and what the supplier expected Dell would pull based on the production schedule. This is the pull deviation. While aggregate demand is generally predictable
  • 22. and not a major contributor to the safety stock, the attach rate varies noticeably. Customer preferences change every day, sometimes drastically, despite Dell's amplifying or reducing demand through sales and price reductions or increases for various compo nents. The attach deviation is the difference between the expected demand for a component and the actual number of components Dell uses, assuming that Dell pulls at the predetermined percentage and has made no aggregate-level error. For example, suppose that Dell forecasts an aggregate demand for 4,000 units, 2,000 of which would have XDXs attached, represent ing a 50 percent attach rate. If the actual demand turns out to be 3,200 units, then the forecasted demand at the aggregate level deviates from the actual by 800 units. However, suppose that demand perfectly matches the forecast of 4,000 (resulting in an aggregate deviation of 0), but only 1,500 com puters need an XDX. In this case, the actual attach rate is only 37.5 percent and the attach deviation is 2,000 - 1,500 = 500. This attach deviation can be cal culated for each supplier. If Suppliers A and B each have 50 percent of Dell's business for this device, Dell would plan to consume 1,000 of A's XDXs and 1,000 of B's XDXs. If the pulled quantities are proportional to the allocated ratios (50 percent for each supplier), then each would provide 750 units. In this case, the attach deviation equals 1,000 ? 750 = 250 for each sup plier. (The actual pull is 250 units less than the fore casted pull of 1,000 units.) Safety stock is driven by variances (in the square root formula for safety stock), and therefore, we trans late all of the deviations into corresponding variances.
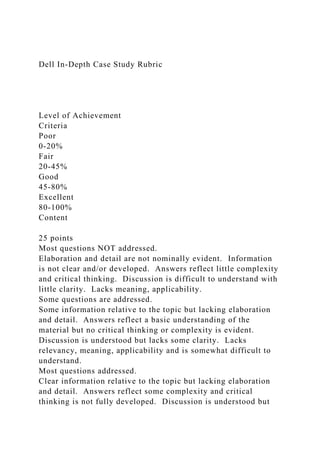
  • 23. Our objective is to examine the total variance and to attribute it to specific causes. Because it is more dif ficult to forecast on the component level than on the aggregate level, we expect that the attach variance will be greater than or equal to the aggregate-level vari ance. By subtracting the aggregate-level variance from the attach variance, we can estimate the incremen tal contribution of attach rates to the variance, even though these effects are obviously not independent. If the commodity in question is multisourced, Dell must further allocate the attach rate forecast to indi vidual suppliers. Dell tends to pull material from competing suppliers in batches, switching from one to the other, rather than taking a fixed percentage from each one. Thus, even without any aggregate-level variance or attach variance, the suppliers' inventory is different than forecasted. This is referred to as the pull variance (Figure 1). Dell pulled different numbers of units of XDX from two suppliers' revolvers. Dell's This content downloaded from 141.217.20.120 on Wed, 13 Feb 2019 19:24:25 UTC All use subject to https://about.jstor.org/terms 196 Kapuscinski et al.: Inventory Decisions in Dell's Supply Chain Interfaces 34(3), pp. 191-205, ?2004 INFORMS 12/1 12/2 12/3 12/4 12/5 12/7 12/8 12/9 12/10 12/1112/12 12/14 12/15 12/16 12/17 12/18 12/19 12/21
  • 24. I Supplier A M Supplier B Date Figure 1: Dell pulled different numbers of units of XDX from two suppliers' revolvers. Light bars and dark bars correspond to quantities pulled by two different suppliers. The arrows above the graph denote the range of days during which Dell pulled predominately one supplier's goods. Dell's pulling in batches of different sizes results in a larger forecast error than would be the case if it used all components in a fixed ratio (level schedule or level pull). pulling in batches of different sizes results in a larger forecast error than would be the case if it used all components in a fixed ratio (level schedule or level pull). Even though the suppliers do not order every day, they continuously monitor the inventory levels and, therefore, the pull variance influences their decisions. We compute the pull variance using the same underlying logic as the other two variances except that it derives from the build-pull error instead of the forecast-build error. So, if Dell expected to use 2,000 XDXs per day and it actually used 2,000, the aggre gate and attach deviations would be zero. If each of the two suppliers has 50 percent of the business, then each would expect to supply 1,000 units during the day. However, if Dell ignored the percentage of busi ness and pulled all 2,000 units from Supplier A and none from Supplier B, it would cause high levels of forecast error (and confusion) for both suppliers. If, on the other hand, Dell pulled according to the fore casted business percentage for each supplier, it would
  • 25. eliminate the pull deviations (and consequently vari ance). The data clearly indicate that the variance from Dell's pulls is greater than the variance in the attach rate, which is greater than the aggregate variance, thus leading to inflated inventories. Using these three variances as inputs to the model results in three different inventory requirements. Even though interdependencies exist among these vari ances, by calculating the differences between these inventory requirements, Dell can estimate the cost of error propagation from the aggregate level, through the detailed component level, to the actual variance of pulls from the revolvers (Figure 2). The inventory Safety stock = Z * ?l?)o] + ?i<? Figure 2: In this breakdown of Dell's handicap, the left side shows the levels of inventory required due to the accumulation of variance. The right side illustrates how we associate the inventory with each of the underlying causes. We interpret the incremental inventory as a result of the three causes. This content downloaded from 141.217.20.120 on Wed, 13 Feb 2019 19:24:25 UTC All use subject to https://about.jstor.org/terms Kapuscinski et al.: Inventory Decisions in Dell's Supply Chain Interfaces 34(3), pp. 191-205, ?2004 INFORMS 197 Supplier's handicap
  • 26. Dell's handicap Replenishment time Figure 3: We developed a total inventory breakdown assuming the current sources of inefficiency, and we call the inventory driven by aggregate vari ance, attach variance, and pull variance Dell's handicap. driven by aggregate variance, attach variance, and pull variance is called Dell's handicap (Figure 3). Our next logical step was to attack this level of inventory through various improvement initiatives. Data Collection and Analysis The model provides Dell with a scientific tool to determine the revolver inventory levels and hence to manage its supply chain in a systematic way. The model can also create a reference point for future improvements and estimate the savings Dell can obtain by changing its current manufacturing sys tem. Specifically, buyer-planners can use the model to manage their inventory at a desired service level, and commodity managers can use it to measure improve ments in the supply chain. To implement the model, we needed to gather historical data and create a self contained, user-friendly spreadsheet template buyer planners can use daily. Data Collection We collected data for the period from December 1, 1998 through May 27, 1999. Three companies (A, B, and C) supplied XDXs to Dell during this period.
  • 27. Supplier A supplied two different XDXs, Supplier B and Supplier C each provided one part number but many versions of that part. The parts supplied by A, B, and C are labeled as XA1, XA2, XB, and XC. We used two groups of data in our analysis: data related to the economics of safety stock (mainly the costs of underage and of overage) and data related to historical estimates of the variance of lead-time demand. The Cost of Underage We calculated the cost of underage by evaluating the impact of not having an XDX in inventory. We did not consider the costs of switching among suppliers but instead concentrated on the cost of running out of XDXs altogether. Consequently, we based lost mar gins on cancelled orders and compensation for the expedited shipping costs for delayed orders. The data included estimates of ?the lost profit from a canceled order, ?increased shipping cost for not having a compo nent when needed (the product is express shipped to the customer or the shipping charges are reduced or waived or both), ?the portion of customer orders that results in a lost profit, and ?the fraction of orders that incur higher shipping costs. Several costs (for example, for substitution and for
  • 28. air freight) are caused by part shortages, and they are not easy to quantify; many have a greater impact on profit than lost sales. We advised Dell to try to quan tify all of these costs in the future. They include ?providing a better part at the same price as the requested part, ?paying a penalty, for example, a percentage of the price of the system for each day above the standard lead time (as specified in some of Dell's contracts), ?making price concessions on future orders because of noncompliance with stated lead times, ?losing sales opportunities with disappointed cus tomers, and ?losing sales when sales representatives call cus tomers to explain delinquent orders instead of calling other customers to make new sales. The Cost of Overage In calculating the cost of overage, we recognize that the effect of current ordering decisions is limited to the time between consecutive deliveries of the compo nent. During that time, capital is tied up, price erosion occurs, and the revolver assesses a storage charge. We considered the following data in determining the cost of overage: ?We assumed that the supplier's annual cost of capital was slightly higher than Dell's. ?We estimated price erosion based on empirical data on price decreases for XDXs.
  • 29. ?We estimated that the average time between deliveries was two days based on conversations with sales representatives from all suppliers. Most said that they order from their factories approximately three times per week. Dell's need for the parts and suppli ers' presumptions about the size of the order, and not preset schedules, drive their ordering. This content downloaded from 141.217.20.120 on Wed, 13 Feb 2019 19:24:25 UTC All use subject to https://about.jstor.org/terms Kapuscinski et al.: Inventory Decisions in Dell's Supply Chain 198 Interfaces 34(3), pp. 191-205, ?2004 INFORMS Lead Time Demand Variance We collected the following data for use in our histor ical study of variance of lead-time demand for XDXs: ?Dell's daily pulls from the revolver for produc tion but not other pulls (for replacement parts or for quality issues), although they were still used to deter mine the inventory level in the revolver, ?daily receipts of suppliers' components at the revolver, ?daily quantities of in-transit inventory between the suppliers and the revolver, ?daily sales or builds of systems needing XDXs, ?Dell's forecasts to its suppliers specifying the quantity of each supplier's XDX that Dell expects to
  • 30. use during the next month, and ?the suppliers lead times for XDXs obtained from the suppliers' representatives in Austin (includ ing day stamps indicating when parts became Dell-specific), transport times, and the amount of Dell-specific finished-goods inventory suppliers held at their manufacturing and configuration sites. We could not calculate the standard deviation of supplier lead times with the data collected; we esti mated it based on anecdotal evidence. Also, in many cases, suppliers made deliveries of more than one batch, which meant that average lead time could be an inappropriate variable. Because the purpose of safety stock is to reduce the risk of running out of inventory, we used the lead time for the first batch as an estimate of the relevant variable. Other Parameters We collected the data to derive values for other needed parameters. ?We calculated the daily quantity of inventory in the system (the system inventory) by adding inven tory in the revolver to that in transit for each part number on each production day. ?We calculated the forecast error for demand dur ing lead time by directly collecting data on the quan tity analyzed. That is, we considered buckets of time equal to the lead time and calculated the forecast error for each bucket by summing the forecasted demand for all days in the bucket and subtracting Dell' actual pulls over the same period. Then, we calculated a
  • 31. standard deviation of these errors. To express the error as a portion of average demand, we divided the result by the average of the forecasts for the next 10 days, a number we believed was appropriate after observing some real data. ?We calculated the days of inventory Dell held (a measure common at Dell) by dividing a given day's inventory level by the average of the forecasts for the next 10 days. In addition to expressing a given day's inventory in terms of inventory days, we also calcu late the average inventory in units. ?To assess Dell's method of making ordering deci sion, we translated the system inventory levels just before orders into corresponding Z-scores. That is, we used the system inventory to solve for the Z-score for each lead-time bucket and then converted the Z-score into the corresponding service level, using the standard normal distribution. The resulting quantity described the imputed service level. ?We determined the optimal XDX inventory lev els, in transit and system inventory levels, for the aggregate and for individual suppliers that should have been carried. These values were calculated using the following formulas: average in-transit inventory = ^??x^, and average system inventory = R + Q/2 = (/x? + L/2)fif ~^~Zo"DfLT, where Q is the order size, L is the average time between shipments received at the revolver, (rDfLT =
  • 32. JfjAaf +/??aj is the standard deviation of demand during the lead time, and R = ?n^f + ZaD LT is the reorder point. ?We calculated the optimal number of days of XDX that Dell should have held by dividing each day's optimal inventory by the average of the fore casts for the next 10 days. We calculated these figures for each part number for each date included in the study. (We wanted to compare the optimal number of days with the actual number of days of inventory in the system.) Data Analysis Although interested in the inventory savings, Dell's management wanted to be very cautious and to over estimate, rather than underestimate, inventory needs to avoid damaging customer service due to unavail ability of components. Although our model can handle all the factors listed below, we initially ignored some factors that would have reduced inventory needs even further. First, Dell assembles most of its products two or three days after receiving an order. To be conservative, we ignored this extra lead time. We can easily incorporate its effects by reducing suppliers' delivery times to the revolvers. Second, Dell wanted to run the model at its current average service levels for each component before making any further changes. Third, pooling might provide benefits because three firms were sup plying interchangeable parts. For all three suppliers combined, to achieve a 98 percent service level, each would need to achieve a much lower service level (about 70 to 75 percent if they were of comparable sizes). Before exploiting the benefits of pooling, Dell
  • 33. wanted to eliminate the current operational disadvan tages caused by clumpy pulls. Also, we ignored ramp up and ramp-down effects. This content downloaded from 141.217.20.120 on Wed, 13 Feb 2019 19:24:25 UTC All use subject to https://about.jstor.org/terms Kapuscinski et al.: Inventory Decisions in Dell's Supply Chain Interfaces 34(3), pp. 191-205, ?2004 INFORMS 199 Part number System Z-score System service level (%) Aggregate 2.26 98.80 XA1(A) 1.50 93.27 XA2(A) 1.51 93.49 XB(B) 1.25 89.35 XC(C) 0.93 82.42 Table 1: In this table of historical average system service levels (as of May 27,1999), the parts supplied by A, B, and C are labeled as XA1, XA2, XB, and XC. Given these simplifications and Dell's require ments, we started by investigating the historical ser vice levels and then the forecast error. Service Level The aggregated imputed historical service level of 98.80 percent was surprisingly close to the optimal
  • 34. service level of 98.66 percent provided by the model (Table 1). Individual products, however, had signif icantly different average service levels, and actual service levels (and the corresponding Z-scores) var ied significantly over the course of the study (Fig ure 4). Inventory theory would suggest a fairly stable level of service. If demand were stationary, both the reorder point and the inventory order-up-to levels would be constant. Even when demand forecasts vary from period to period, because the costs of underage and overage are very stable, the expected service level and the corresponding Z-score, where Z = 4>_1(cM/ (cu + c0)), should remain constant (unless there are substantial nonstationarities). We therefore expressed the inventory levels just before orders were placed as Z-scores. Our results show major swings of the Z-scores, which indicates that Dell's suppliers do not follow a (Q, R) policy. We understood that they used ad hoc techniques, and we were not able to capture them formally. We suspect that these swings were caused by suppliers overreacting to current situations and possibly by long-term trends. (We performed the same analysis for inventory order-up-to levels, which should also remain stable, yet they were equally volatile.) While individual orders varied widely dur ing the study period, the average service level for all three suppliers combined was very close to the optimal. Our estimates of the average historical service level are very close to the estimates of optimal service lev els, and thus the average service level should remain at the current level. However, because in the past inventories shifted erratically and Dell had no consis tent policy, it should be able to reduce average inven
  • 35. tory by following a consistent policy. Forecast Error We gathered information on historical forecasts for XDX and the actual Dell pulls and compared the two for each of the replenishment periods. Forecast error is a critical input in determining the optimal inven tory level. In our model, we assumed the errors to be random. However, it was apparent (and confirmed by formal analysis) that at the commodity level the errors are not independent from period to period. The error showed strong linear trends (Figure 5). The strong error trends could arise from several factors, including forecasting. Like many companies, Dell passes forecasts through various internal organi zations before disseminating them to suppliers. While innocently acting with the company's best interest in mind, each group used its own judgment and biases to modify the forecasts of demand. Such iter ative hedges and adjustments can erode the qual ity of the original information. Dell's supply-chain 7 - 6 5 (fi (D 8 4 CO *3 2
  • 36. 1 0 % 20 40 60 80 Time 100 120 140 Figure 4: In this graph of Z-scores for system inventory associated with historical service levels over the course of the study, each point corresponds to a placed order. This content downloaded from 141.217.20.120 on Wed, 13 Feb 2019 19:24:25 UTC All use subject to https://about.jstor.org/terms 200 Kapuscinski et al.: Inventory Decisions in Dell's Supply Chain Interfaces 34(3), pp. 191-205, ?2004 INFORMS O c 2.50 2.00 1.50 1.00 ? 0.50 c O
  • 37. CO CO ? 0.00 -0.50 -1.00 -1.50 -2.00 -2.50 / v.* ~? -"V r 11/21 12/11 12/31 1/20 2/9 3/1 3/21 4/10 4/30 5/20 6/9 Figure 5: The forecast error for XDX over the course of study showed strong linear trends. optimization team has targeted these forecasts for process improvement. Despite this concern, we used the forecast data to estimate inventory levels. We exer cised extra caution, however, and to reduce potential inaccuracy, we dealt with the lack of independence heuristically (as described in the data analysis sec tion). In this way, we believe that we did not compro mise the results from the model, even though the lack of independence reduced the accuracy of the model's recommendations. In graphing forecast error for XA2, we observed
  • 38. strong cyclic behavior (Figure 6). This can be attributed to the frequency and format of the data Dell provides to the suppliers. The information is pro vided weekly in monthly buckets. Suppliers generally divide these aggregate monthly figures evenly into four weekly buckets but do not divide it further by days of the week. Sometimes they may even consider the forecast for two weeks as demand needed in one day (the first day of the two weeks). As a result, the forecast for cumulative demand becomes a step func tion, while it actually grows linearly. Several other factors (most related to human errors) can contribute to forecast inaccuracies beyond nor mally expected levels. Ultimately, these forecast errors could prompt Dell to investigate its forecasting pro cedures and possibly adopt a more quantitative approach. Results Analysis After analyzing the data required for the model, we created an Excel-based tool for the buyer-planners. This spreadsheet-based tool was self-contained and included an overview of an input area, actual cal culations, suggested decisions, and explanations of the logic for each step. To provide detailed infor mation on each component, we created a series of charts dynamically linked to source data. These charts depicted ?current inventory versus recommended inven tory in units, ?current days of inventory versus recommended
  • 39. days of inventory (the above output translated into days), / * * # * 11/21 12/11 12/31 1/20 2/9 3/1 3/21 4/10 4/30 5/20 6/9 Figure 6: The forecast error for XA2 over the course of study showed a difference between actual orders and forecasted values before Christmas in December of 1998. This content downloaded from 141.217.20.120 on Wed, 13 Feb 2019 19:24:25 UTC All use subject to https://about.jstor.org/terms Kapuscinski et al.: Inventory Decisions in Dell's Supply Chain Interfaces 34(3), pp. 191-205, ?2004 INFORMS 201 ?current service level compared to the recom mended level, ?inventory drivers, that is, inventory units broken down into causes (such as aggregate error, attach rate error, and pull error), and ?inventory percentage drivers, that is, inven tory units broken down into causes and listed as percentages. Data at this moment must be manually (copy and paste) entered, but Dell is independently proceeding with automating this link.
  • 40. Service Levels After developing a format for the data and determin ing the historical service levels, we examined what the model's recommendations would have been for the past six months. Because the levels of service for individual products were significantly different from those the model would have recommended, Dell and the TMI team agreed to implement the model. The implementation, however, would be split into two stages. In stage 1, historical service levels would be imposed and used as an input to the model; in stage 2, service levels for individual products would be adjusted in accordance with the model's recom mendations. Not surprisingly, in stage 1, the model's outputs were close to the average historical levels (Table 2). Optimal vs. Actual Inventory Levels While the order-up-to levels that we calculated using the model remained fairly stable over time, the actual Average historical Average level level suggested by the model Part number Units Days Units Days Aggregate 81,606 11.0 77,643 10.7 XA1(A) 32,351 11.2 24,625 8.4 XA2(A) 26,625 22.1 27,147 23.7 XB(B) 21,111 9.8 18,186 8.2 XC(C) 44,109 9.6 43,414 9.3 Table 2: The historical average inventory levels were fairly close to aver age inventory levels suggested by the model as of May
  • 41. 27,1999. system inventory levels fluctuated widely (Figure 7). The average system inventory levels were close to those suggested by the model, but the actual num ber of units in the system at any time differed drasti cally from the number required. For example, around February 1, 1999, the model showed that the sys tem should have held nine to 11 days of inventory to handle expected fluctuations in demand and sup ply. However, the actual number in the system was close to 18 days of inventory. The extra seven days of inventory in the revolver were costly for the supplier. Likewise, in the beginning of March, Dell was carry ing five to seven days worth of inventory, while the model showed that eight to 10 days were required. This means Dell was at a much higher risk of stock ing out during that period. Clearly Dell should avoid such huge fluctuations. The systematic ordering pol icy we proposed will eliminate most of them and make Dell aware of the remaining ones. 10 t Actual Inventory Order-up-to Level - Average Recommended Inventory Reorder Point 12/01/98 01/20/99 03/11/99 04/30/99 Figure 7: Although on average actual XC inventory was close
  • 42. to the average recommended by the model, the indi vidual observations indicate that most of the time the actuals differed from the recommended levels significantly. This content downloaded from 141.217.20.120 on Wed, 13 Feb 2019 19:24:25 UTC All use subject to https://about.jstor.org/terms Kapuscinski et al.: Inventory Decisions in Dell's Supply Chain 202 Interfaces 34(3), pp. 191-205, ?2004 INFORMS These two examples illustrate the potential bene fits of a management tool like the proposed inventory model that can quantify the inventory needed in the system at any time. Dell's buyer-planners who mon itor the inventory levels should communicate with suppliers and require inventory levels based on the model's recommendations to prevent Dell from risk ing a stock-out or paying for unnecessary inventory. Inventory Percentage Drivers One of the important features of the model is its ability to categorize causes of required inventory. We analyzed the historical data for XDX and found that attach variance and pull variance each contributed 20 to 25 percent to the total inventory. After hearing several suppliers complain about the clumpy pull, we expected the pull variance to be nonnegligible. The attach variance shows that Dell's forecasts at the com modity level leave room for further refinement (Fig ure 8). We broke down the drivers for inventory based on the following assumptions:
  • 43. ?The supplier handicap was one day based on the procurement team's experience with supplier delay, ?the replenishment time variance was (one day)2, and ?the aggregate variance we assumed to be zero because no data were available. (Should the data become available, they would not change the aggre gate level of inventory recommended but would alter the breakdown percentages.) Around 15 percent of the total inventory is associ ated with par. If there were no variance in the entire manufacturing system, Dell would need only 15 per cent of the inventory it needed at the time of our study. Granted, problems and fluctuations will always exist, but this lower bound shows that Dell has tremendous Supplier Handicap (Days) Pull (or Supplier Part) Variance (Days) Attach (or Component) Variance (Days) Replenishment Time Variance (Days) Par (Days)
  • 44. Figure 8: This breakdown of total inventory shows the inventory associated with the drivers of inventory (based on historical data). room for inventory reductions if it can implement and sustain the recommended improvements. Days of Inventory vs. Units of Inventory Dell and its suppliers describe inventory levels in terms of days of supply. Days of supply is a much more stable measure than units of inventory. As long as target service levels remain unchanged over a given period and demand does not change dramat ically, days of inventory will not vary significantly. (When the coefficient of variation is constant, days of inventory should remain constant.) However, the actual units of inventory may change over time as demand changes (Figures 9 and 10). The compo nent has a recommended inventory level of close to 60 days for nearly the entire product life span, yet the actual reorder points fluctuate widely. In particu lar, there is a dramatic drop in recommended days of inventory in early January 1999. Although the recom mended days of inventory decrease, the units recom mended do not because the average demand per day is rapidly increasing (Figure 10). The day calculation is an average of 10 future days' forecasts; in this case, the forecasts were increasing rapidly. Furthermore, two more factors amplify the level of fluctuation: the historical service level of 99 percent and the tremen dous supplier pull variance. This example shows why it is important for the buyer-planners to manage inventory in terms of both units and days. The combi
  • 45. nation of the two charts will allow better understand ing and improved decisions, which should translate into decreased costs for Dell and its suppliers. While we believe that days of inventory will remain the pri mary tool for deciding how much to order, buyer planners can use graphs of units of inventory to see whether the requirements for a given part are stable or changing. They can interpret any difference between the targeted number of days and the actual number of days of inventory into monetary exposure from holding too much or too little inventory. Our model does not capture ramp-up and ramp down scenarios. XA2 was in its ramp-down phase between late March and early April of 1999, after which Dell ceased using the product. Looking at both graphs of units of inventory and days of inventory, however, one can easily recognize such ramp-down and ramp-up periods. Our results highlight the degree of error in the fore casts suppliers were using and should encourage Dell to investigate why the error was higher than expected (for example, Dell may not have informed the sup pliers promptly of changes or Dell may have delayed a product launch because of a quality problem). This should spark Dell's immediate action to correct data frequently and improve its business process. Furthermore, the high inventory level should encourage Dell to reconsider the optimal service level This content downloaded from 141.217.20.120 on Wed, 13 Feb 2019 19:24:25 UTC
  • 46. All use subject to https://about.jstor.org/terms Kapuscinski et al.: Inventory Decisions in Dell's Supply Chain Interfaces 34(3), pp. 191-205, ?2004 INFORMS 203 Order-up-to Level Average Recommended Inventory Reorder Point -Actual Inventory 12/01/98 01/20/99 03/11/99 04/30/99 Figure 9: The XA2 component has a recommended inventory level close to 60 days, but the actual reorder points fluctuate widely. The recommended days of inventory decreased at the end of December and beginning of January because the forecasts were growing rapidly. 120,000 100,000 4 80,000 4 60,000 40,000 4 20,000 Order-up-to Level
  • 47. Average Recommended Inventory Reorder Point Actual Inventory 12/01/98 01/20/99 03/11/99 04/30/99 Figure 10: The recommended units of XA2 inventory increase in January due to increased demand. This content downloaded from 141.217.20.120 on Wed, 13 Feb 2019 19:24:25 UTC All use subject to https://about.jstor.org/terms Kapuscinski et al.: Inventory Decisions in Dell's Supply Chain 204 Interfaces 34(3), pp. 191-205, ?2004 INFORMS for a supplier. Dell specified that it wanted to main tain the existing service levels initially. A service level of 99 percent is extremely high and most likely exces sive given the data we collected. For this compo nent, Dell could operate with a lower level of supplier service. Trial Implementation and Impact After we analyzed the data and developed the tools, we moved to initial implementation. We conducted several tutorials, during which we discussed the the ory behind the model and the specific instructions for using the tools (in Excel format). The goal of the tutorials varied depending on the
  • 48. group targeted. For instance, in training the buyer planners of XDXs, we focused on using the tactical tool (to set inventory levels and track them); whereas in training the supply-chain-optimization team, we stressed the theory behind the model and the drivers of inventory levels (so that they could conduct improvement projects and quantify their impact). In a tutorial for all of the XDX suppliers, we concentrated on Dell's efforts to reduce the inventories it required them to hold and asked them to help Dell to collect the data needed to run the model. We also assessed the improvement projects we identified earlier. Other supply-chain-optimization team members were identified as leaders for these projects, and we roughly quantified the effects some of the improvement projects will have on Dell and its suppliers. Finally, we discussed our project with teams for commodities other than XDX with the idea of find ing commodities most appropriate for analysis with our model and validating the model's assumptions for other commodities. The vocabulary we introduced in our project per sists at Dell, particularly par and handicap. Dell has started other projects to eliminate elements of its handicap. It has defined sources of variability and linked various variance-increasing and variance decreasing actions to costs and benefits. On a tactical level, our project led to Dell's implementing tools to identify optimal inventory levels. We analyzed a number of scenarios to estimate the financial impact of various improvement projects.
  • 49. Using the model to extrapolate savings across all XDXs, we calculated the cost savings Dell could achieve by reducing inventory. We used inventory drivers and the corresponding breakdown of inven tory costs to estimate the reductions in inventory that could be achieved through various improvements. Eliminating the clumpy pull, reducing the replen ishment time by 25 percent, doubling the delivery frequency, and reducing the attach-rate error through scheduling methods would all help to decrease inventory. Using specific estimates (for price erosion, storage charges, and costs of parts), we estimated that Dell could reduce the current 10.5 days average inventory level by 38 percent. By removing approxi mately four days of safety-stock inventory, Dell could achieve perpetual savings for all XDXs that will pass through the revolver in the future. The resulting NPV of savings is $43 million, at an eight percent cost of capital. While the actual implementation for XDX is still under way, Dell has used the model to set tar get inventory levels for networking accessories at the revolvers. So far Dell has decreased inventories for its PowerConnect line of business from 20 days to between 10 and 15 days, which is close to the target of 10 days recommended by the model, and it expects estimated annual savings of $2.7 million. These benefits are likely lower than the true savings possible as they ignore the facts that Dell does not implement the current inventory policy consistently (the Z-scores are not stable) and does not set service levels correctly, basing them on historical service lev els. Consequently, we expect actual savings to be even
  • 50. higher than our estimates. Throughout the project, we concentrated on a basic solution and showed its use as not only a tactical, but also a diagnostic tool. If such a tool yields savings for a fairly sophisticated manufacturer like Dell Inc., most likely it would also benefit other companies with similar supply-chain issues. We presented the model to all the stakeholders and prepared the buyer-planners to use it before we departed. Also, the project was awarded the second prize at the Spotlight (a formal festive presentation of results from all TMI projects) held at the University of Michigan in September 1999. A second TMI team continued the project, focusing on decreasing variance on the suppliers' side, and a third team focused on an efficient process for collecting and maintaining the inputs to the model. References Bass, F. M. 1969. A new product growth for model consumer durables. Management Sei. 15(5) 215-227. Dell, M., J. Magretta. 1998. The power of virtual integration: An interview with Dell Computer's Michael Dell. Harvard Bus. Rev. 76(2) 72-84. Kurawarwala, A. A., H. Matsuo. 1996. Forecasting and inven tory management of short life-cycle products. Oper. Res. 44(1) 131-150.
  • 51. Nahmias, S. 1997. Production and Operations Analysis, 3rd ed. Irwin, Boston, MA. Dick Hunter, Vice President, Americas Manufac turing Operations, Dell Inc., One Dell Way, Round Rock, Texas 78682-2244, writes: "Thank you for the This content downloaded from 141.217.20.120 on Wed, 13 Feb 2019 19:24:25 UTC All use subject to https://about.jstor.org/terms Kapuscinski et al.: Inventory Decisions in Dell's Supply Chain Interfaces 34(3), pp. 191-205, ?2004 INFORMS 205 opportunity to describe the benefits that Dell Com puter Corporation has experienced by implementing the Inventory Analysis model in our supply chain. A team of University of Michigan Tauber Manufactur ing Institute students and professors developed this model with us in 1999. This model and corresponding logic changed our thinking by directing us to focus on the drivers of variation in our supply chain as a key method to reduce inventory and improve velocity. "Understanding the variation drivers quantified in this model, we have taken action to change how we pull inventory from supplier logistics centers into our factories. As a result, our suppliers see a more linear, predictable pull of product. For Dell, this means that supply continuity becomes more robust as suppliers are better able to handle unforecasted upsides.
  • 52. "Supplier logistics center inventory levels have not been reduced so far; rather we have increased our service level to our factories and customers. Dell's ability to deliver quality systems to our customers has increased since inventory previously in place to han dle pull-variation is now able to extend our imple mentation time for quality improvements. Similarly, exogenous factors such as overseas natural disasters are less likely to impact the velocity with which we deliver our systems. "A systematic reduction of inventory using this model requires an integrated solution with a signif icant I/T investment. Dell is working towards that direction based on the model algorithms to minimize channel inventory and reap the benefits of increased service levels through reduced variation." This content downloaded from 141.217.20.120 on Wed, 13 Feb 2019 19:24:25 UTC All use subject to https://about.jstor.org/terms Contents191192193194195196197198199200201202203204205I ssue Table of ContentsInterfaces, Vol. 34, No. 3 (May - Jun., 2004), pp. 171-244Front MatterMetrics for Managing Online Procurement Auctions [pp. 171-179]Allocating Vendor Risks in the Hanford Waste Cleanup [pp. 180-190]Inventory Decisions in Dell's Supply Chain [pp. 191-205]Practice Abstracts [pp. 206- 207]Schlumberger Optimizes Receiver Location for Automated Meter Reading [pp. 208-214]The Slab-Design Problem in the Steel Industry [pp. 215-225]Decision Rules for the Academy Awards versus Those for Elections [pp. 226-234]Book ReviewsReview: untitled [pp. 235-236]Review: untitled [pp. 236-237]Review: untitled [pp. 237-238]Review: untitled [pp. 238-239]Review: untitled [pp. 239-240]Books Received for Review [pp. 240-241]Back Matter
  • 53. Reproduced with permission of the copyright owner. Further reproduction prohibited without permission. Dell's Supply Chain DNA Fugate, Brian S;Mentzer, John T Supply Chain Management Review; Oct 2004; 8, 7; Business Premium Collection pg. 20 Reproduced with permission of the copyright owner. Further reproduction prohibited without permission. Reproduced with permission of the copyright owner. Further reproduction prohibited without permission. Reproduced with permission of the copyright owner. Further reproduction prohibited without permission. Reproduced with permission of the copyright owner. Further reproduction prohibited without permission.
  • 54. MGT 542 Individual In-Depth Case Study Undergraduate Requirement 50 Points per Weekly Submission 1) Read the two identified Dell articles and answer all the questions listed below. You can find the articles in the content tab in Blackboard titled “Course Reserves”. 2) Each question should be answered with a minimum of one paragraph. A paragraph is a minimum of 3 complete sentences. 3) A minimum of 4 pages per submission of written content is required. Some sections will require more pages to fulfill the requirements of the rubric and the in-depth case study instructions listed here. 4) APA format is required. 5) A minimum of 2 additional sources per submission are required to be cited. 6) A bibliography with all citations, including the given articles, is required. 7) There will be four in-depth case study submissions. Please reference the course schedule in the syllabus for the required dates of each submission. SECTION 1 - 50 Points Kapuscinski, R., Zhang, R.Q., Carbonneau, P., Moore, R., & Reeves, B. (2004). Inventory Decisions in Dell’s Supply Chain, Interfaces 34(3), 191-205. 1. Describe the Supply Chain Business Model used by Dell. 2. How does Dell Supply Chain benefit from low inventory levels? 3. What does Dell do to help their suppliers make optimum ordering decisions?
  • 55. 4. Describe Dell’s relationship with their suppliers. 5. Describe the revolver inventory model. 6. Describe the purpose of the golf analogy as it relates to inventory concepts. Include the analogy for the handicap (Dell’s and the Supplier’s). 7. What is the purpose of safety stock and how is it controlled? SECTION 2 – 50 Points Kapuscinski, R., Zhang, R.Q., Carbonneau, P., Moore, R., & Reeves, B. (2004). Inventory Decisions in Dell’s Supply Chain, Interfaces 34(3), 191-205. 8. Describe the impact of the pull variance if a commodity is multi-sourced. a. Explain how an uneven pull from different suppliers of the same commodity effect the suppliers’ inventory levels, planning, and forecasting. 9. The balancing act: Discuss the cost of underage and overage as it relates to inventory 10. The article references “Z scores” as the system inventory levels just before orders are placed to understand Dell’s method of making ordering decisions. Explain the logic of why there was significant volatility found of the “Z scores”. 11. Forecast errors are an input in determining the optimal inventory levels. In Dell’s case, it was found the forecast errors at the commodity level were not independent from time period to time period. Why was this the case and what could be done differently to minimize forecast error? 12. Explain the impact of the actual system inventory level fluctuations. What are the benefits and risks. Should high fluctuations be avoided? 13. Discuss describing inventory levels in terms of “days of supply” vs. “units of inventory”. What would you recommend and why? 14. Is 100% service level an ideal recommendation? Why or why not? How does this impact inventory levels?
  • 56. Section 3 – 50 Points Fugate, B.S., Mentzer, J.T. (2004). Dell’s Supply Chain DNA, Supply Chain Management Review; October 20-24. 1. What are the four qualities of Dell’s supply chain competency? 2. Describe the concept of each one individually. 3. Discuss the Business Process Improvement that shifted Dell from brand-specific assembly plants to generic factories. Why was this successful? Section 4 – 50 Points Final Questions 1. What advice would you have for Dell’s Supply Chain business model? What would you do differently? Why? 2. What are the main challenges in front of Dell in reducing inventory while maintaining their Direct Sales model? 3. What inventory reduction improvement initiatives would you recommend? 4. What would you recommend that Dell try differently to further optimize their supply chain? 2