Evaluation of Variability and Combinability of Fecal Calprotectin (FCP) Results Based on the Extraction Process of Calprotectin from Stool Samples

AACC 2019 -- Calprotectin is a calcium-heterodimer protein which is abundant in the cytoplasm of neutrophils. This is a biomarker with good sensitivity and specificity in case of inflammatory Bowel disease (IBD) which is a chronic inflammatory gut. In case of IBD, neutrophils from the inflammatory area release calprotectin, which leads to its increased levels in stool samples. Calprotectin is measured in extracted stools. There are several extraction devices that are commercially available as well a manual weigh-in method, "Gold Standard" method. The homogeneity of stool sample and the neutrophil levels in the sample affect the precision of the results from the same stool sample. Our study compares 2 commercial stool extraction devices with the manual weigh-in method as well as the variability within each extraction method.
Recommended

Recommended
More Related Content
Similar to Evaluation of Variability and Combinability of Fecal Calprotectin (FCP) Results Based on the Extraction Process of Calprotectin from Stool Samples
Similar to Evaluation of Variability and Combinability of Fecal Calprotectin (FCP) Results Based on the Extraction Process of Calprotectin from Stool Samples (20)
More from Covance
More from Covance (20)
Recently uploaded
Recently uploaded (20)
Evaluation of Variability and Combinability of Fecal Calprotectin (FCP) Results Based on the Extraction Process of Calprotectin from Stool Samples
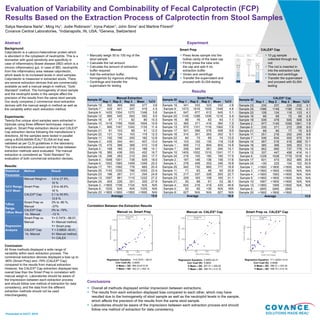
- 1. Evaluation of Variability and Combinability of Fecal Calprotectin (FCP) Results Based on the Extraction Process of Calprotectin from Stool Samples Satya Nandana Narla1, Ming Hu1, Jodie Robinson1, Iryna Patzer1, John Sims1 and Martine Florent2 Covance Central Laboratories, 1Indianapolis, IN, USA; 2Geneva, Switzerland Abstract Background: Calprotectin is a calcium-heterodimer protein which is abundant in the cytoplasm of neutrophils. This is a biomarker with good sensitivity and specificity in case of inflammatory Bowel disease (IBD) which is a chronic inflammatory gut. In case of IBD, neutrophils from the inflammatory area release calprotectin, which leads to its increased levels in stool samples. Calprotectin is measured in extracted stools. There are several extraction devices that are commercially available as well a manual weigh-in method, “Gold Standard” method. The homogeneity of stool sample and the neutrophil levels in the sample affect the precision of the results from the same stool sample. Our study compares 2 commercial stool extraction devices with the manual weigh-in method as well as the variability within each extraction method. Experiments: Twenty-five unique stool samples were extracted in triplicate using three different techniques: manual weigh-in, Smart Prep extraction device and CALEX® Cap extraction device following the manufacturer’s directions. All the samples were tested in parallel using a BÜHLMANN fCAL® ELISA kit that was validated as per CLSI guidelines in the laboratory. The intra-extraction precision and the bias between extraction methods were evaluated. The manual extraction is considered as “Gold Standard” for evaluation of both commercial extraction devises. Results: Conclusion: All three methods displayed a wide range of variability within each extraction process. The commercial extraction devices displayed a bias up to -80% (Smart Prep) and -79% (CALEX® Cap) compared to the results from manual extraction. However, the CALEX® Cap extraction displayed less overall bias than the Smart Prep in correlation with manual weigh-in. Laboratories should be aware of the imprecision between each extraction process and should follow one method of extraction for data consistency, and the data from the different extraction methods should not be used interchangeably. Sample ID Smart Prep Rep 1 Rep 2 Rep 3 Mean %CV Sample 19 341 333 323 332 2.8 Sample 9 1473 1616 1555 1548 4.6 Sample 6 647 677 612 645 5.1 Sample 20 1145 1298 1206 1216 6.4 Sample 16 88 76 83 83 7.1 Sample 12 365 371 416 384 7.3 Sample 13 970 1101 1116 1062 7.5 Sample 17 501 596 576 558 9.0 Sample 18 314 301 263 292 9.1 Sample 22 84 73 65 74 13.2 Sample 14 103 120 135 119 13.8 Sample 1 958 712 894 855 14.9 Sample 7 258 344 281 294 15.1 Sample 10 1405 1002 1315 1241 17.1 Sample 24 219 155 180 185 17.5 Sample 2 187 146 136 156 17.6 Sample 3 278 408 353 346 18.8 Sample 25 942 730 660 777 18.9 Sample 11 71 63 46 60 20.9 Sample 15 217 337 326 293 22.7 Sample 23 209 163 109 160 31.1 Sample 21 30 69 61 53 38.1 Sample 4 624 216 419 420 48.6 Sample 5 32 65 <30 N/A N/A Sample 8 627 N/A N/A 627 N/A Average 16.0 Sample ID Manual Extraction Rep 1 Rep 2 Rep 3 Mean %CV Sample 19 392 369 369 377 3.6 Sample 7 420 401 437 419 4.3 Sample 9 1420 1354 1270 1348 5.6 Sample 12 580 545 650 592 9.0 Sample 16 87 71 82 80 10.3 Sample 10 1419 1766 1626 1604 10.9 Sample 1 990 1167 1242 1133 11.4 Sample 21 81 103 89 91 12.2 Sample 22 131 124 103 119 12.3 Sample 11 192 156 200 182 12.8 Sample 2 435 344 441 407 13.4 Sample 15 475 388 368 410 13.8 Sample 5 168 180 219 189 14.1 Sample 18 385 438 533 452 16.7 Sample 14 296 283 210 263 17.7 Sample 4 1048 1001 738 929 18.0 Sample 6 1052 1585 1409 1349 20.2 Sample 17 781 1092 778 883 20.4 Sample 25 1145 1230 786 1053 22.4 Sample 23 186 267 311 254 24.9 Sample 13 1597 961 1110 1222 27.2 Sample 24 404 226 331 320 27.9 Sample 3 >1800 1706 1724 N/A N/A Sample 8 1025 N/A N/A 1025 N/A Sample 20 >1800 >1800 >1800 >1800 N/A Average 15.0 Sample ID CALEX® Cap Rep 1 Rep 2 Rep 3 Mean %CV Sample 23 235 237 224 232 3.1 Sample 25 1096 1149 1190 1145 4.1 Sample 22 128 124 118 123 4.1 Sample 16 66 69 72 69 4.3 Sample 19 539 479 505 508 5.9 Sample 2 977 1145 1059 1061 7.9 Sample 5 235 271 272 259 8.0 Sample 21 68 80 77 75 8.5 Sample 11 251 216 252 240 8.6 Sample 7 536 634 555 575 9.0 Sample 14 467 516 416 466 10.7 Sample 18 385 368 305 353 12.0 Sample 15 902 690 737 776 14.3 Sample 12 337 447 458 414 16.1 Sample 6 1228 1539 1779 1516 18.2 Sample 17 631 473 352 485 28.8 Sample 24 <30 220 104 162 50.9 Sample 1 >1800 >1800 >1800 N/A N/A Sample 3 >1800 >1800 >1800 N/A N/A Sample 4 >1800 1583 >1800 N/A N/A Sample 9 >1800 >1800 >1800 N/A N/A Sample 10 1697 >1800 >1800 N/A N/A Sample 13 >1800 1569 >1800 N/A N/A Sample 8 QNS QNS QNS Sample 20 >1800 >1800 >1800 Average 12.6 Regression Equation: Y=0.747X – 68.57 Corr Coef (R): 0.8090 X Mean ± SD: 684.03±512.44 Y Mean ± SD: 442.21 ± 404.14 Regression Equation: 0.890X-40.41 Corr Coef (R): 0.8835 X Mean ± SD: 607.01 ± 458.05 Y Mean ± SD: 499.75 ± 413.16 Regression Equation: Y=1.225X+14.41 Corr Coef (R): 0.9096 X Mean ± SD: 396.31 ± 343.54 Y Mean ± SD: 499.75 ± 413.16 Experiment Results Conclusions Manual vs. Smart Prep Manual vs. CALEX® Cap Smart Prep vs. CALEX® Cap Correlation Between the Extraction Results Manual ▶ Manually weigh 50 to 100 mg of the stool sample ▶ Calculate the net amount ▶ Calculate the amount of extraction buffer required ▶ Add the extraction buffer, homogenize by vigorous shacking ▶ Centrifuge and transfer the supernatant for testing CALEX® Cap ▶ 10 µg sample collected through the rod ▶ The rod is inserted in into the extraction tube ▶ Vortex and centrifuge ▶ Transfer the supernatant and proceed with ELISA testing ▶ Overall all methods displayed similar imprecision between extractions. ▶ The results from each extraction displayed bias compared to each other, which may have resulted due to the homogeneity of stool sample as well as the neutrophil levels in the sample, which affects the precision of the results from the same stool sample. ▶ Laboratories should be aware of the imprecision between each extraction process and should follow one method of extraction for data consistency. Smart Prep ▶ Press feces sample into the hollow cavity of the base cap ▶ Firmly press the tube onto the cap and add 4 mL extraction buffer ▶ Vortex and centrifuge ▶ Transfer the supernatant and proceed with ELISA testing Tube Base Cap Presented at AACC 2019 Statistical Parameter Method Result %CV Range, %CV Mean Manual Weigh-in 3.6 to 27.9%, 15 % Smart Prep 2.8 to 48.6%, 16 % CALEX® Cap 3.1 to 50.9%, 12.6 % %Bias Range, %Bias Mean Smart Prep vs. Manual 3% to -80 %, -37% CALEX® Cap Vs. Manual 0% to -79%, -13 % Regression Analysis Smart Prep vs. Manual Y= 0.747X - 68.57, X= Manual method, Y= Smart prep CALEX® Cap Vs. Manual Y = 0.890X- 40.41, X= Manual method, Y= CALEX