SlideShare a Scribd company logo
1 of 1
Download to read offline
1 Aged < 18 years
2 "Yes" response to "Do you still have asthma?"
3 Attended school or daycare outside the home. Home Schooled are excluded.
± Sample size is for multiple years of participation. Responses of "Don't Know" and "Refused" are excluded.
§ Standard error
† Confidence interval
State/Territory
Current
Sample
size± % SE§ 95% CI†
Arizona 114 38.8 7.3 (24.5 - 53.1)
California 162 27.3 4.5 (18.5 - 36.1)
Connecticut 336 45.1 3.7 (37.8 - 52.4)
District of Columbia 111 36.8 5.7 (25.6 - 48.0)
Georgia 325 41.5 3.8 (34.1 - 48.9)
Hawaii 399 21.3 2.5 (16.4 - 26.2)
Illinois 167 36.6 5.0 (26.8 - 46.4)
Indiana 325 39.3 3.5 (32.4 - 46.2)
Iowa 245 34.0 3.6 (26.9 - 41.1)
Kansas 576 37.0 2.4 (32.3 - 41.7)
Louisiana 100 46.6 6.0 (34.8 - 58.4)
Maine 280 51.5 3.4 (44.8 - 58.2)
Maryland 367 44.5 3.5 (37.6 - 51.4)
Massachusetts 264 43.8 4.5 (35.0 - 52.6)
Michigan 469 31.8 2.8 (26.3 - 37.3)
Mississippi 69 40.9 7.8 (25.6 - 56.2)
Missouri 223 45.6 5.0 (35.8 - 55.4)
Montana 206 32.4 4.3 (24.0 - 40.8)
Nebraska 479 53.1 3.8 (45.7 - 60.5)
New Hampshire 147 40.8 5.0 (31.0 - 50.6)
New Jersey 289 54.9 4.0 (47.1 - 62.7)
New Mexico 227 38.1 4.4 (29.5 - 46.7)
New York 275 43.1 4.0 (35.3 - 50.9)
North Dakota 99 42.4 5.8 (31.0 - 53.8)
Ohio 209 39.2 4.8 (29.8 - 48.6)
Oklahoma 237 40.2 3.9 (32.6 - 47.8)
Oregon 184 32.7 4.4 (24.1 - 41.3)
Pennsylvania 123 55.2 5.5 (44.4 - 66.0)
Rhode Island 154 40.5 5.2 (30.3 - 50.7)
Texas 461 43.2 3.7 (35.9 - 50.5)
Utah 351 26.8 3.1 (20.7 - 32.9)
Vermont 380 45.9 3.1 (39.8 - 52.0)
Virginia 81 59.8 7.8 (44.5 - 75.1)
Washington 330 37.9 3.3 (31.4 - 44.4)
West Virginia 189 34.7 3.9 (27.1 - 42.3)
Wisconsin 136 47.2 6.0 (35.4 - 59.0)
36 state total 9,089 40.4 1.1 (38.2 - 42.6)
Median 40.7
Range 21.3-59.8
TABLE 13. Estimated percent with an asthma
management plan at school or daycare among
1 2children with current asthma status who attended
3school or daycare in the past year by state/territory
BRFSS Asthma Call-back Survey, UnitedStates, 2006
2010
Page 1 of 1

­
­
file://cdcprojectNCEH_EHHE_APRHB_All Team foldersSurveillance TeamCall-bac... 9/19/2012

More Related Content

Viewers also liked

Afghanistan Presentation
Afghanistan PresentationAfghanistan Presentation
Afghanistan PresentationJordan Pullin
 
Offre d'emploi - Développeur Java - Bruxelles
Offre d'emploi - Développeur Java - BruxellesOffre d'emploi - Développeur Java - Bruxelles
Offre d'emploi - Développeur Java - BruxellesJoëlle Atisy
 
La société de la connaissance
La société de la connaissanceLa société de la connaissance
La société de la connaissanceXXIesiecle
 
Building a consensus for the electronic health record
Building a consensus for the electronic health recordBuilding a consensus for the electronic health record
Building a consensus for the electronic health recordNursing353
 

Viewers also liked (8)

indoor outdoor plant
 indoor outdoor plant indoor outdoor plant
indoor outdoor plant
 
Afghanistan Presentation
Afghanistan PresentationAfghanistan Presentation
Afghanistan Presentation
 
Offre d'emploi - Développeur Java - Bruxelles
Offre d'emploi - Développeur Java - BruxellesOffre d'emploi - Développeur Java - Bruxelles
Offre d'emploi - Développeur Java - Bruxelles
 
11 egemn
11 egemn11 egemn
11 egemn
 
La société de la connaissance
La société de la connaissanceLa société de la connaissance
La société de la connaissance
 
Building a consensus for the electronic health record
Building a consensus for the electronic health recordBuilding a consensus for the electronic health record
Building a consensus for the electronic health record
 
Android
AndroidAndroid
Android
 
BPI Nite-Burn
BPI Nite-BurnBPI Nite-Burn
BPI Nite-Burn
 

More from Adrienne Classen

Mental health care facts from the aap
Mental health care facts from the aapMental health care facts from the aap
Mental health care facts from the aapAdrienne Classen
 
Mental health care statistics
Mental health care statisticsMental health care statistics
Mental health care statisticsAdrienne Classen
 
Trends in child and overweight
Trends in child and overweightTrends in child and overweight
Trends in child and overweightAdrienne Classen
 
Disability Prevalence by State
Disability Prevalence by StateDisability Prevalence by State
Disability Prevalence by StateAdrienne Classen
 
Number of Children with Disabilities
Number of Children with DisabilitiesNumber of Children with Disabilities
Number of Children with DisabilitiesAdrienne Classen
 
Percentage of Children with Disabilities
Percentage of Children with DisabilitiesPercentage of Children with Disabilities
Percentage of Children with DisabilitiesAdrienne Classen
 
20120726 cspan disability_slides_6
20120726 cspan disability_slides_620120726 cspan disability_slides_6
20120726 cspan disability_slides_6Adrienne Classen
 
2011 Unemployment rates by County
2011 Unemployment rates by County2011 Unemployment rates by County
2011 Unemployment rates by CountyAdrienne Classen
 
Percent Population living in poverty
Percent Population living in povertyPercent Population living in poverty
Percent Population living in povertyAdrienne Classen
 
Number of Physicians in different specialties
Number of Physicians in different specialtiesNumber of Physicians in different specialties
Number of Physicians in different specialtiesAdrienne Classen
 
North Carolina unemployment 2009 to 2012
North Carolina unemployment 2009 to 2012North Carolina unemployment 2009 to 2012
North Carolina unemployment 2009 to 2012Adrienne Classen
 
NC Median Household Income
NC Median Household IncomeNC Median Household Income
NC Median Household IncomeAdrienne Classen
 
Counties receiving snap benefits
Counties receiving snap benefitsCounties receiving snap benefits
Counties receiving snap benefitsAdrienne Classen
 
Child and Adolescent Obesity
Child and Adolescent ObesityChild and Adolescent Obesity
Child and Adolescent ObesityAdrienne Classen
 
2014 Health Factors North Carolina 2
2014 Health Factors North Carolina 22014 Health Factors North Carolina 2
2014 Health Factors North Carolina 2Adrienne Classen
 

More from Adrienne Classen (20)

Mental health outcomes
Mental health outcomesMental health outcomes
Mental health outcomes
 
Mental health care facts from the aap
Mental health care facts from the aapMental health care facts from the aap
Mental health care facts from the aap
 
Mental health care statistics
Mental health care statisticsMental health care statistics
Mental health care statistics
 
Trends in child and overweight
Trends in child and overweightTrends in child and overweight
Trends in child and overweight
 
Afc prevalence 06_table9
Afc prevalence 06_table9Afc prevalence 06_table9
Afc prevalence 06_table9
 
Disability Prevalence by State
Disability Prevalence by StateDisability Prevalence by State
Disability Prevalence by State
 
Number of Children with Disabilities
Number of Children with DisabilitiesNumber of Children with Disabilities
Number of Children with Disabilities
 
Percentage of Children with Disabilities
Percentage of Children with DisabilitiesPercentage of Children with Disabilities
Percentage of Children with Disabilities
 
20120726 cspan disability_slides_6
20120726 cspan disability_slides_620120726 cspan disability_slides_6
20120726 cspan disability_slides_6
 
2011 Unemployment rates by County
2011 Unemployment rates by County2011 Unemployment rates by County
2011 Unemployment rates by County
 
Poverty Rate chart
Poverty Rate chartPoverty Rate chart
Poverty Rate chart
 
Percent Population living in poverty
Percent Population living in povertyPercent Population living in poverty
Percent Population living in poverty
 
Number of Physicians in different specialties
Number of Physicians in different specialtiesNumber of Physicians in different specialties
Number of Physicians in different specialties
 
North Carolina unemployment 2009 to 2012
North Carolina unemployment 2009 to 2012North Carolina unemployment 2009 to 2012
North Carolina unemployment 2009 to 2012
 
Manufacturing Employment
Manufacturing EmploymentManufacturing Employment
Manufacturing Employment
 
NC Median Household Income
NC Median Household IncomeNC Median Household Income
NC Median Household Income
 
Counties receiving snap benefits
Counties receiving snap benefitsCounties receiving snap benefits
Counties receiving snap benefits
 
Child and Adolescent Obesity
Child and Adolescent ObesityChild and Adolescent Obesity
Child and Adolescent Obesity
 
2015 Map
2015 Map2015 Map
2015 Map
 
2014 Health Factors North Carolina 2
2014 Health Factors North Carolina 22014 Health Factors North Carolina 2
2014 Health Factors North Carolina 2
 

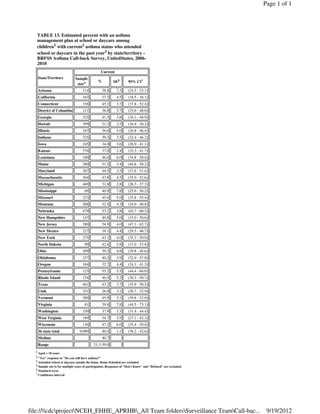
Afc prevalence 06_table13

  • 1. 1 Aged < 18 years 2 "Yes" response to "Do you still have asthma?" 3 Attended school or daycare outside the home. Home Schooled are excluded. ± Sample size is for multiple years of participation. Responses of "Don't Know" and "Refused" are excluded. § Standard error † Confidence interval State/Territory Current Sample size± % SE§ 95% CI† Arizona 114 38.8 7.3 (24.5 - 53.1) California 162 27.3 4.5 (18.5 - 36.1) Connecticut 336 45.1 3.7 (37.8 - 52.4) District of Columbia 111 36.8 5.7 (25.6 - 48.0) Georgia 325 41.5 3.8 (34.1 - 48.9) Hawaii 399 21.3 2.5 (16.4 - 26.2) Illinois 167 36.6 5.0 (26.8 - 46.4) Indiana 325 39.3 3.5 (32.4 - 46.2) Iowa 245 34.0 3.6 (26.9 - 41.1) Kansas 576 37.0 2.4 (32.3 - 41.7) Louisiana 100 46.6 6.0 (34.8 - 58.4) Maine 280 51.5 3.4 (44.8 - 58.2) Maryland 367 44.5 3.5 (37.6 - 51.4) Massachusetts 264 43.8 4.5 (35.0 - 52.6) Michigan 469 31.8 2.8 (26.3 - 37.3) Mississippi 69 40.9 7.8 (25.6 - 56.2) Missouri 223 45.6 5.0 (35.8 - 55.4) Montana 206 32.4 4.3 (24.0 - 40.8) Nebraska 479 53.1 3.8 (45.7 - 60.5) New Hampshire 147 40.8 5.0 (31.0 - 50.6) New Jersey 289 54.9 4.0 (47.1 - 62.7) New Mexico 227 38.1 4.4 (29.5 - 46.7) New York 275 43.1 4.0 (35.3 - 50.9) North Dakota 99 42.4 5.8 (31.0 - 53.8) Ohio 209 39.2 4.8 (29.8 - 48.6) Oklahoma 237 40.2 3.9 (32.6 - 47.8) Oregon 184 32.7 4.4 (24.1 - 41.3) Pennsylvania 123 55.2 5.5 (44.4 - 66.0) Rhode Island 154 40.5 5.2 (30.3 - 50.7) Texas 461 43.2 3.7 (35.9 - 50.5) Utah 351 26.8 3.1 (20.7 - 32.9) Vermont 380 45.9 3.1 (39.8 - 52.0) Virginia 81 59.8 7.8 (44.5 - 75.1) Washington 330 37.9 3.3 (31.4 - 44.4) West Virginia 189 34.7 3.9 (27.1 - 42.3) Wisconsin 136 47.2 6.0 (35.4 - 59.0) 36 state total 9,089 40.4 1.1 (38.2 - 42.6) Median 40.7 Range 21.3-59.8 TABLE 13. Estimated percent with an asthma management plan at school or daycare among 1 2children with current asthma status who attended 3school or daycare in the past year by state/territory BRFSS Asthma Call-back Survey, UnitedStates, 2006 2010 Page 1 of 1 ­ ­ file://cdcprojectNCEH_EHHE_APRHB_All Team foldersSurveillance TeamCall-bac... 9/19/2012