CDC Obesity
•
1 like•247 views

NACDD ED Summit

Recommended
More Related Content
Similar to CDC Obesity
Similar to CDC Obesity (20)
More from National Association of Councils on Developmental Disabilities
More from National Association of Councils on Developmental Disabilities (20)
Recently uploaded
Recently uploaded (20)
CDC Obesity
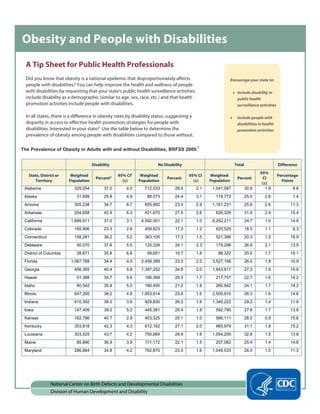
- 1. Obesity and People with Disabilities A Tip Sheet for Public Health Professionals Did you know that obesity is a national epidemic that disproportionately affects Encourage your state to: people with disabilities? You can help improve the health and wellness of people with disabilities by requesting that your state’s public health surveillance activities • Include disability in include disability as a demographic (similar to age, sex, race, etc.) and that health public health promotion activities include people with disabilities. surveillance activities In all states, there is a difference in obesity rates by disability status, suggesting a • Include people with disparity in access to effective health promotion strategies for people with disabilities in health disabilities. Interested in your state? Use the table below to determine the promotion activities prevalence of obesity among people with disabilities compared to those without. The Pre valence of Obesity in Adults with and without Disabilities, BRFSS 2009.1 Disability No Disability Total Difference State, District or Territory Weighted Population Percent2 95% CI3 (±) Weighted Population Percent 95% CI (±) Weighted Population Percent 95% CI (±) Percentage Points Alabama 329,054 37.0 4.0 712,033 28.4 2.1 1,041,087 30.8 1.9 8.6 Alaska 31,699 25.8 4.9 88,073 24.4 3.1 119,772 25.0 2.6 1.4 Arizona 305,238 34.7 6.7 855,992 23.4 2.9 1,161,231 25.6 2.6 11.3 Arkansas 204,658 42.9 6.3 421,670 27.5 2.6 626,329 31.0 2.4 15.4 California 1,699,911 37.0 3.1 4,592,301 22.1 1.0 6,292,211 24.7 1.0 14.9 Colorado 165,906 23.3 2.6 459,623 17.0 1.2 625,529 18.5 1.1 6.3 Connecticut 158,281 36.2 5.2 363,105 17.3 1.5 521,386 20.3 1.5 18.9 Delaware 50,070 37.6 5.5 125,226 24.1 2.3 175,296 26.8 2.1 13.5 District of Columbia 28,671 35.8 6.8 59,651 16.7 1.8 88,322 20.0 1.7 19.1 Florida 1,067,768 34.4 4.5 2,459,389 23.5 2.0 3,527,156 26.0 1.8 10.9 Georgia 456,365 40.4 5.8 1,387,252 24.8 2.0 1,843,617 27.3 1.9 15.6 Hawaii 51,388 34.7 5.4 166,369 20.5 1.7 217,757 22.7 1.6 14.2 Idaho 80,542 35.4 5.0 180,400 21.2 1.8 260,942 24.1 1.7 14.2 Illinois 647,295 38.2 4.8 1,853,614 23.6 1.6 2,500,910 26.3 1.6 14.6 Indiana 410,392 38.0 3.6 929,830 26.2 1.6 1,340,222 29.2 1.4 11.8 Iowa 147,409 39.2 5.2 445,381 25.4 1.8 592,790 27.6 1.7 13.8 Kansas 162,786 40.7 2.9 403,325 25.1 1.0 566,111 28.0 0.9 15.6 Kentucky 353,818 42.3 4.3 612,162 27.1 2.0 965,979 31.1 1.8 15.2 Louisiana 303,525 43.7 4.2 750,684 29.9 1.6 1,054,209 32.8 1.5 13.8 Maine 85,890 36.9 3.9 171,172 22.1 1.5 257,062 25.4 1.4 14.8 Maryland 286,664 34.8 4.2 762,870 23.5 1.6 1,049,533 26.0 1.5 11.3 National Center on Birth Defects and Developmental Disabilities Division of Human Development and Disability
- 2. Disability No Disability Total Difference State, District or Territory Weighted Population Percent 95% CI (±) Weighted Population Percent 95% CI (±) Weighted Population Percent 95% CI (±) Percentage Points Massachusetts 298,062 32.7 3.3 675,325 18.4 1.2 973,388 21.3 1.2 14.3 Michigan 648,098 41.4 3.8 1,500,701 26.3 1.5 2,148,799 29.3 1.4 15.1 Minnesota 281,194 36.8 4.9 680,652 21.4 1.8 961,847 24.4 1.7 15.4 Mississippi 224,368 42.4 3.8 489,597 31.5 1.6 713,965 34.4 1.5 10.9 Missouri 444,041 44.9 5.8 846,023 25.6 2.2 1,290,064 29.7 2.1 19.3 Montana 48,906 28.8 4.3 117,364 20.7 1.7 166,270 22.7 1.6 8.1 Nebraska 102,079 42.1 5.3 250,575 24.2 1.6 352,654 27.3 1.6 17.9 Nevada 120,939 30.6 6.2 366,389 24.3 2.9 487,329 25.9 2.7 6.3 New Hampshire 71,080 36.2 5.8 180,984 22.9 1.9 252,064 25.4 1.8 13.3 New Jersey 372,422 35.7 3.8 1,034,825 20.3 1.3 1,407,247 22.8 1.2 15.4 New Mexico 109,659 35.5 4.2 249,285 22.3 1.6 358,944 25.2 1.5 13.2 New York 1,026,948 34.9 4.3 2,348,167 21.2 1.6 3,375,115 24.0 1.5 13.7 North Carolina 574,068 38.4 3.8 1,376,532 26.4 1.7 1,950,600 29.3 1.6 12.0 North Dakota 32,256 35.6 5.6 99,612 26.0 2.0 131,869 27.9 1.9 9.6 Ohio 763,391 39.2 4.0 1,632,098 25.2 1.6 2,395,488 28.5 1.5 14.0 Oklahoma 275,932 39.0 3.5 553,825 28.3 1.7 829,757 31.2 1.5 10.7 Oregon 220,505 33.9 5.3 418,028 19.6 2.1 638,533 22.8 1.9 14.3 Pennsylvania 775,171 40.8 4.4 1,741,622 24.1 1.6 2,516,793 27.3 1.5 16.7 Rhode Island 52,755 34.6 4.7 140,929 22.1 1.9 193,684 24.5 1.7 12.5 South Carolina 295,959 39.4 4.4 648,014 26.4 1.9 943,973 29.4 1.7 13.0 South Dakota 40,941 41.4 5.9 128,821 27.2 2.1 169,762 29.4 1.9 14.2 Tennessee 423,893 38.8 4.7 1,020,526 29.6 2.4 1,444,419 32.2 2.1 9.2 Texas 1,290,448 41.7 4.4 3,446,039 25.3 1.7 4,736,487 28.5 1.5 16.4 Utah 128,505 34.7 3.3 295,341 20.7 1.2 423,846 23.8 1.1 14.0 Vermont 32,497 31.4 4.0 75,261 20.1 1.7 107,758 22.6 1.5 11.3 Virginia 400,600 37.1 8.0 945,206 20.8 1.9 1,345,807 24.1 2.0 16.3 Washington 417,245 35.8 2.4 825,948 22.8 1.1 1,243,193 26.1 1.0 13.0 West Virginia 154,399 38.5 3.9 271,162 27.6 2.0 425,560 30.9 1.8 10.9 Wisconsin 319,460 39.7 6.9 829,059 25.8 2.4 1,148,519 28.7 2.2 13.9 Wyoming 28,839 37.1 5.7 66,293 21.4 1.8 95,131 24.5 1.8 15.7 Guam 4,268 37.8 10.5 22,007 22.4 3.0 26,274 24.7 2.9 15.4 Puerto Rico 185,726 32.7 5.3 556,899 25.1 1.9 742,625 27.0 1.8 7.6 Virgin Islands 2,744 34.5 8.3 16,457 26.6 2.5 19,201 27.6 2.4 7.9 Total 17,194,727 37.6 0.9 41,649,691 23.8 0.3 58,844,418 26.6 0.3 13.8 Notes: 1. BRFSS refers to the Behavioral Risk Factor Surveillance System. 2. Estimates are age-adjusted to the 2000 U.S. standard population. 3. CI denotes confidence interval. NCBDDD Atlanta: For more information please contact Centers for Disease Control and Prevention 1600 Clifton Road NE, Atlanta, GA 30333 Telephone: 1-800-CDC-INFO (232-4636)/TTY: 1-888-232-63548 Email: cdcinfo@cdc.gov Web: www.cdc.gov