Downloaded 13 times


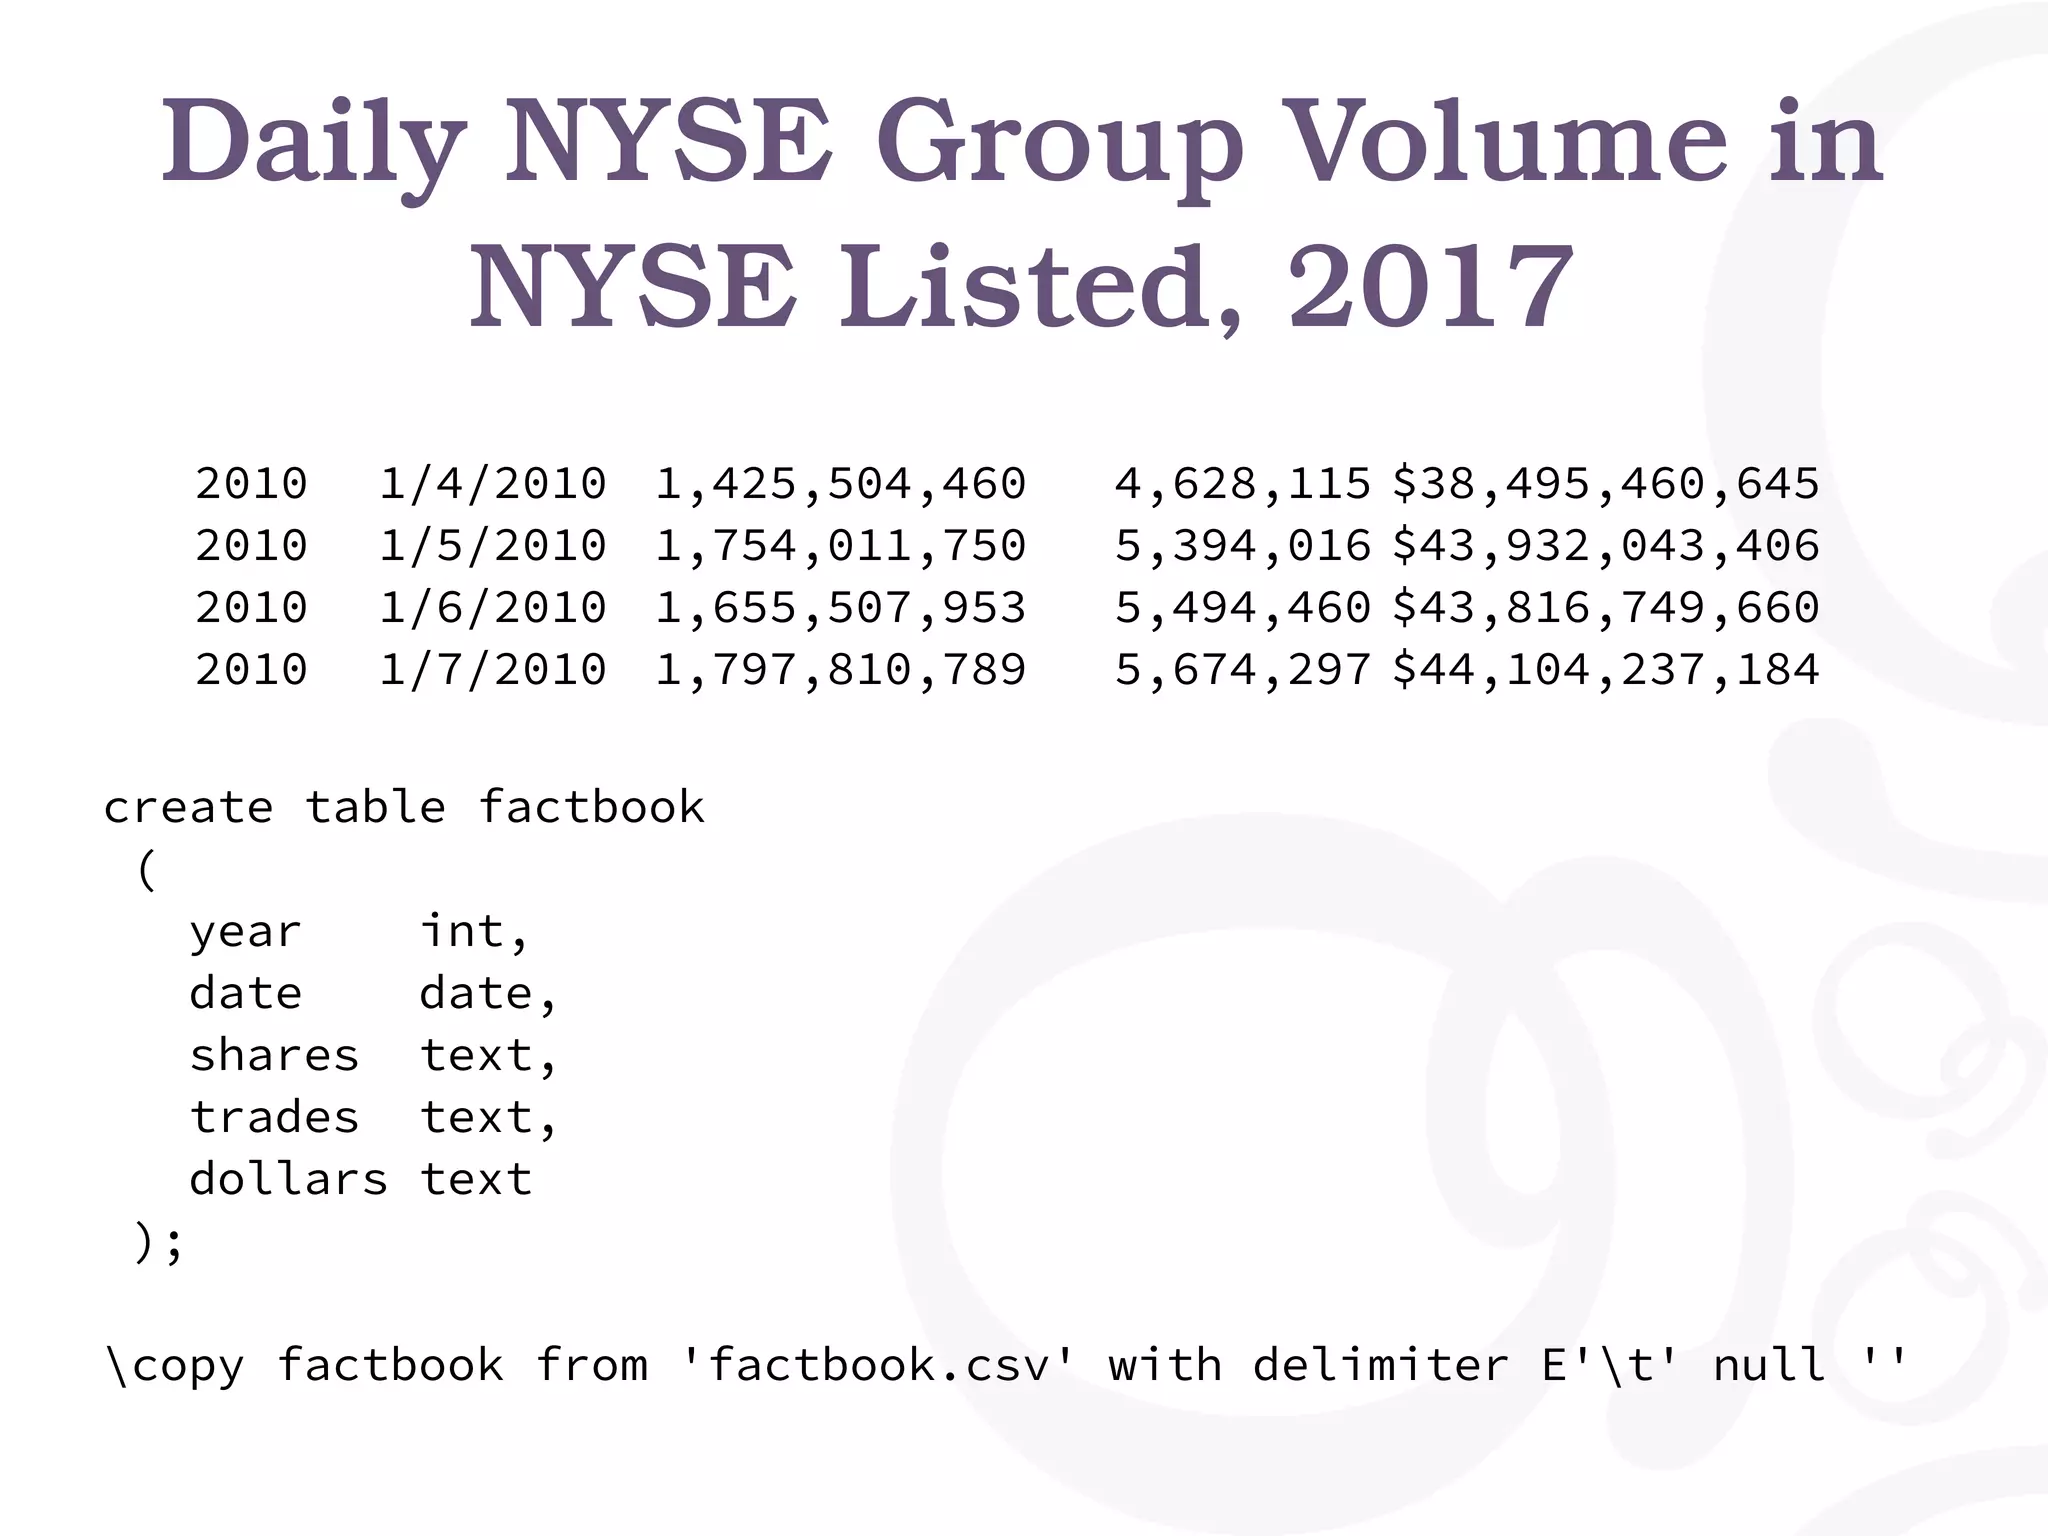
![Top-N Heapsort, Python
#! /usr/bin/env python3
import psycopg2
import heapq
import sys
PGCONNSTRING = "dbname=appdev application_name=cont"
def top(n):
"Fetch data from the factbook table"
conn = psycopg2.connect(PGCONNSTRING)
curs = conn.cursor()
sql = """
SELECT date, dollars
FROM factbook
WHERE date is not null
"""
curs.execute(sql)
topn = [(0, None) for i in range(n)]
heapq.heapify(topn)
for date, dollars in curs.fetchall():
heapq.heappushpop(topn, (dollars, date))
return topn
if __name__ == '__main__':
n = int(sys.argv[1])
topn = top(n)
for dollars, date in heapq.nlargest(n, topn):
print("%s: %s" % (date, dollars))
2014-12-19: 124663932012
2015-09-18: 118869806099
2014-09-19: 118622863491
2013-12-20: 117924997250
2015-03-20: 115466468635
2016-06-24: 112434567771
2015-06-26: 110931465892
2010-06-25: 110901889417
2015-12-18: 110329938339
2014-03-21: 107923489435](https://image.slidesharecdn.com/pyconfr-lille-2018-181106184028/75/Python-and-PostgreSQL-Let-s-Work-Together-PyConFr-2018-Dimitri-Fontaine-23-2048.jpg)

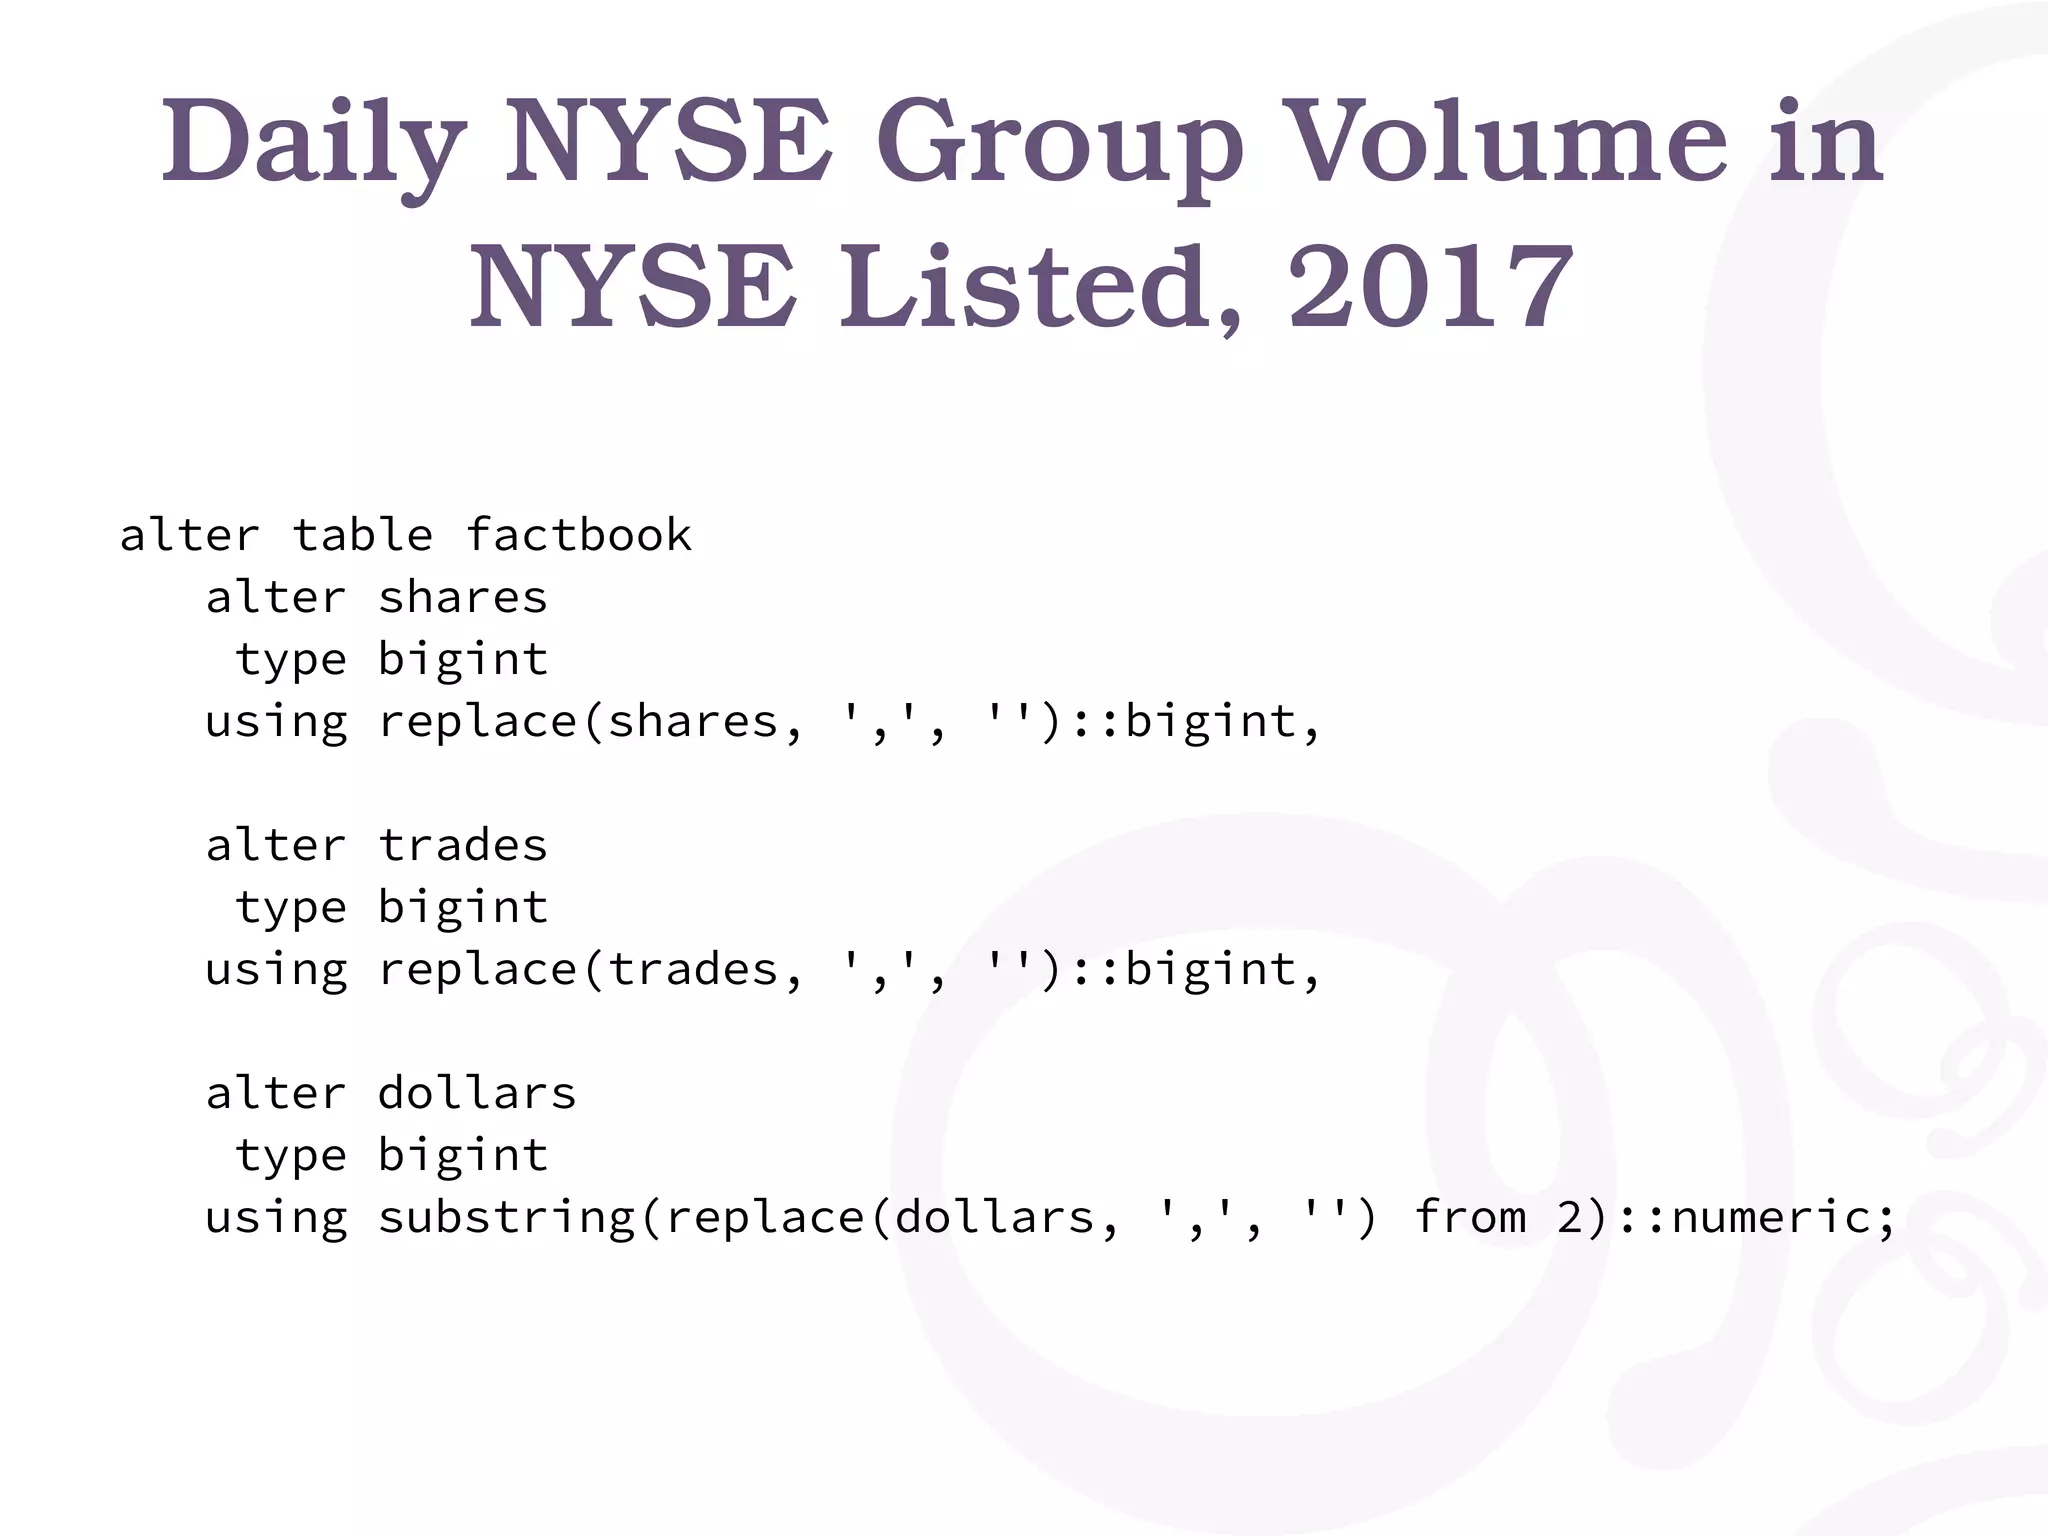
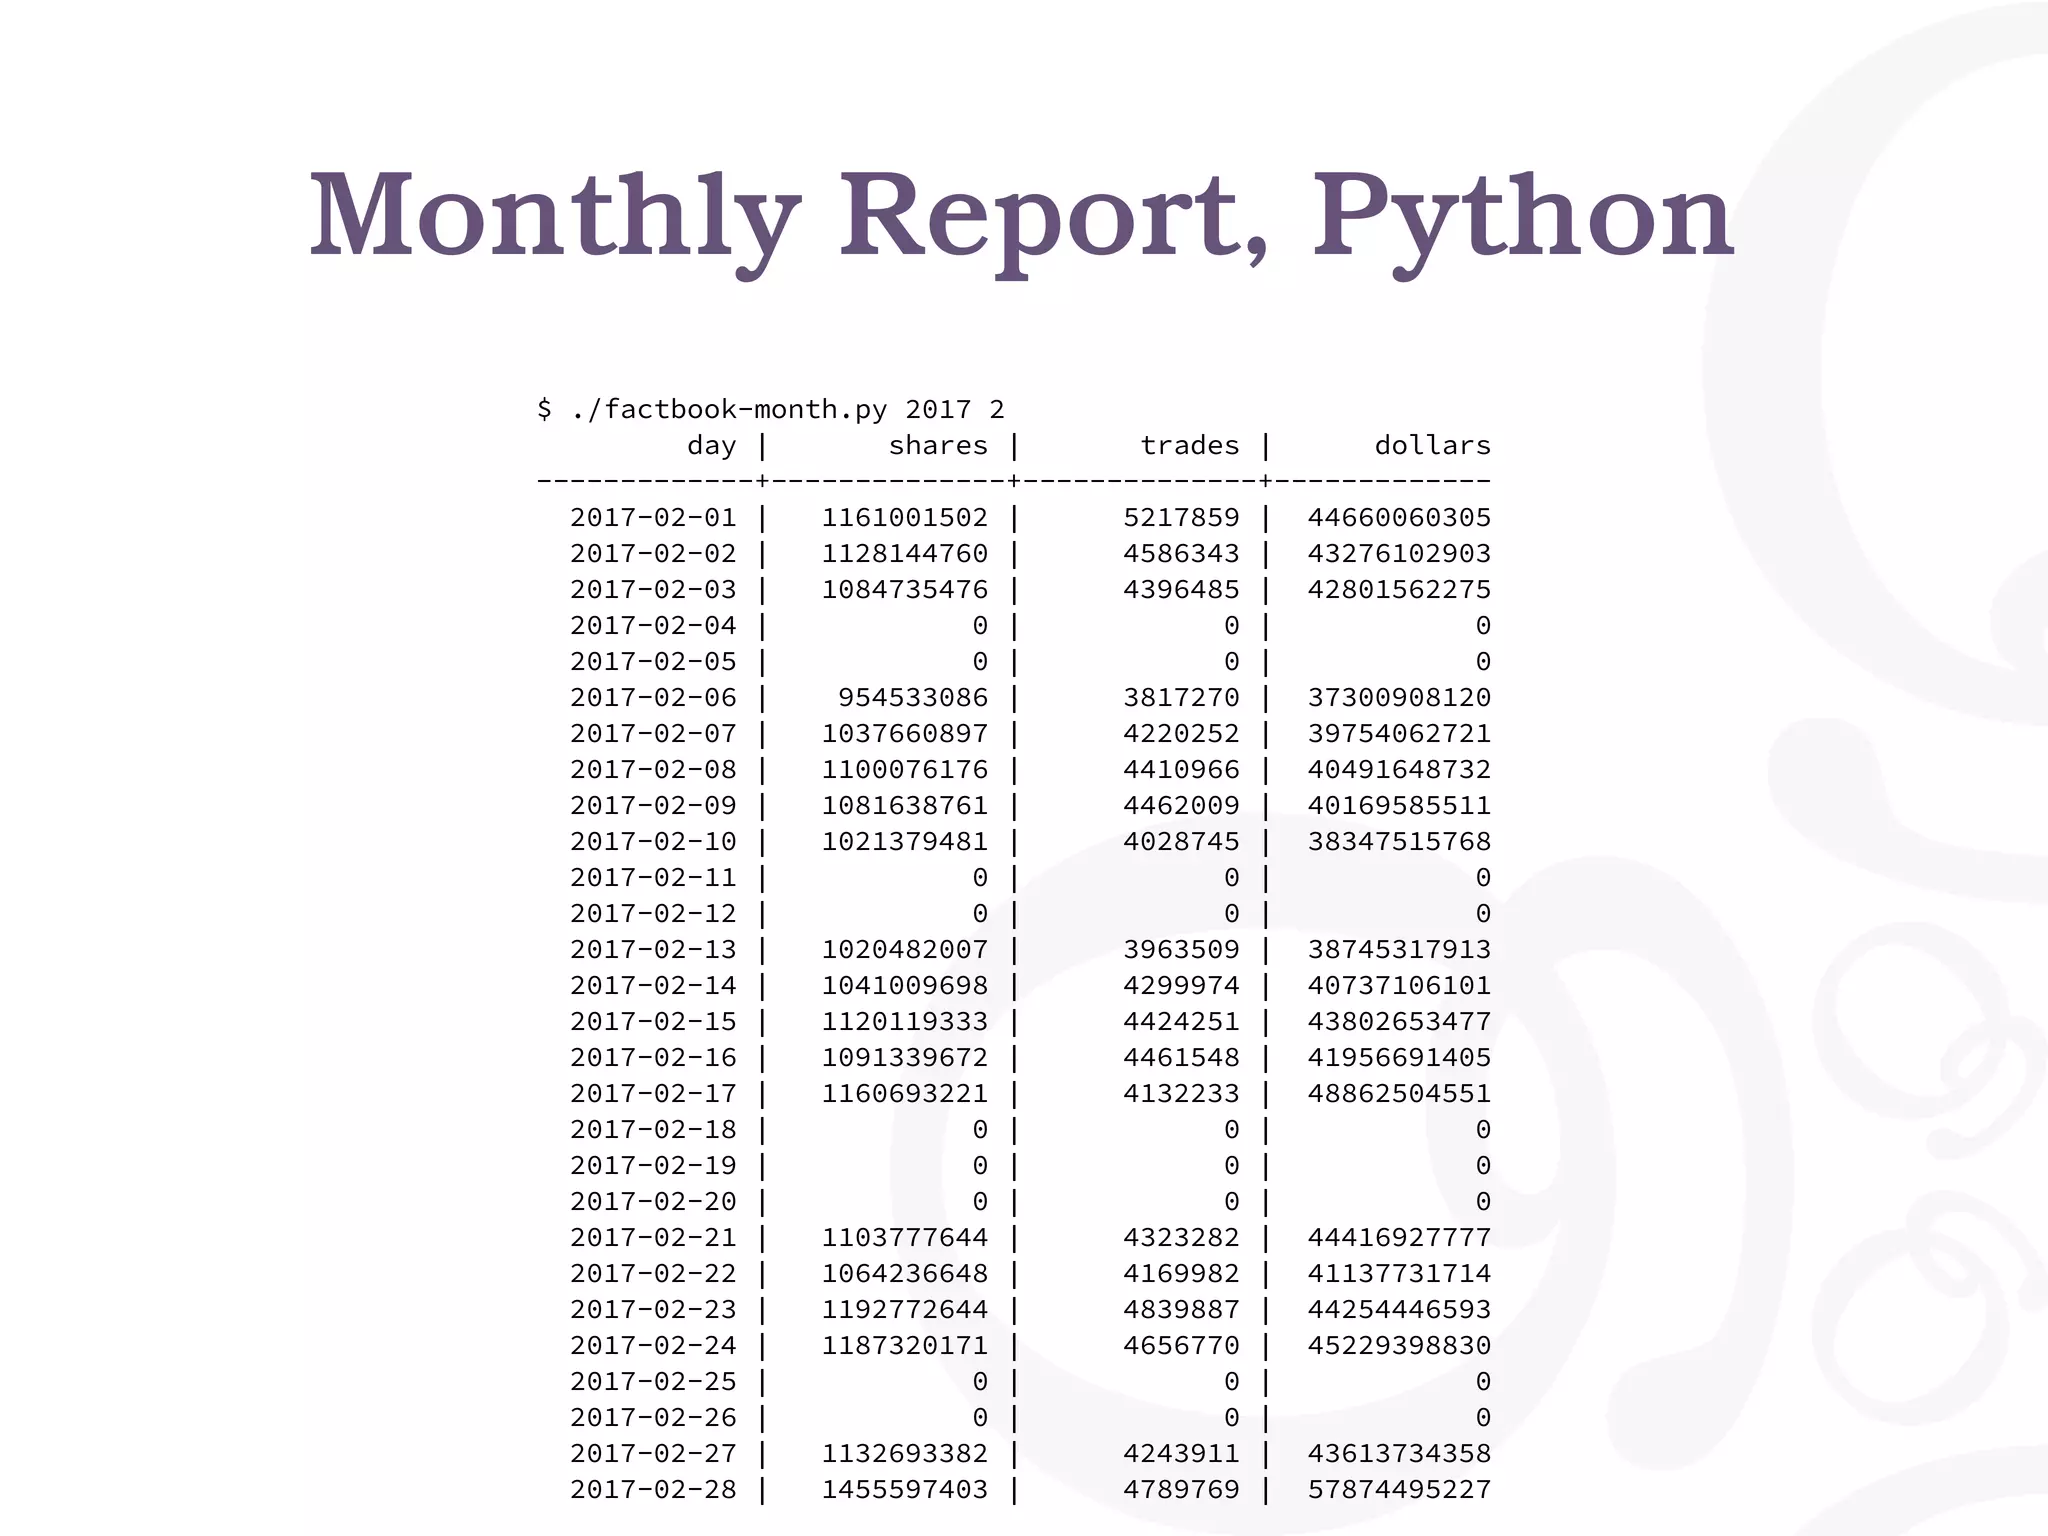
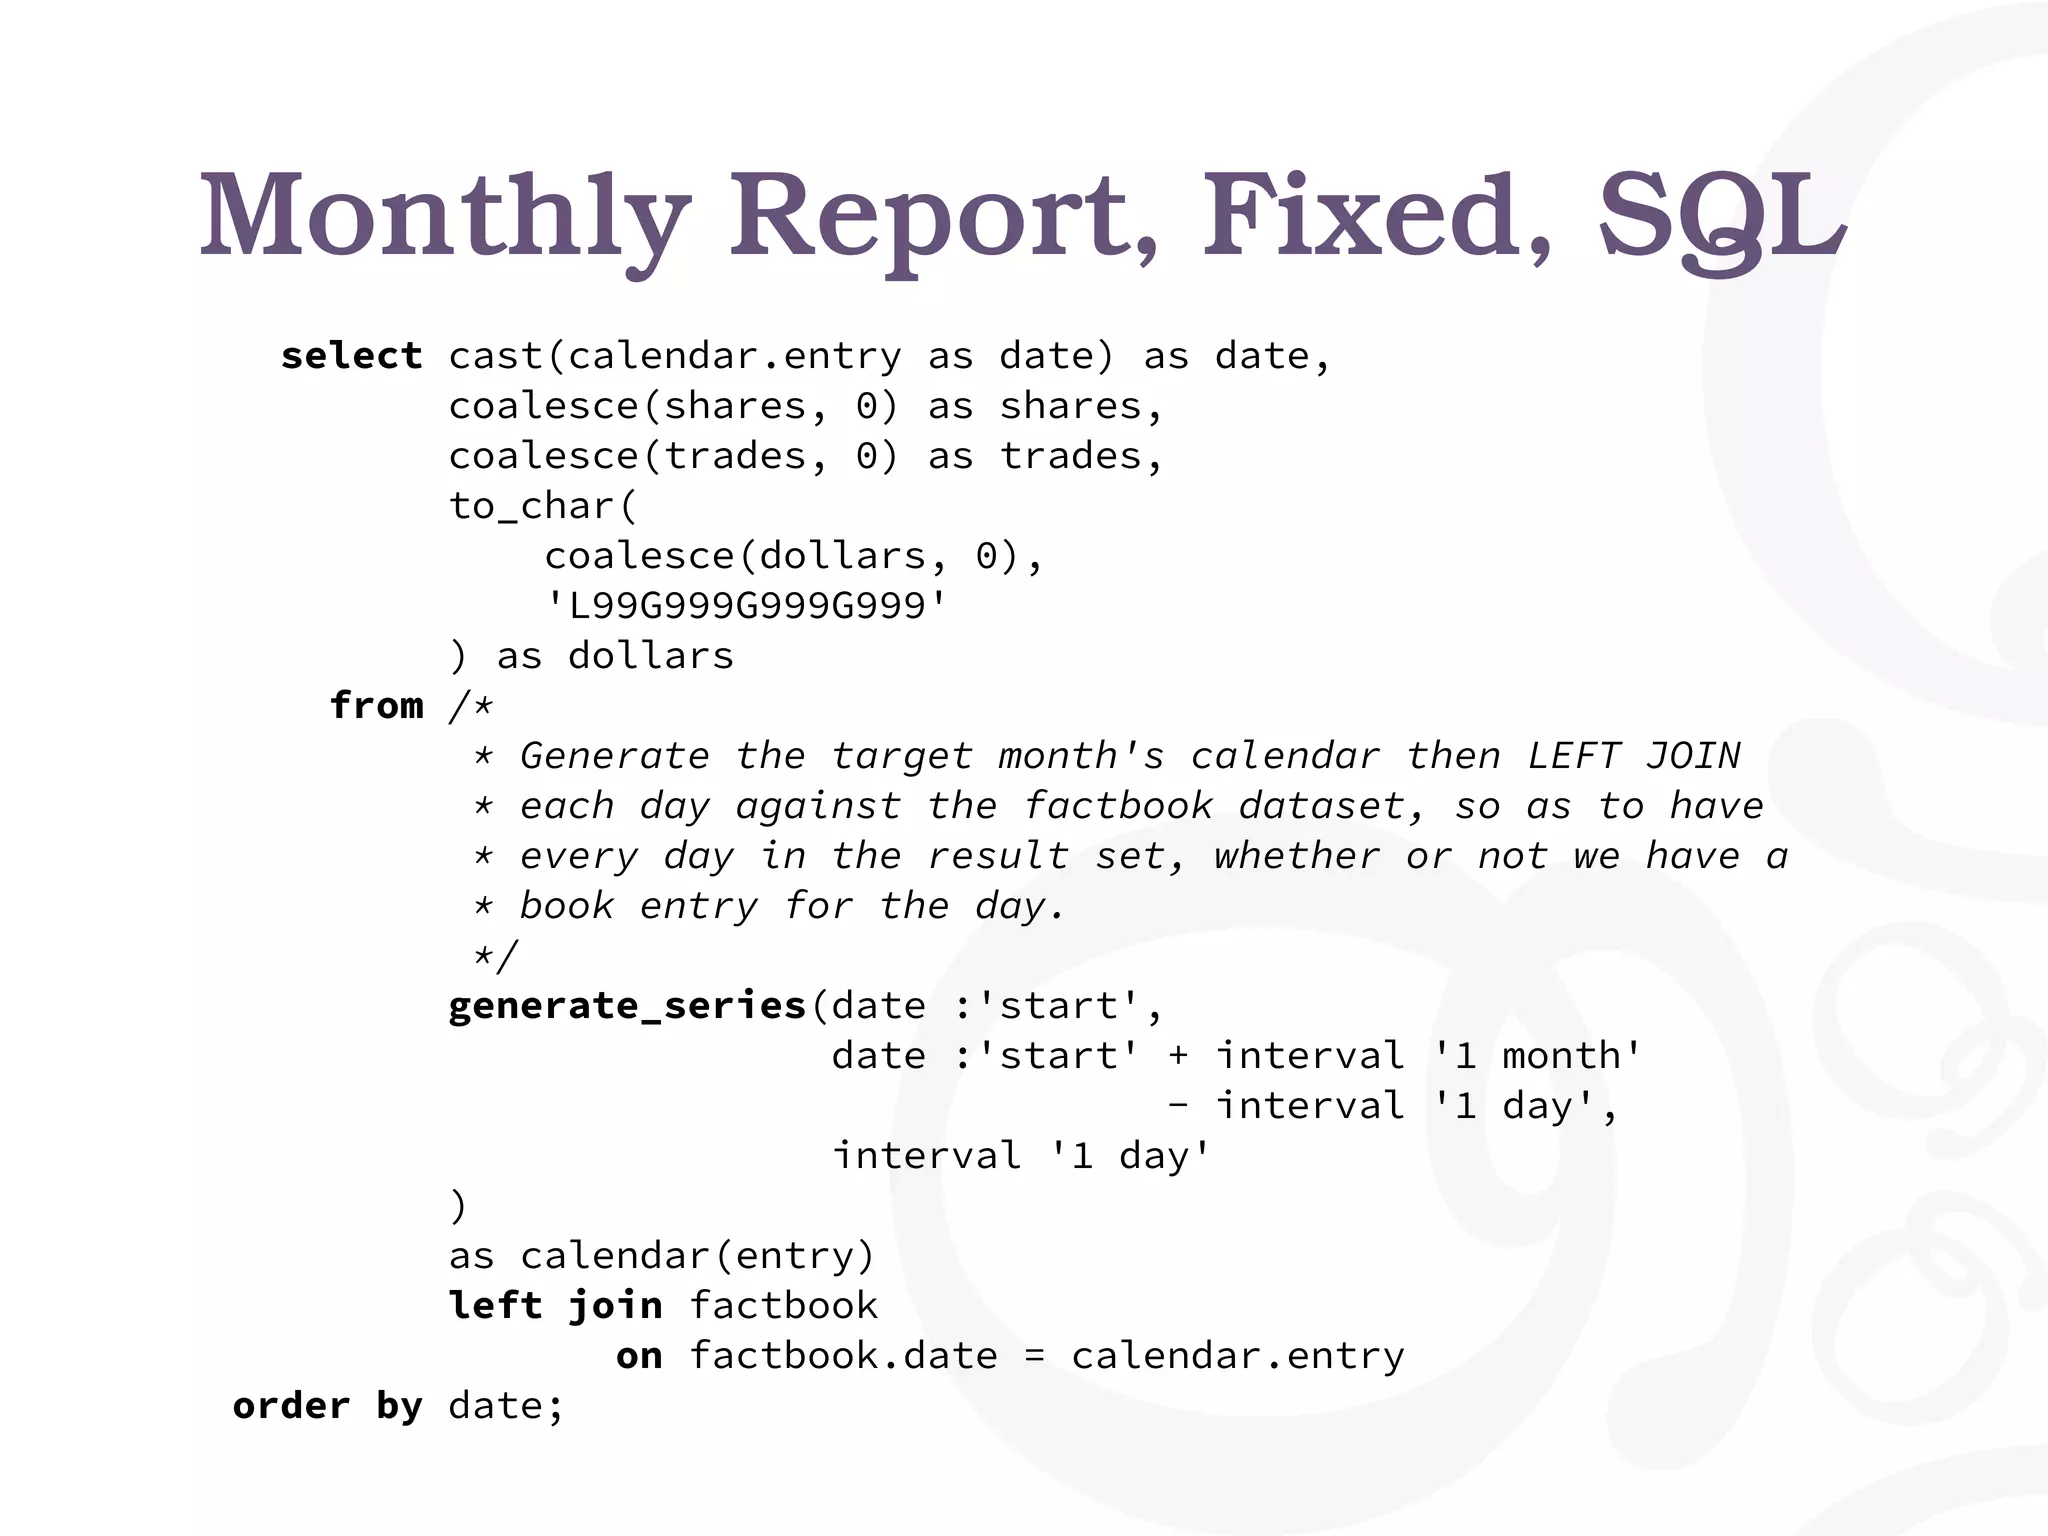
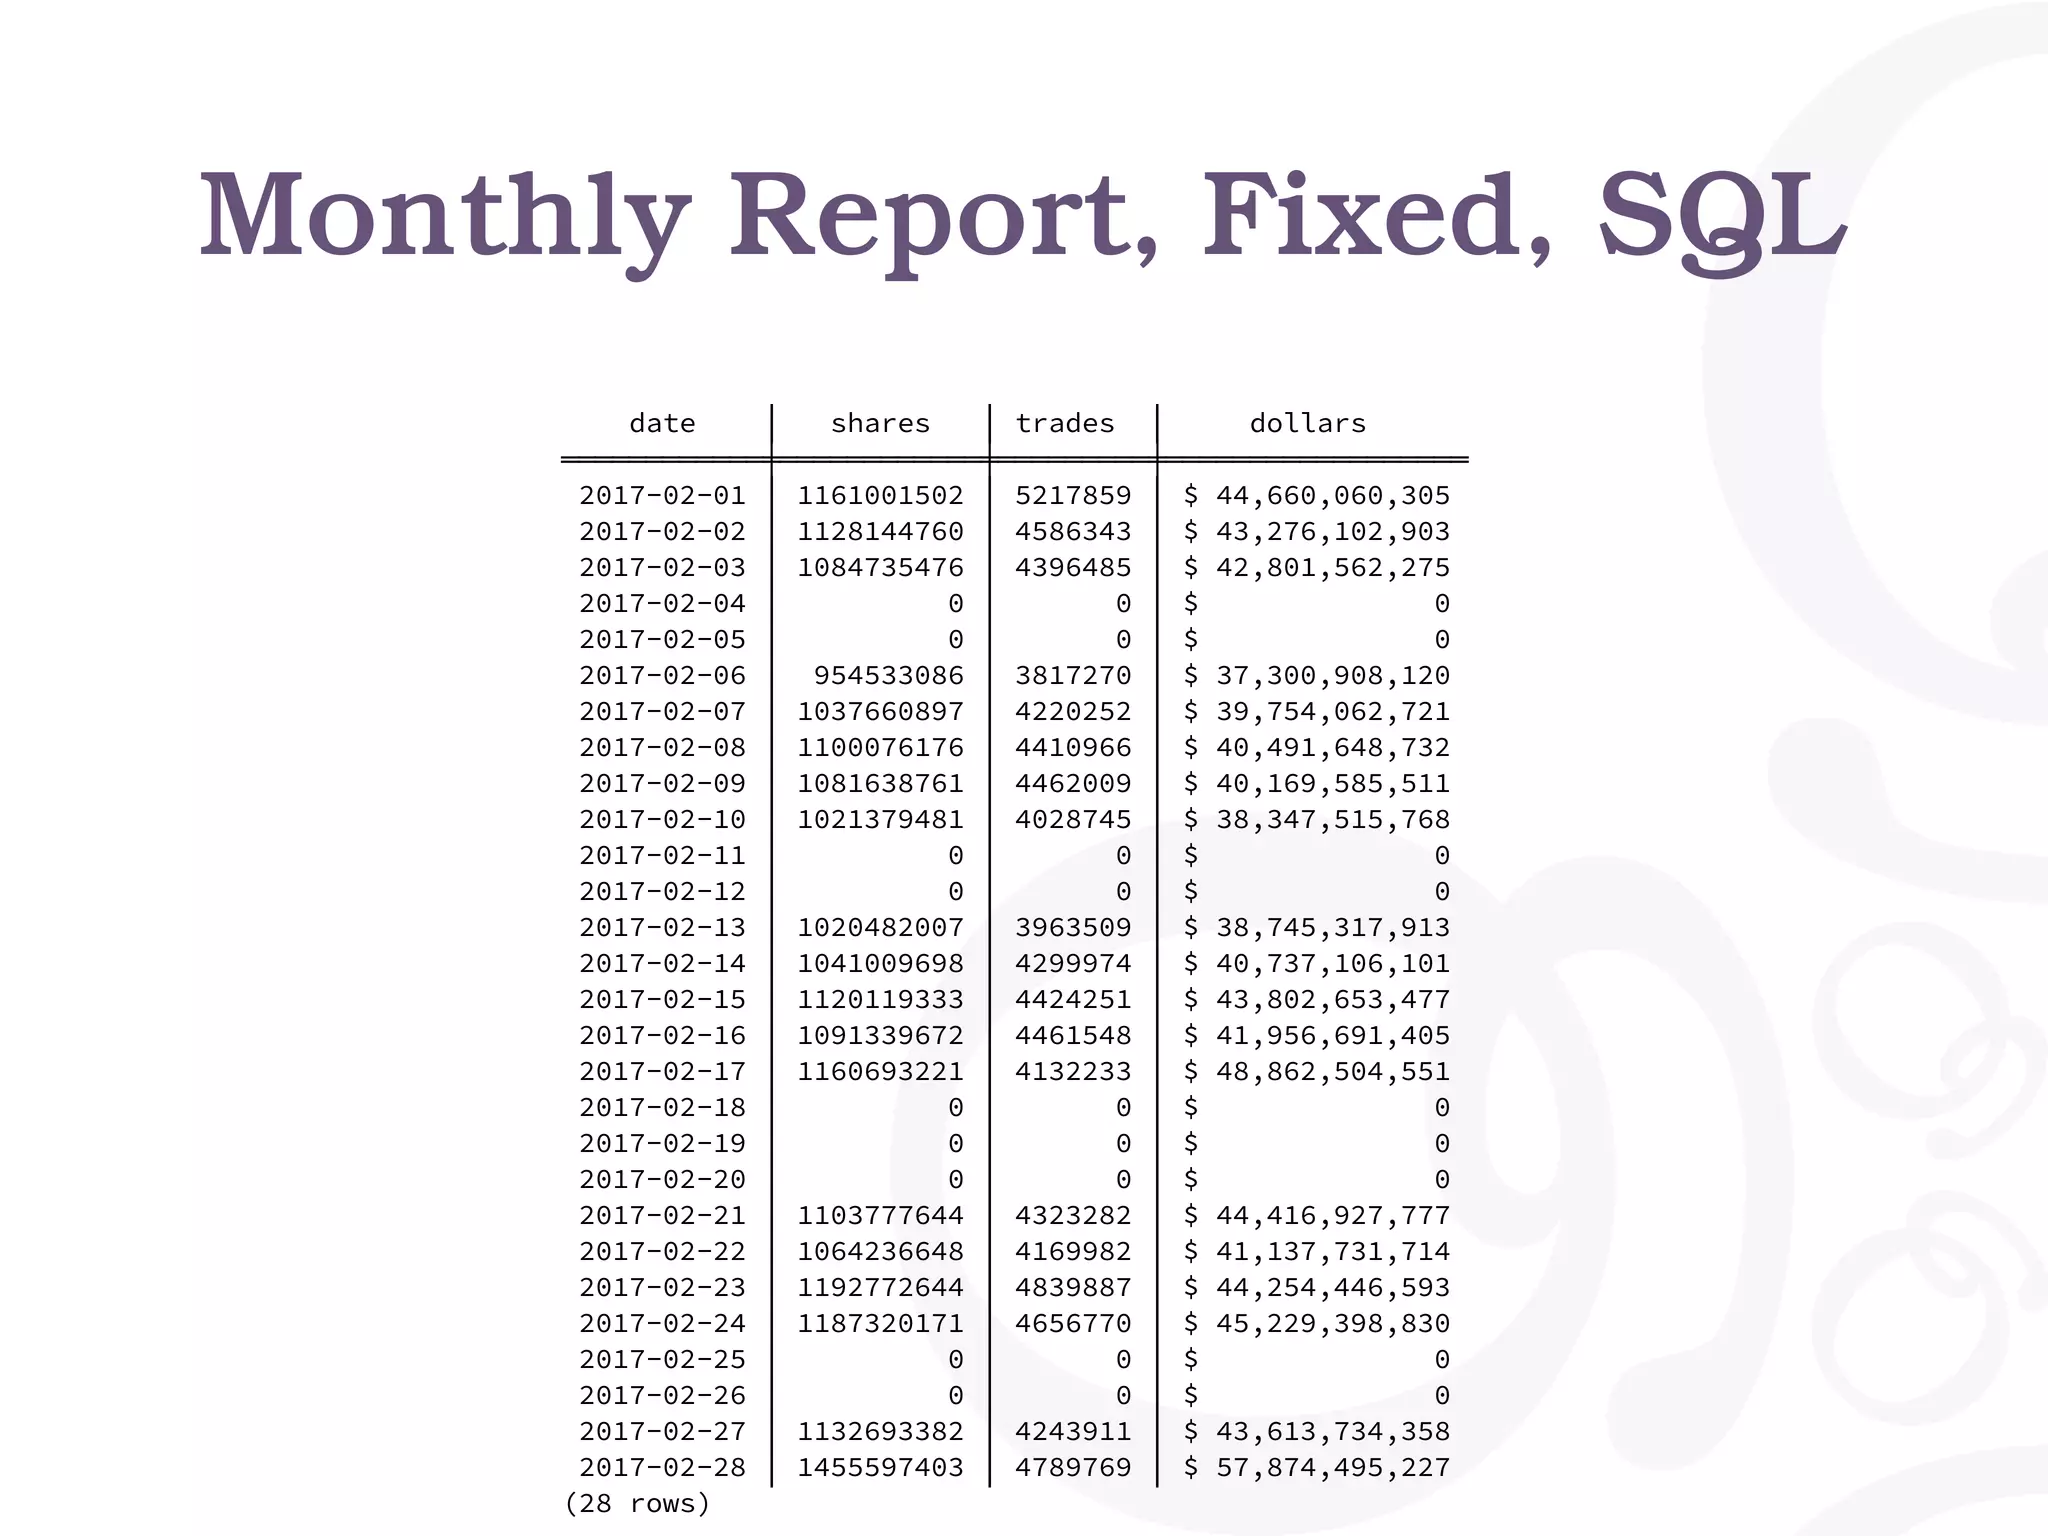
![Monthly Report, Python
def fetch_month_data(year, month):
"Fetch a month of data from the database"
date = "%d-%02d-01" % (year, month)
sql = """
select date, shares, trades, dollars
from factbook
where date >= date %s
and date < date %s + interval '1 month'
order by date;
"""
pgconn = psycopg2.connect(CONNSTRING)
curs = pgconn.cursor()
curs.execute(sql, (date, date))
res = {}
for (date, shares, trades, dollars) in curs.fetchall():
res[date] = (shares, trades, dollars)
return res
def list_book_for_month(year, month):
"""List all days for given month, and for each
day list fact book entry.
"""
data = fetch_month_data(year, month)
cal = Calendar()
print("%12s | %12s | %12s | %12s" %
("day", "shares", "trades", "dollars"))
print("%12s-+-%12s-+-%12s-+-%12s" %
("-" * 12, "-" * 12, "-" * 12, "-" * 12))
for day in cal.itermonthdates(year, month):
if day.month != month:
continue
if day in data:
shares, trades, dollars = data[day]
else:
shares, trades, dollars = 0, 0, 0
print("%12s | %12s | %12s | %12s" %
(day, shares, trades, dollars))](https://image.slidesharecdn.com/pyconfr-lille-2018-181106184028/75/Python-and-PostgreSQL-Let-s-Work-Together-PyConFr-2018-Dimitri-Fontaine-29-2048.jpg)


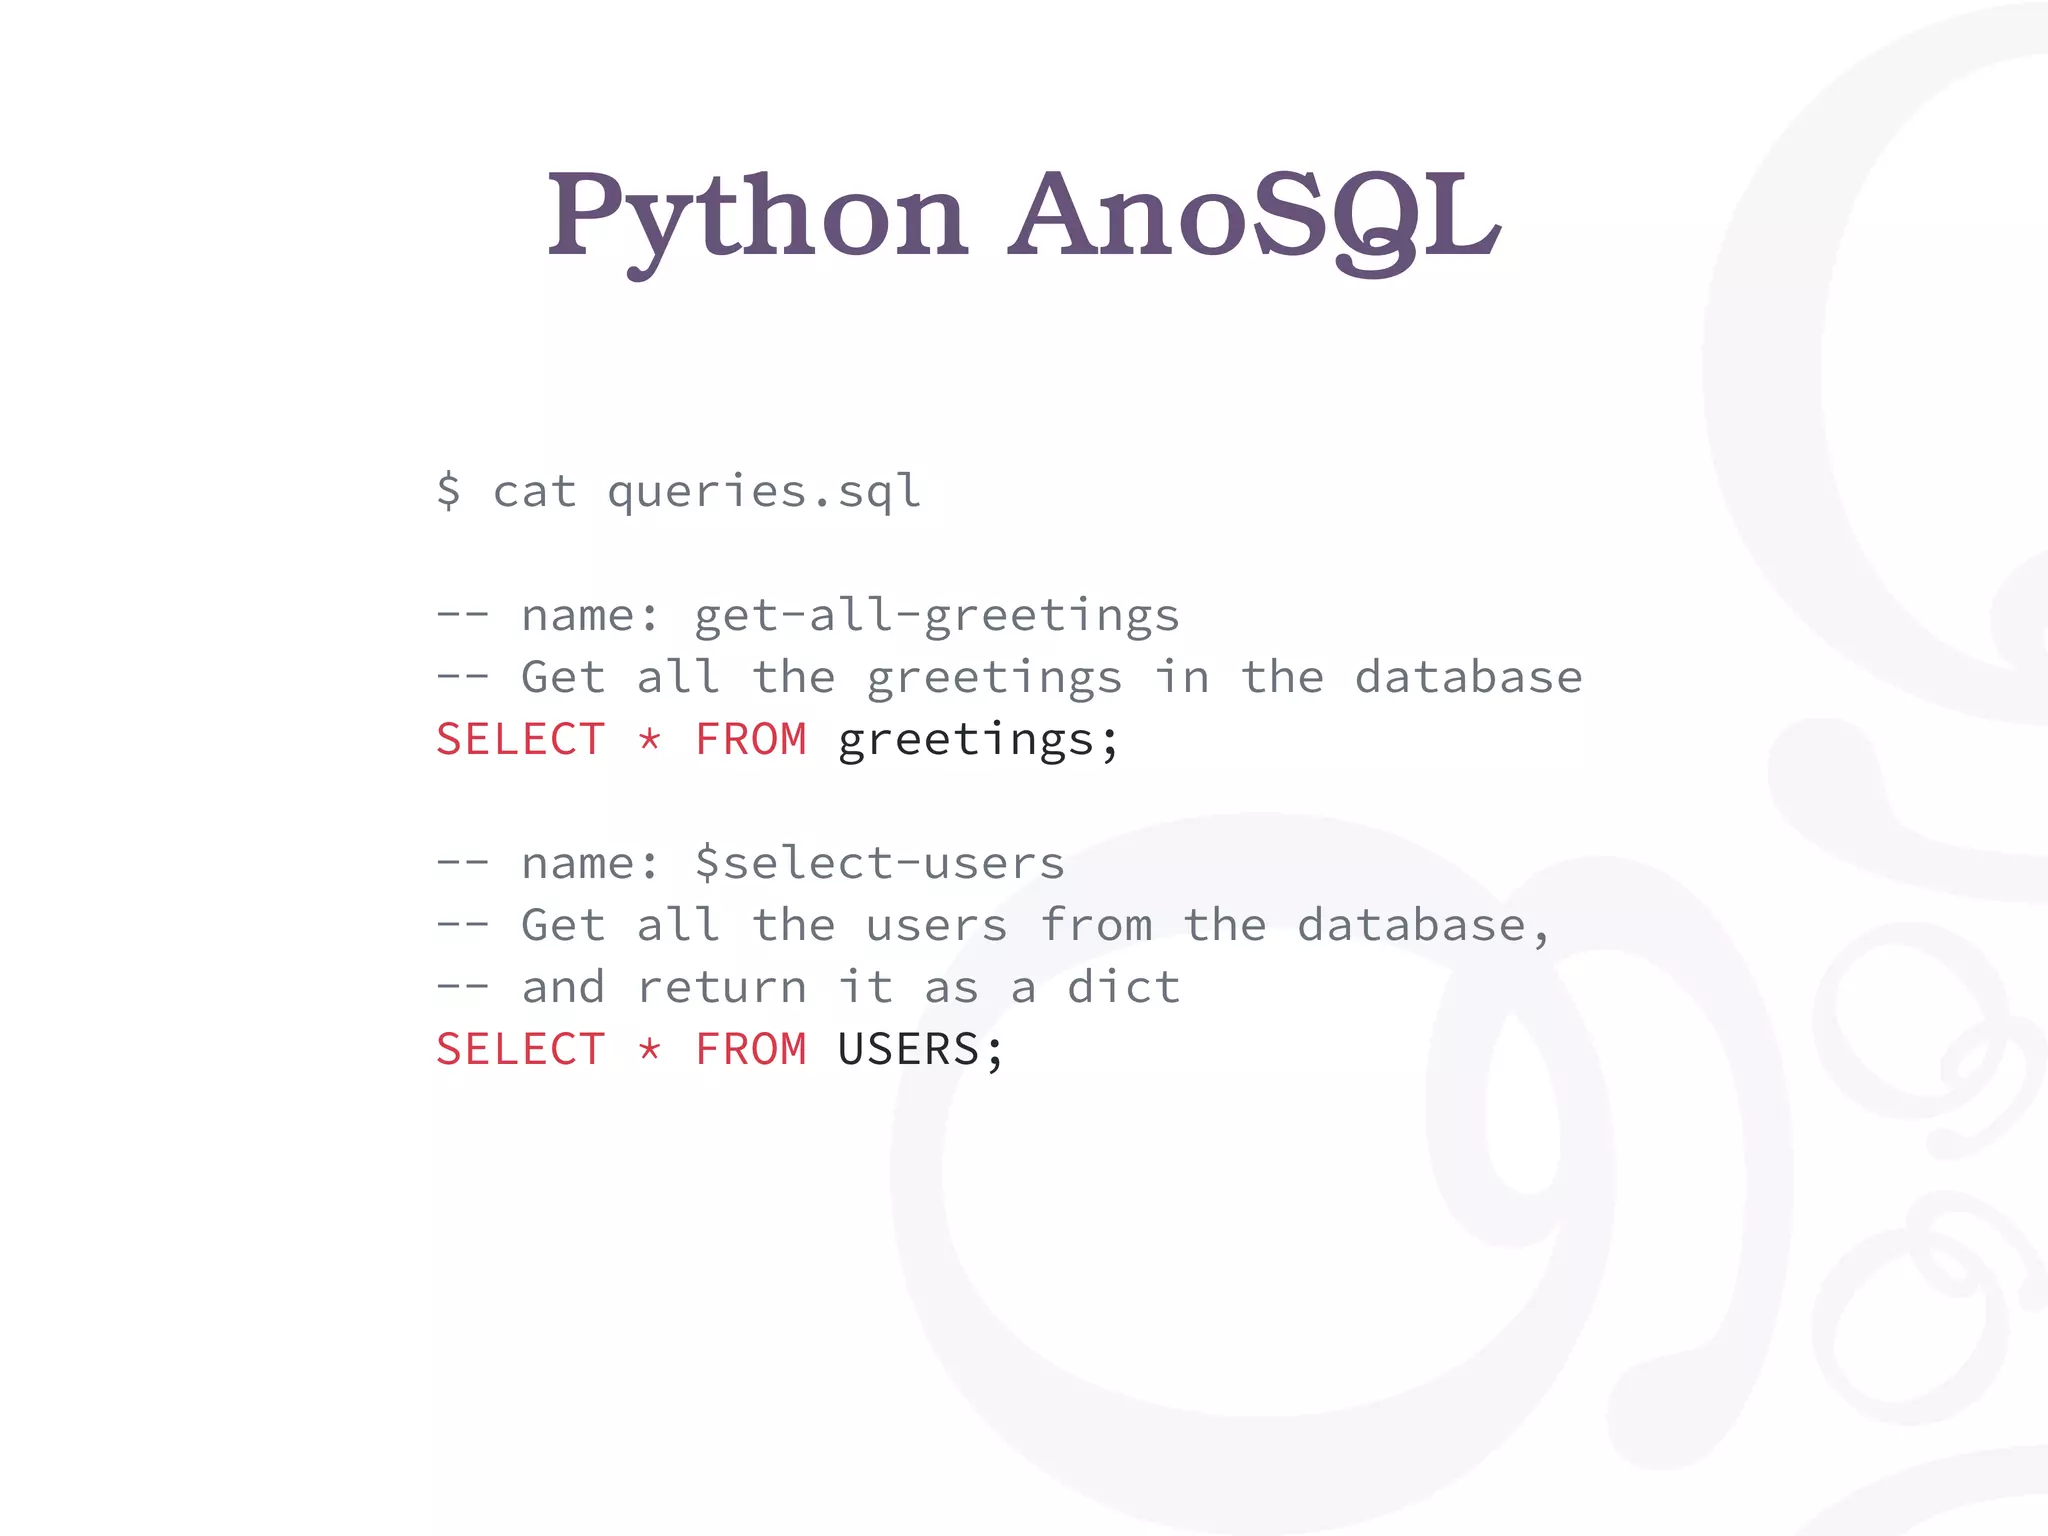
![import anosql
import psycopg2
import sqlite3
# PostgreSQL
conn = psycopg2.connect('...')
queries = anosql.load_queries('postgres', ‘queries.sql')
queries = queries.get_all_users(conn)
# [{"id": 1, "name": "Meghan"}, {"id": 2, "name": "Harry"}]
queries = queries.get_all_greetings(conn)
# => [(1, ‘Hi')]
Python AnoSQL](https://image.slidesharecdn.com/pyconfr-lille-2018-181106184028/75/Python-and-PostgreSQL-Let-s-Work-Together-PyConFr-2018-Dimitri-Fontaine-50-2048.jpg)
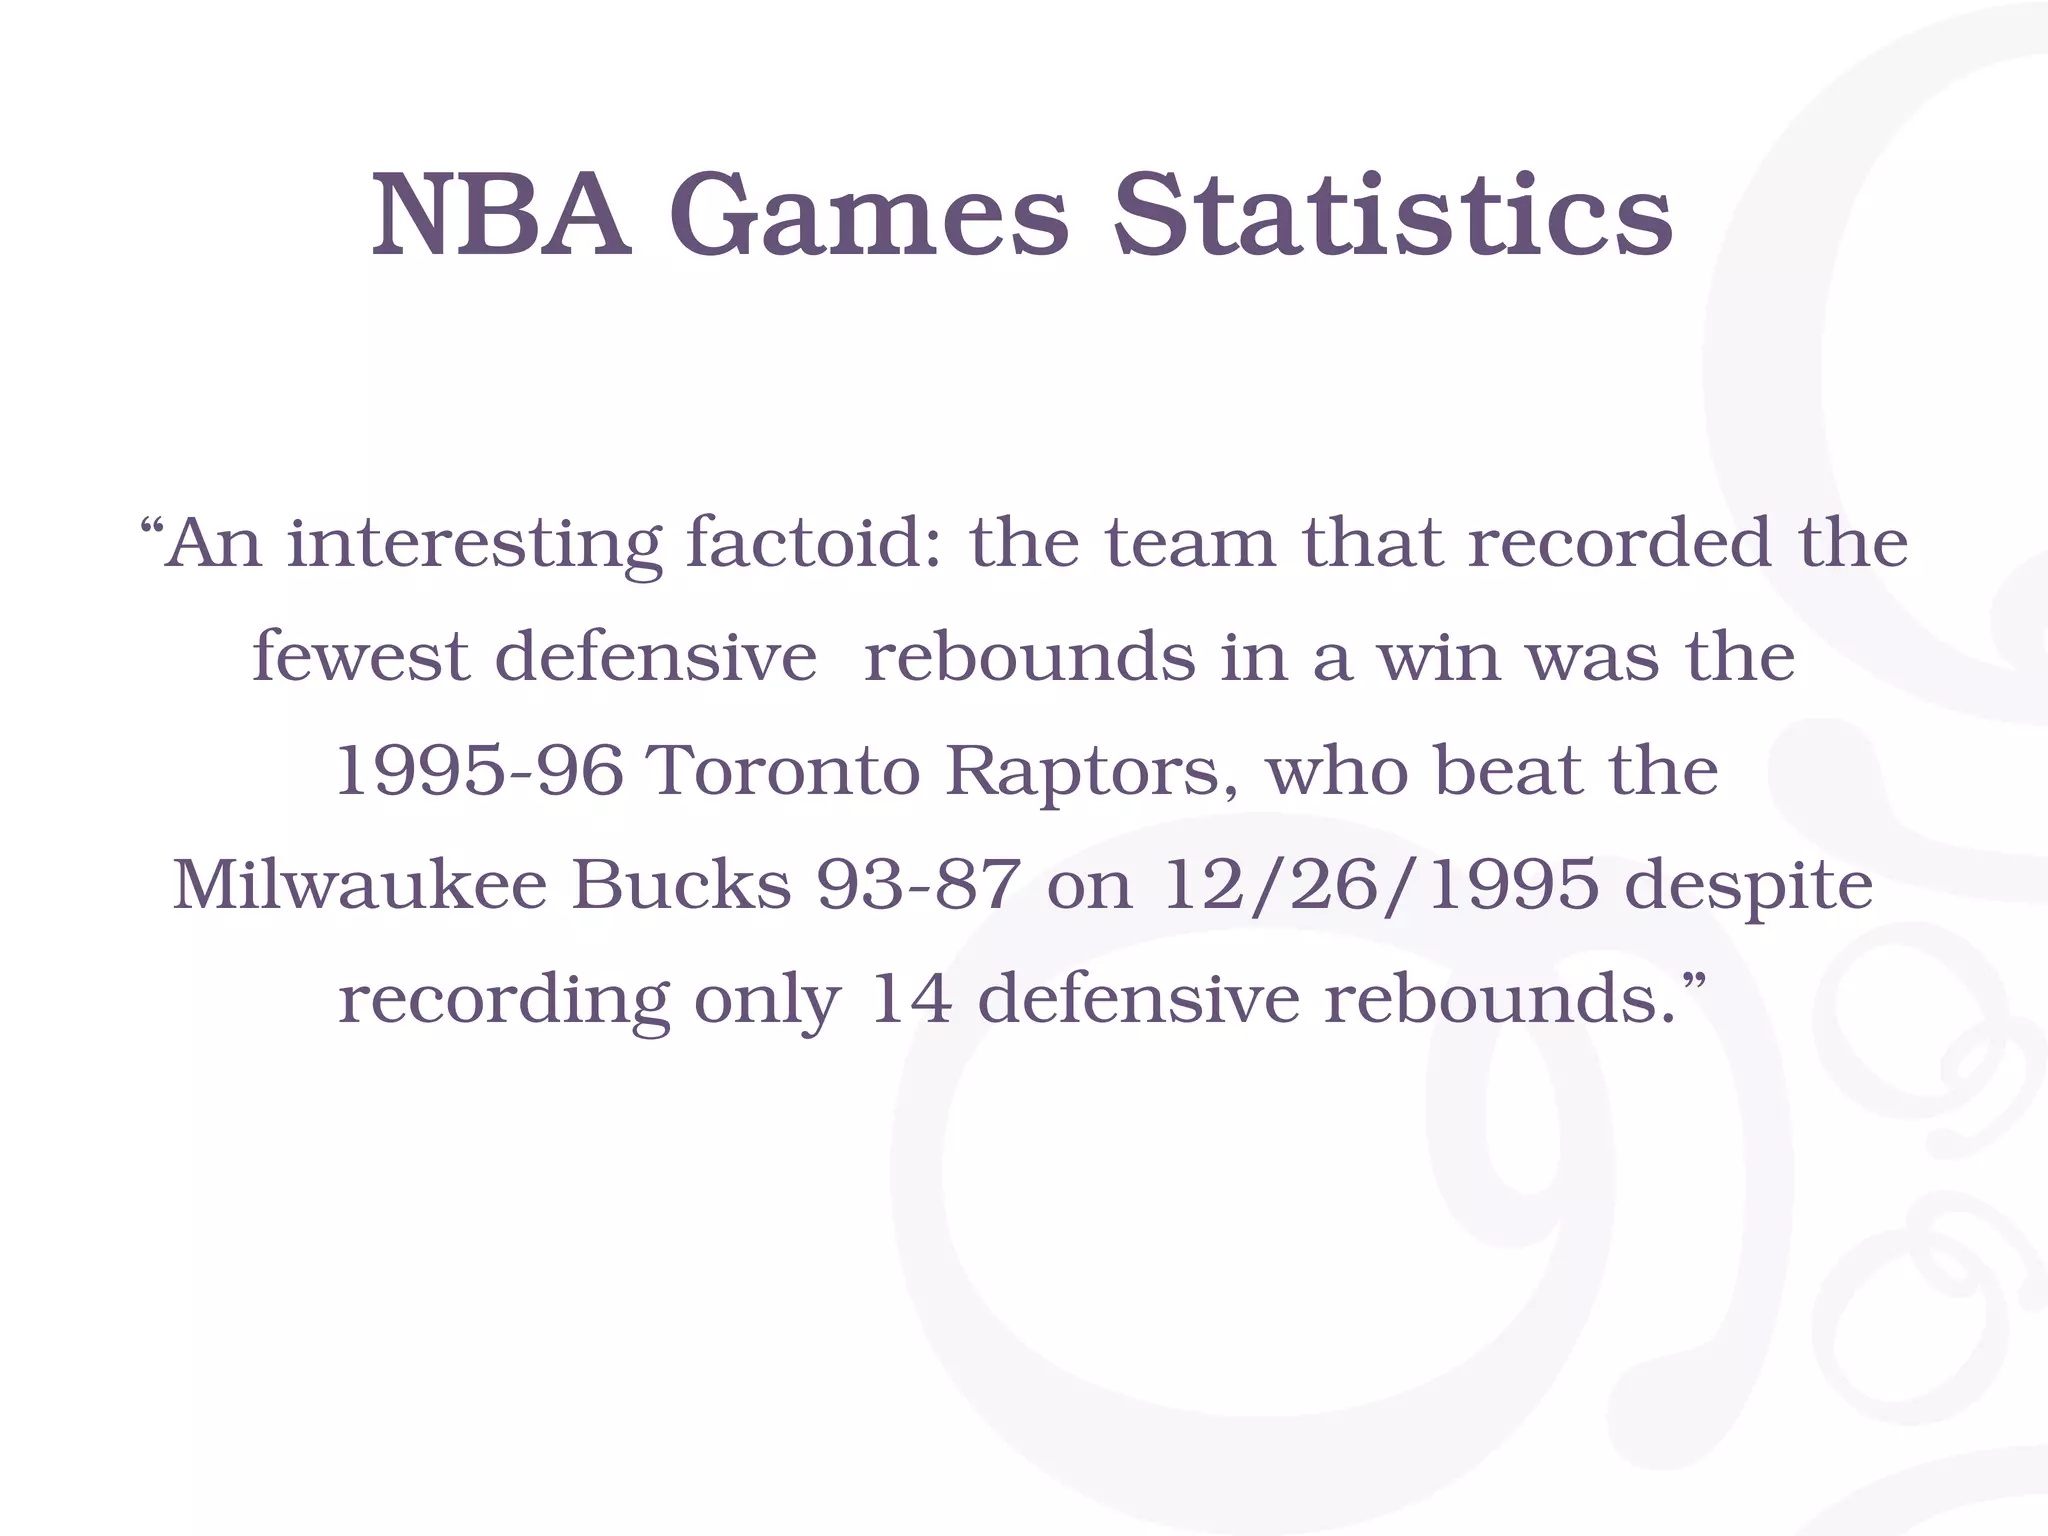
![-[ RECORD 1 ]----------------------------
date | 1995-12-26
host | Toronto Raptors -- 93
guest | Milwaukee Bucks -- 87
winner_drb | 14
-[ RECORD 2 ]----------------------------
date | 1996-02-02
host | Golden State Warriors -- 114
guest | Toronto Raptors -- 111
winner_drb | 14
-[ RECORD 3 ]----------------------------
date | 1998-03-31
host | Vancouver Grizzlies -- 101
guest | Dallas Mavericks -- 104
winner_drb | 14
-[ RECORD 4 ]----------------------------
date | 2009-01-14
host | New York Knicks -- 128
guest | Washington Wizards -- 122
winner_drb | 14
Time: 126.276 ms
NBA Games Statistics](https://image.slidesharecdn.com/pyconfr-lille-2018-181106184028/75/Python-and-PostgreSQL-Let-s-Work-Together-PyConFr-2018-Dimitri-Fontaine-58-2048.jpg)
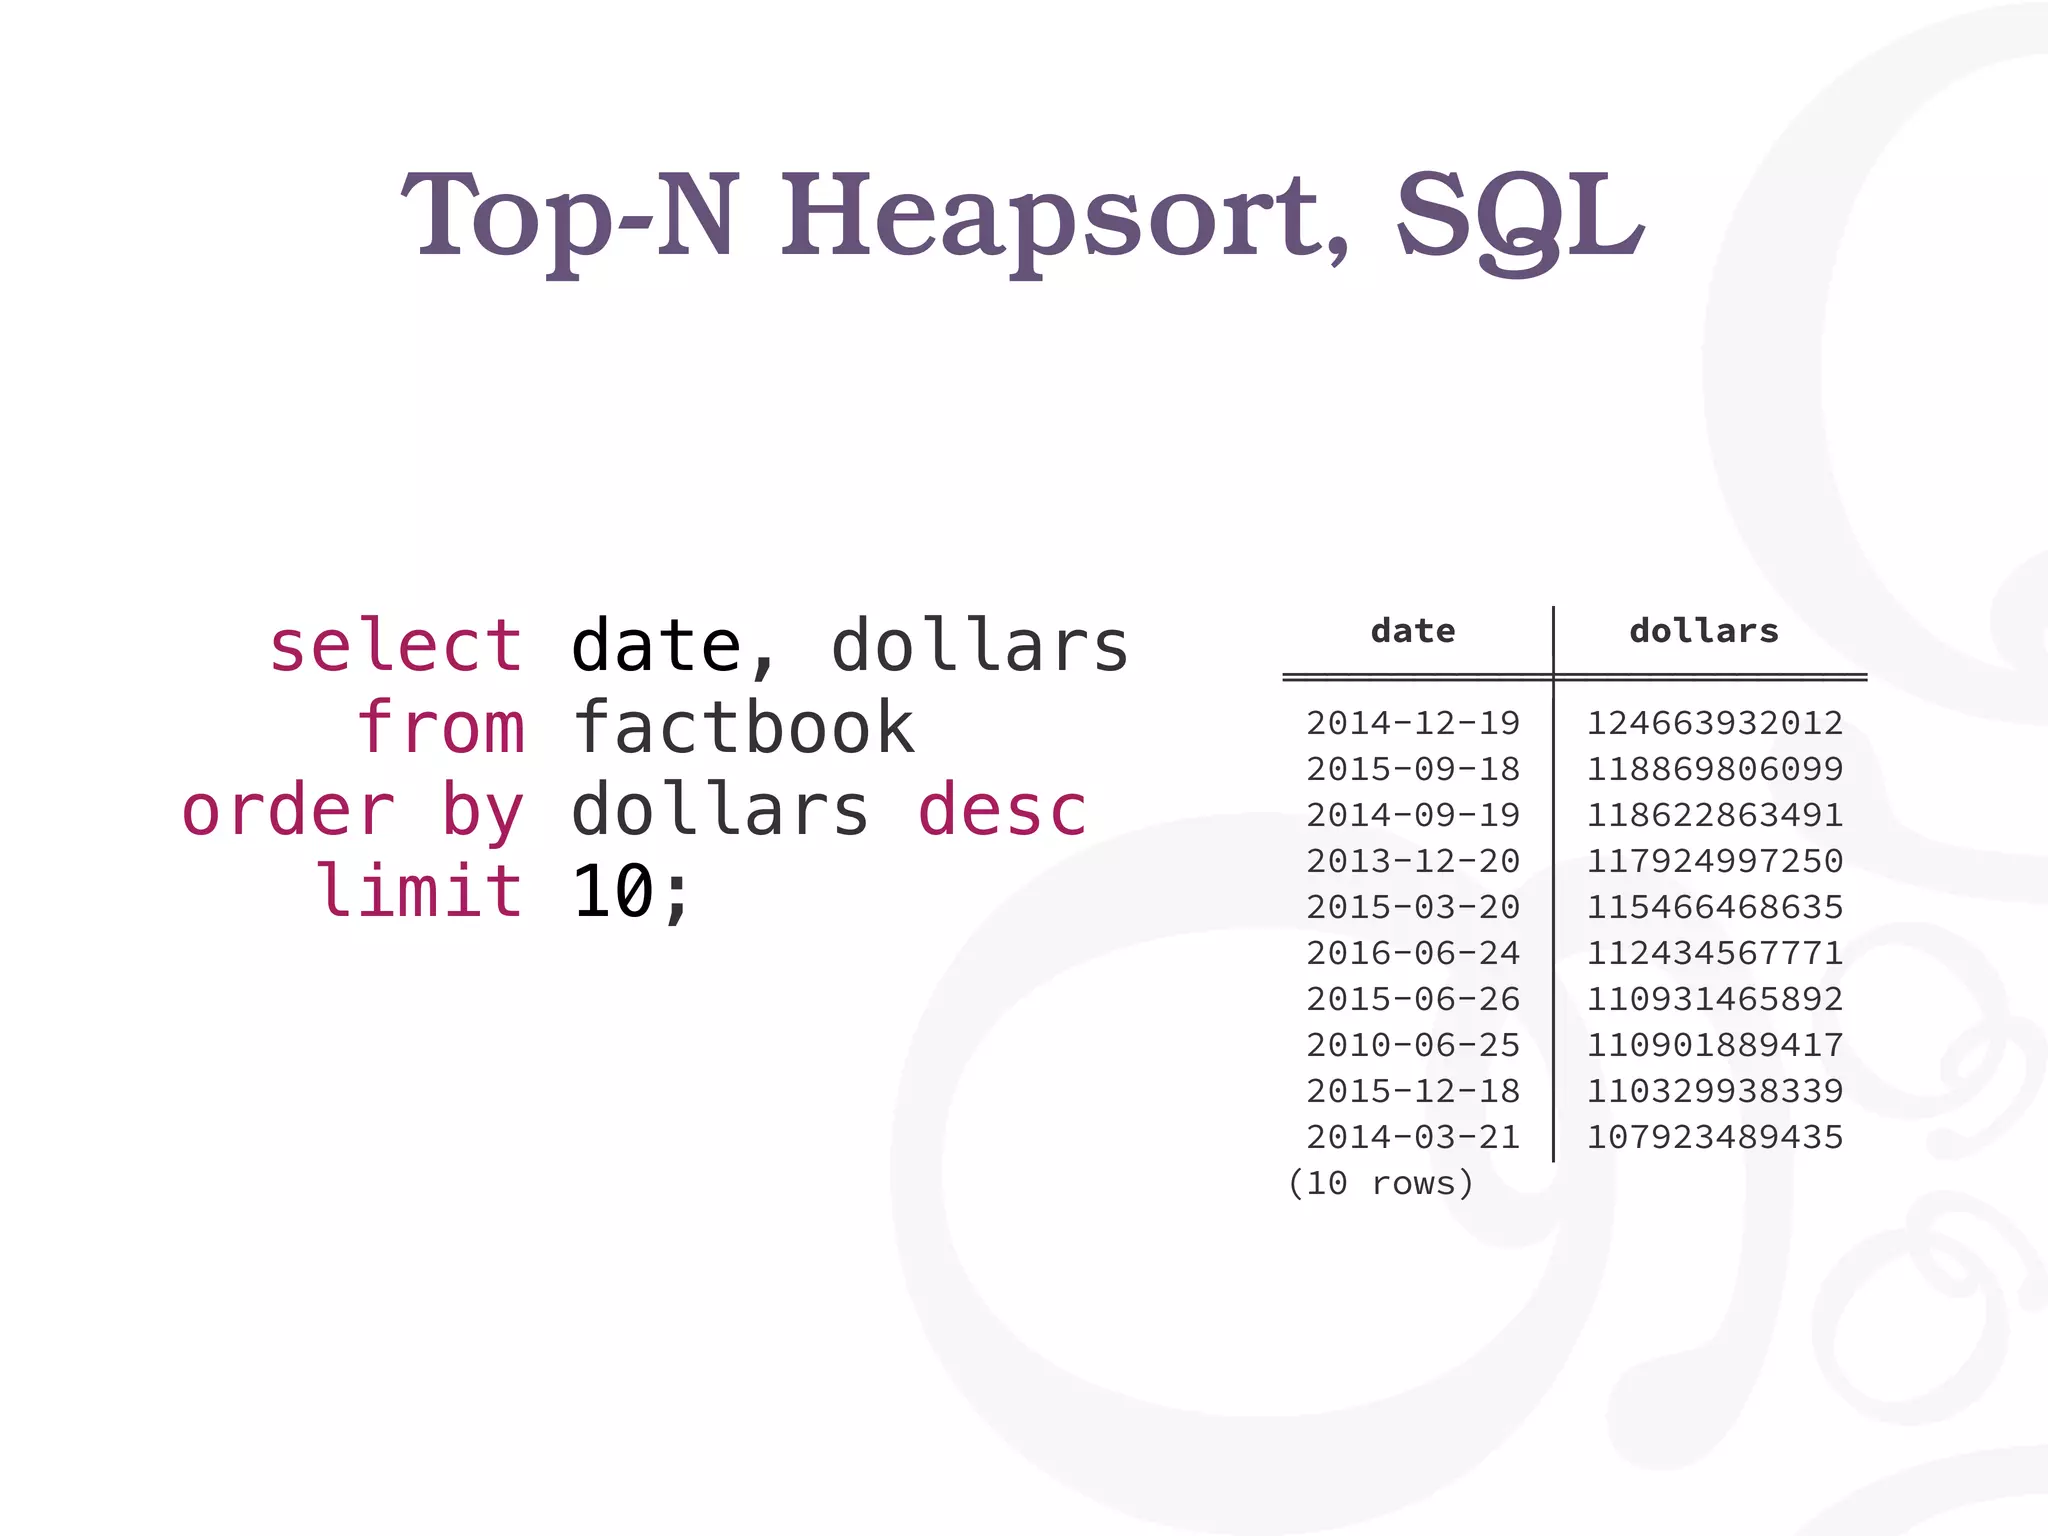
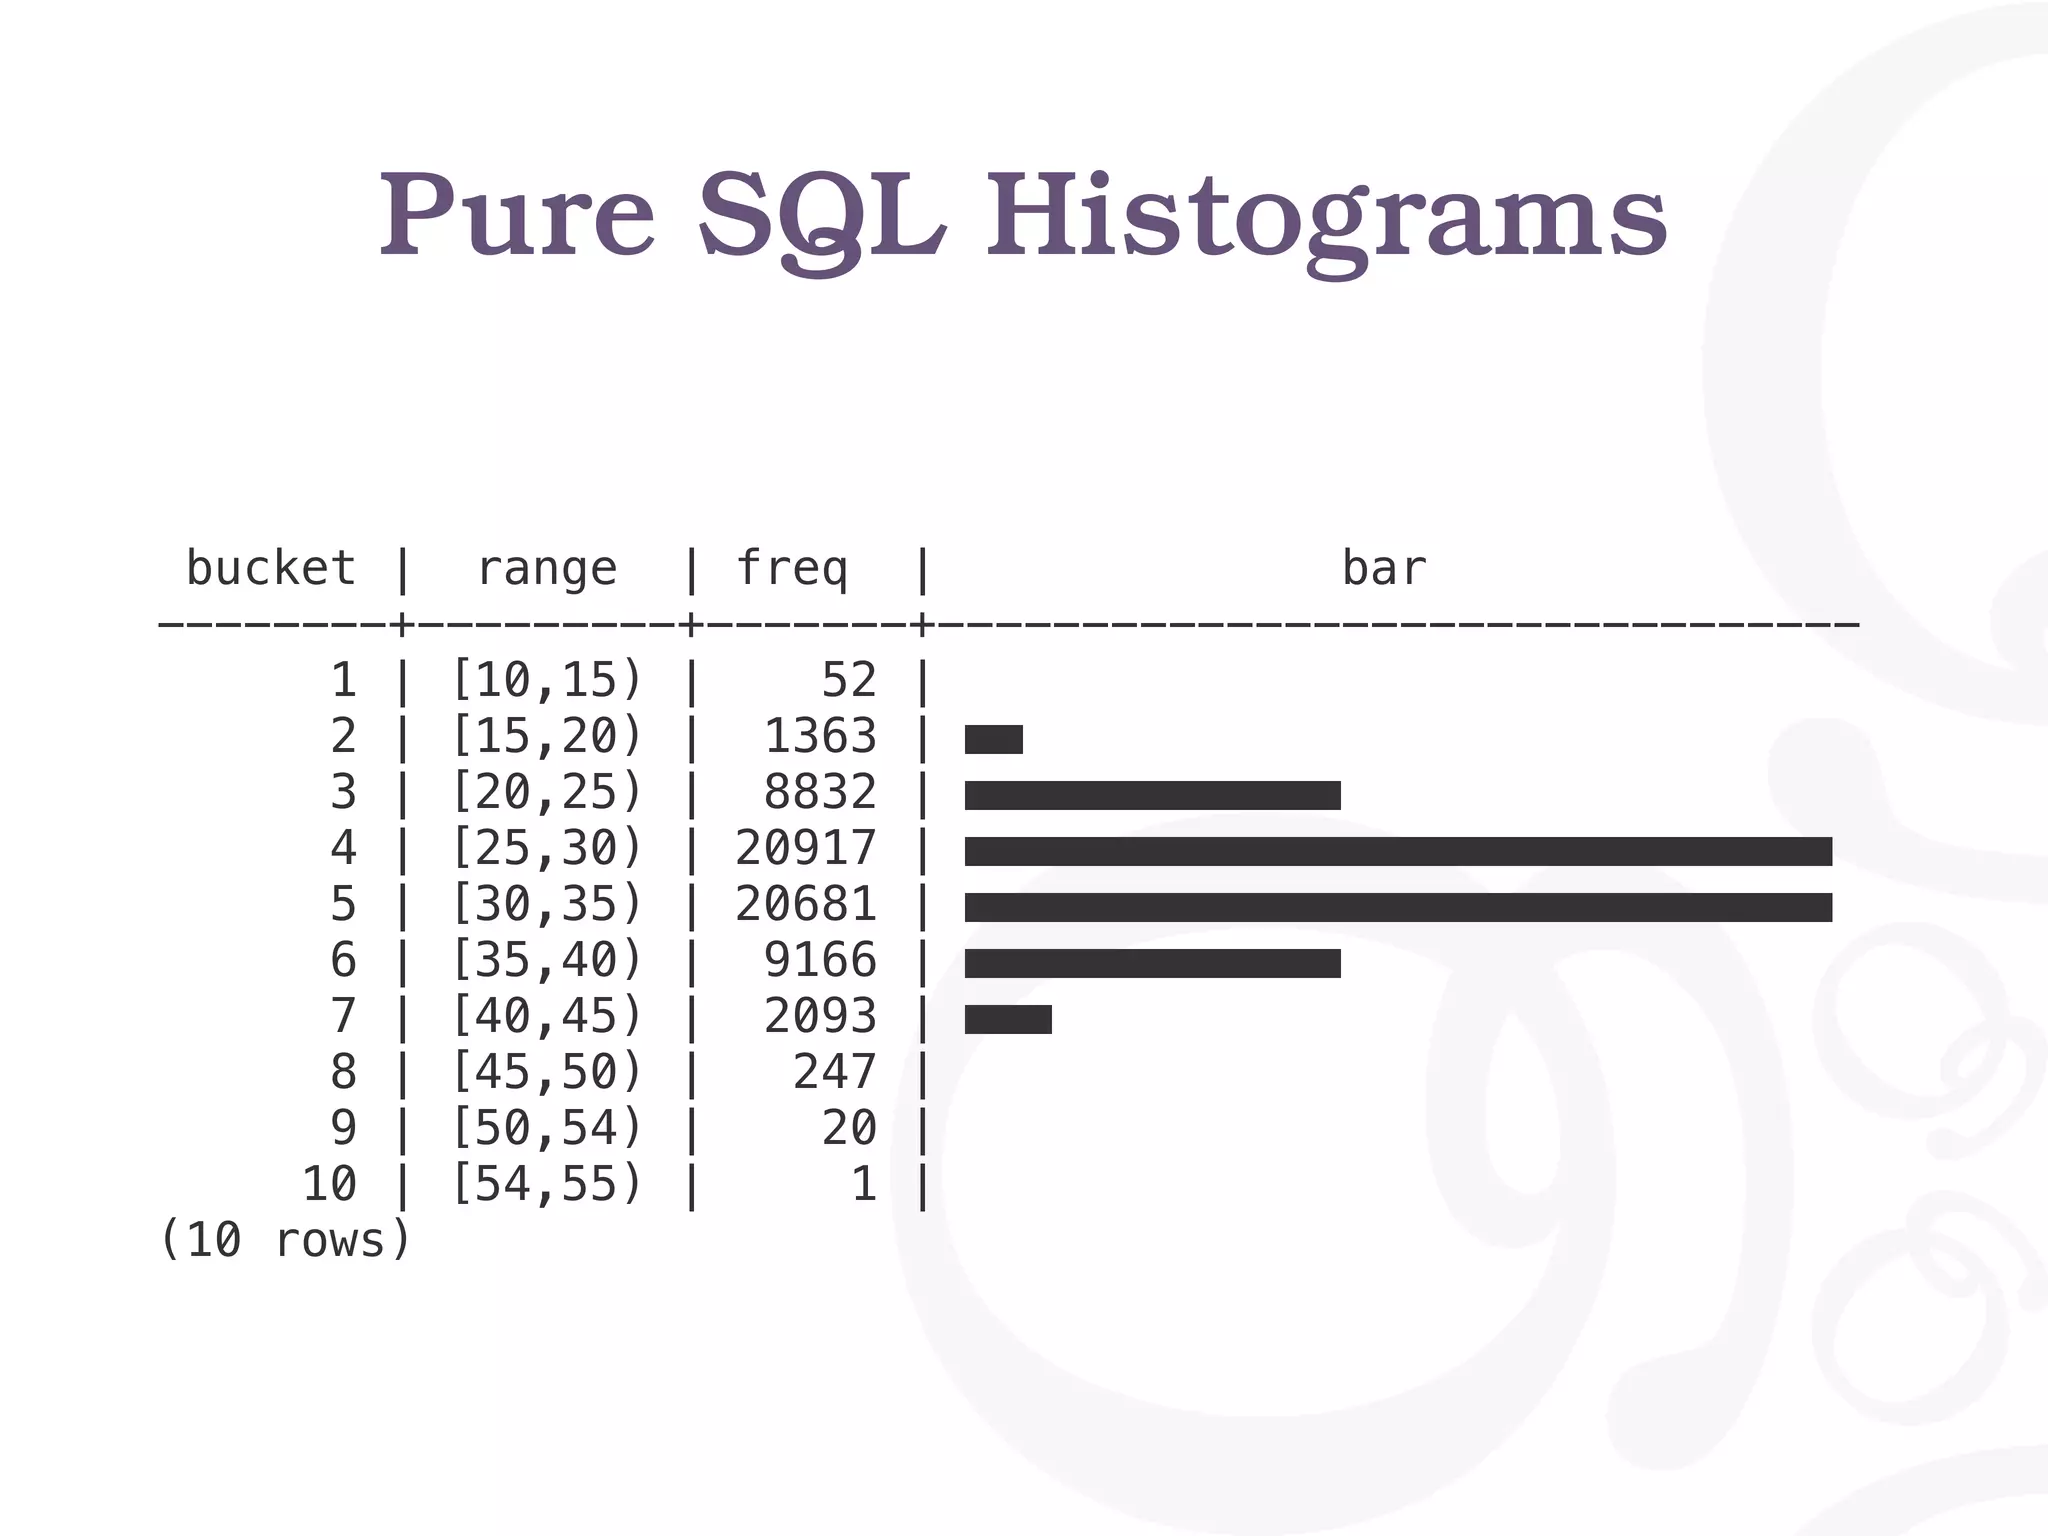
![Pure SQL Histograms
with drb_stats as (
select min(drb) as min,
max(drb) as max
from team_stats
),
histogram as (
select width_bucket(drb, min, max, 9) as bucket,
int4range(min(drb), max(drb), '[]') as range,
count(*) as freq
from team_stats, drb_stats
group by bucket
order by bucket
)
select bucket, range, freq,
repeat('■',
( freq::float
/ max(freq) over()
* 30
)::int
) as bar
from histogram;](https://image.slidesharecdn.com/pyconfr-lille-2018-181106184028/75/Python-and-PostgreSQL-Let-s-Work-Together-PyConFr-2018-Dimitri-Fontaine-59-2048.jpg)


The document discusses the integration of Python with PostgreSQL, highlighting its role in data management, including data modeling, normalization, and query execution. It also showcases practical examples of SQL queries and Python scripts for data retrieval and manipulation from a 'factbook' dataset, including generating monthly reports. Key concepts such as ACID properties and the importance of data structures in programming are emphasized throughout.