


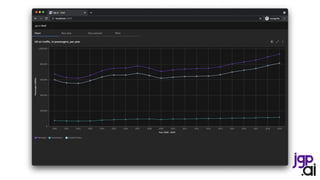

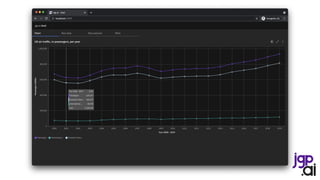
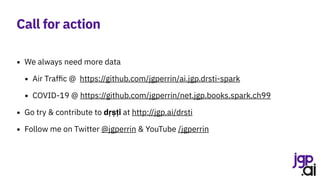
![Apply light data quality
Create a session
Create a schema
SparkSession spark = SparkSession.builder()
.appName("CSV to Dataset")
.master("local[*]")
.getOrCreate();
StructType schema = DataTypes.createStructType(new StructField[] {
DataTypes.createStructField(“month", DataTypes.DateType, false),
DataTypes.createStructField(“pax", DataTypes.IntegerType, true) });
Dataset<Row> internationalPaxDf = spark.read().format("csv")
.option("header", true)
.option("dateFormat", "MMMM yyyy")
.schema(schema)
.load("data/bts/International USCarrier_Traffic_20210902163435.csv");
internationalPaxDf = internationalPaxDf
.withColumnRenamed("pax", "internationalPax")
.filter(col("month").isNotNull())
.filter(col("internationalPax").isNotNull());
Dataset<Row> domesticPaxDf = spark.read().format("csv")
.option("header", true)
.option("dateFormat", "MMMM yyyy")
.schema(schema)
.load("data/bts/Domestic USCarrier_Traffic_20210902163435.csv");
domesticPaxDf = domesticPaxDf
.withColumnRenamed("pax", "domesticPax")
.filter(col("month").isNotNull())
.filter(col("domesticPax").isNotNull());
/jgperrin/ai.jgp.drsti-spark
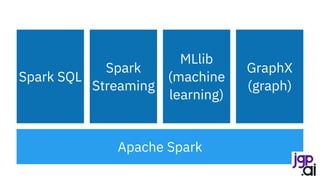
Lab #300
Ingest international passengers
Ingest domestic passengers](https://image.slidesharecdn.com/210915itspainfulhowmuchdatarulestheworld0-210917174757/85/It-s-painful-how-much-data-rules-the-world-13-320.jpg)


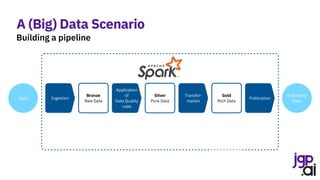
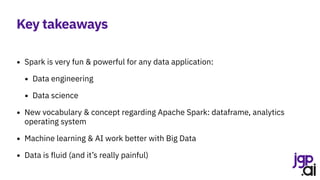
![SparkSession spark = SparkSession.builder()
.appName("CSV to Dataset")
.master("local[*]")
.getOrCreate();
StructType schema = DataTypes.createStructType(new StructField[] {
DataTypes.createStructField(“month", DataTypes.DateType, false),
DataTypes.createStructField(“pax", DataTypes.IntegerType, true) });
Dataset<Row> internationalPaxDf = spark.read().format("csv")
.option("header", true)
.option("dateFormat", "MMMM yyyy")
.schema(schema)
.load("data/bts/International USCarrier_Traffic_20210902163435.csv");
internationalPaxDf = internationalPaxDf
.withColumnRenamed("pax", "internationalPax")
.filter(col("month").isNotNull())
.filter(col("internationalPax").isNotNull());
Dataset<Row> domesticPaxDf = spark.read().format("csv")
.option("header", true)
.option("dateFormat", "MMMM yyyy")
.schema(schema)
.load("data/bts/Domestic USCarrier_Traffic_20210902163435.csv");
domesticPaxDf = domesticPaxDf
.withColumnRenamed("pax", "domesticPax")
.filter(col("month").isNotNull())
.filter(col("domesticPax").isNotNull());
/jgperrin/ai.jgp.drsti-spark
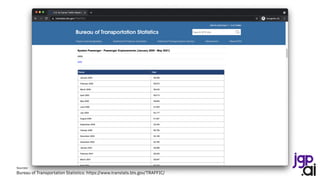
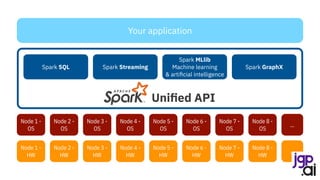
Lab #310](https://image.slidesharecdn.com/210915itspainfulhowmuchdatarulestheworld0-210917174757/85/It-s-painful-how-much-data-rules-the-world-25-320.jpg)

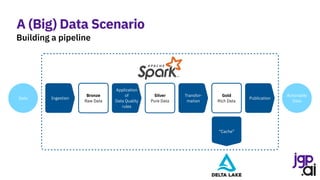
![SparkSession spark = SparkSession.builder()
.appName("CSV to Dataset")
.master("local[*]")
.getOrCreate();
StructType schema = DataTypes.createStructType(new StructField[] {
DataTypes.createStructField(“month", DataTypes.DateType, false),
DataTypes.createStructField(“pax", DataTypes.IntegerType, true) });
Dataset<Row> internationalPaxDf = spark.read().format("csv")
.option("header", true)
.option("dateFormat", "MMMM yyyy")
.schema(schema)
.load("data/bts/International USCarrier_Traffic_20210902163435.csv");
internationalPaxDf = internationalPaxDf
.withColumnRenamed("pax", "internationalPax")
.filter(col("month").isNotNull())
.filter(col("internationalPax").isNotNull());
Dataset<Row> domesticPaxDf = spark.read().format("csv")
.option("header", true)
.option("dateFormat", "MMMM yyyy")
.schema(schema)
.load("data/bts/Domestic USCarrier_Traffic_20210902163435.csv");
domesticPaxDf = domesticPaxDf
.withColumnRenamed("pax", "domesticPax")
.filter(col("month").isNotNull())
.filter(col("domesticPax").isNotNull());
/jgperrin/ai.jgp.drsti-spark
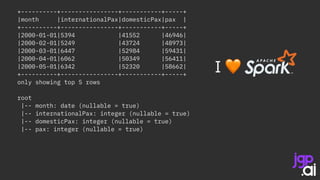
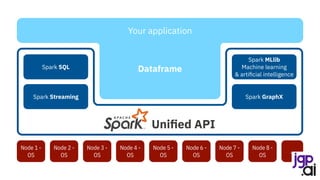
Lab #320](https://image.slidesharecdn.com/210915itspainfulhowmuchdatarulestheworld0-210917174757/85/It-s-painful-how-much-data-rules-the-world-28-320.jpg)


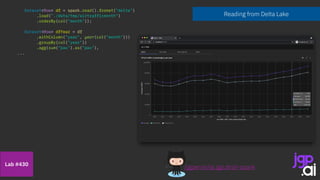


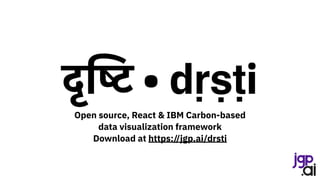
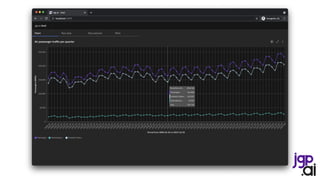
![Use my model
Split training & test data
String[] inputCols = { "year" };
VectorAssembler assembler = new VectorAssembler().setInputCols(inputCols).setOutputCol("features");
df = assembler.transform(df);
LinearRegression lr = new LinearRegression()
.setMaxIter(10)
.setRegParam(0.5)
.setElasticNetParam(0.8)
.setLabelCol("pax");
int threshold = 2019;
Dataset<Row> trainingData = df.filter(col("year").$less$eq(threshold));
Dataset<Row> testData = df.filter(col("year").$greater(threshold));
LinearRegressionModel model = lr.fit(trainingData);
Integer[] l = new Integer[] { 2020, 2021, 2022, 2023, 2024, 2025, 2026 };
List<Integer> data = Arrays.asList(l);
Dataset<Row> futuresDf = spark.createDataset(data, Encoders.INT()).toDF().withColumnRenamed("value", "year");
assembler = new VectorAssembler().setInputCols(inputCols).setOutputCol("features");
futuresDf = assembler.transform(futuresDf);
df = df.unionByName(futuresDf, true);
df = model.transform(df);
Features are a vector - let’s build one
Build a linear regression
Building my model
/jgperrin/ai.jgp.drsti-spark
Lab #500](https://image.slidesharecdn.com/210915itspainfulhowmuchdatarulestheworld0-210917174757/85/It-s-painful-how-much-data-rules-the-world-38-320.jpg)


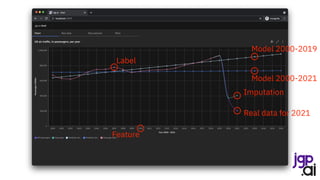


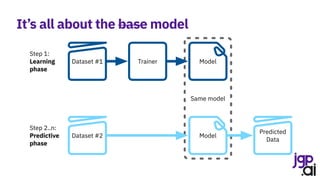


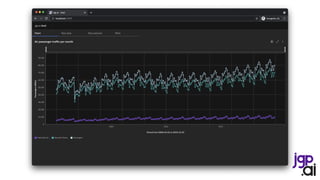
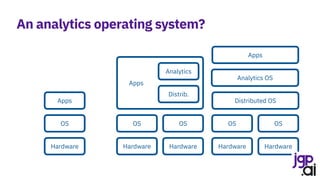
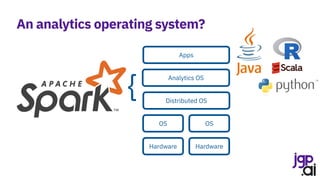
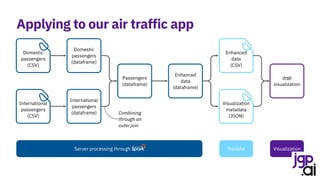
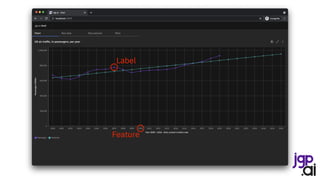
The presentation by Jean-Georges Perrin discusses the importance of data in decision-making, particularly in the context of air traffic analytics. It highlights various data processing techniques using Apache Spark, including reading CSV files, performing joins, and applying linear regression for predictions. Ultimately, the speaker emphasizes the necessity for robust data management and the application of analytics to improve insights into air traffic trends.


![제 23회 보아즈(BOAZ) 빅데이터 컨퍼런스 - [MBOAX] : ABSA를 활용한 소비자 반응 분석 기반 운영 효율화 대시보드 설계](https://cdn.slidesharecdn.com/ss_thumbnails/3-1boaz23rdconferencemboax-260203102709-9d519923-thumbnail.jpg?width=640&height=640&fit=bounds)


