SlideShare a Scribd company logo
1 of 2
Download to read offline
Residential land activity fact sheet*                                                                                   June quarter 2009
Mackay (RC)                                                                                 Whitsunday
                                                                                            Whitsunday
 •   Mackay (RC) approved 1,176 residential lots in                                       Regional Council
                                                                                          Regional Council
     the year to June quarter 2009. This was a
     decrease of 33.1 per cent compared with the
     same period last year when 1,757 lots were
     approved.

 •   357 residential lots were produced in Mackay                                                               Mackay
     (RC) in the year to June quarter 2009.
                                                                                                            Regional Council
     Compared with the previous year when 830
     lots were produced, this was a decrease of 57                                                                            Mirani (      Mackay (
     per cent.

 •   The number of lots registered in Mackay (RC) in the June quarter                                                                                  (
     2009 decreased by 17.4 per cent to 247 registrations compared                                                                                   Sarina
     to 299 registrations recorded in the same period last year. Lot
     registrations in the year ending June 2009 were down 25.1 per                                         Isaac
     cent over the previous year.                                                                     Regional Council

 •   The number of lots consumed in Mackay (RC) in the June
     quarter 2009 decreased by 17.1 per cent to 156 lots when
     compared with the same period last year. Lot consumption for
     the year ending June 2009 was down 25.8 per cent over the
     previous year.                                                                                  type,
                                                                                 Lot registration by type, year ending June 2009
                                                                                                          Buil di ng format
 •   In the June quarter of 2009, 120 vacant land sales were                                                lots (units)
     recorded with a median value of $172,000. This was an                                                        8%
     increase of 9.1 per cent in land sales volume and a decrease of
     7 per cent in median value compared with the same quarter last
     year.                                                                                  Community
                                                                                          ma nagement
 •   In the year ending June 2009, Mackay (RC) recorded a 27.7 per                             lots
     cent decrease in new residential dwelling approvals over the                         (townhouses)                                     Conventi onal
                                                                                               21%
     previous year. A total of 781 approvals, 85.9 per cent of which                                                                        (individual
                                                                                                                                            house lots)
     were for separate houses, compares to 1,080 approvals in 2008.
                                                                                                                                               71%


                Quarterly lot approvals and production
     1,000                                                                           registration          year
                                                                                 Lot registration by size, year ending June 2009
                                                                                                                  < 450
       750                                                                                            2500 - 50000 5%
       500                                                                                                23%                            450 - 600
                                                                                                                                           11%
       250
           0
   ar 2 1


   ar 2 3


             5


   ar 2 7


             9
    p r 6
   ar 2 2


   ar 2 4


   a r 6


   ar r 2 8
    p r2 0

    p r 1

    p r2 2

    p r 3

    p r2 4

  ep r 5


   p r 7

        r2 8
          00
 M qtr 00

 M qtr 200

 M qtr 00

 M qtr 200

 M qtr 00

 M qt 0

 M qtr 200

 M qt 200
 Se qt 00


 Se qt 00


 Se qt 00

 S r qt 200

 Se r qt 200

 Se qt 00
 Se qt 00


 Se qt 00


      qt 00
         20


                                                                                                                                          600 - 800
   ar 2


                                                                                           1001 - 2500
 M qtr


                                                                                              13%                                           26%
    p


   a
 Se


                  Lots approved              Lots produced
                                                                                                             800 - 1000
                                                                                                               22%

               Quarterly lot registration and consumption                        Top 10 LGAs for lots approved year ending June 2009
     450
                                                                           Moret on Bay (R C)                                                                        3626
     300                                                                           Ipswich (C)                                                                3119
     150                                                                          Brisbane (C)                              1467
                                                                              G ladst one (R C)                            1402
       0                                                                      Gold Coast (C)                              1366
                                                                           T oowoomba (R C)                              1302
   a 2 2

   ar r 2 3

   ar 2 4

   ar 2 5


   ar 2 7


               9
   ar r 2 1


   ar 2 6


   ar 2 8
   p r 0

  ep r 1


   p r 2

    p r 3

   p r2 4

    p r 5

   p r2 6

    p r 7

         r2 8


                                                                                 Mac kay (R C)                         1176
 M qtr 20 0


 M qtr 20 0
 M qt 200


 M qt 200


 M qtr 00

 M q tr 20 0

 M qtr 00

 M q tr 20 0

           00
 Se r q t 20 0


 Se r q t 0 0


 Se q t 0 0


 Se q t 00


      q t 00
 S qt 00


 Se qt 00


 Se qt 00


 Se qt 00


                                                                        Sunshine Coast (R C)                          1159
 M qtr


                                                                                    Logan (C)                       1047
  ep
   a


                                                                                 Gympie (R C)                      920
 S


                Lots registered              Lots consumed                                        0             1000                2000               3000           4000
Land development pipeline data
                                                                                                                                                                Mackay (RC)
                   Year to           Lot         Op works      Uncompleted               Lot                                Lot             Lot         Median value      Volume of
                    June          approval ¹     approval         lots ^             production ¹                      registration ²   consumption      land sales ³    land sales ³
                   2001              335           N/A               N/A                                   431              465             236             N/A              N/A
                   2002              451           N/A               N/A                                   268             415              595           $ 57,800           524
                   2003              390           N/A               N/A                                   310             499              534           $ 66,100          680
                   2004              699           N/A               N/A                                   670             811              836           $ 80,500          1,132
                   2005              1,075         N/A               1185                                  822              945             830           $ 116,500         1,029
                   2006              1,574         N/A               2064                                  556              792             837           $ 160,500          690
                   2007             2,434          N/A               3566                                  934             1,119            798           $ 178,200          692
                   2008             1,757         1,150              4523                                  830             1,008            891           $ 183,600          541
                   2009             1,176          590               5377                                  357              755             661           $ 179,100          476
         Sep qtr 2008                185           114               4741                                  31               123             195           $ 185,000          118
         Dec qtr 2008                473           112               5098                                  89               236             170           $ 185,000          111
         Mar qtr 2009                82            268               4990                                  188              149             140           $ 175,000          127
         Jun qtr 2009                436           96                5377                                   49              247             156           $ 172,000          120
¹ : includes urban and rural residential ² : includes 250-50000 m2 lots.
3
  : includes 250-2500 m2 lots.
^: no of lots with planning permit approval, but not yet produced
   (survey plan signing)
                                                                                                                 More detail on these topics available from the
Dwelling activity                                                                                                Planning Information and Forecasting Unit Unit (PIFU)
                                                                                                                   The Planning Information and Forecasting
                                                                                                                   provides a comprehensive range of professional products
                                                                                                                   and services in the areas of population, housing trends,
                   Year to                      Dwelling approvals                                                 projections and urban land supply. Standard and
                    June              Houses           Other                Total                                  customised products are available. Please contact us for
                                                                                                                   further information.
                    2001                309               79                388
                    2002                611               74                 685                                   Department of Infrastructure and Planning
                    2003                580               55                 635                                   Planning Information and Forecasting Unit
                    2004                894              123                1,017                                  PO Box 15009 City East Qld 4002 Australia
                                                                                                                   tel   +61 7 3237 1115 (general enquires)
                    2005                836              165                1,001
                                                                                                                         +61 7 3237 1200 (data enquires)
                    2006                855               77                 932
                                                                                                                   fax   +61 7 3235 4071
                    2007                846              281                1,127                                  pifu@dip.qld.gov.au
                    2008                909              171                1,080
                    2009                671              110                 781
               Sep qtr 2008             187               75                262                                                         www.dip.qld.gov.au
               Dec qtr 2008             163               13                 176
               Mar qtr 2009             126               13                139                                  Sources for the Residential Land activity fact sheet:
               Jun qtr 2009             195                9                204                                  ABS unpublished dwelling approvals data. QDNRM Digital Cadestral
                                                                                                                 Database (DCDB). QDLGP Queensland Residential Land and Dwelling
                                                                                                                 Activity Monitor. QDNRW QVAS database. Copyright 2009 Planning
                     Median residential land values and land sales volume                                        Information and Forecasting Unit, QDIP, Australian Bureau of
                                                                                                                 Statistics
                   450                                                         200
                                                                                     Median(thousands $)


                   400                                                         180                               © The State of Queensland, Department of Infrastructure and
 Number of sales


                   350                                                         160                               Planning, 2009. Please note that intellectual property in the data
                   300                                                         140                               contained in this document provided by the Australian Bureau of
                   250                                                         120                               Statistics vests in the Commonwealth of Australia. The State of
                                                                               100
                   200
                                                                               80                                Queensland, acting through the Department of Infrastructure and
                   150                                                         60                                Planning, supports and encourages the dissemination and exchange
                   100                                                         40                                of information. However, copyright protects this material. The State of
                    50                                                         20                                Queensland, acting through the Department of Infrastructure and
                     0                                                         0                                 Planning, asserts the right to be recognised (except where otherwise
                                                                                                                 noted on the material) as the author of this material and the right to
                                                                                                                 have its material remain unaltered. The Australian Bureau of
Den qt 20 1

  n 2 2


Den q 20 5

Den qt 2 006


             9
  cq r 2 0

   c r 01

 ec tr 2


  c r2 3

  c r2 4

   c qtr 2 0 5

  c r 6

 ec r 7

       r2 8
            3

  n r 4


  n 2 7

  n r2 8
D q 00

Den qt 200


D qt 00
Ju t 00

Ju qtr 200

Ju qtr 200

Ju qt 00

Ju qt 00

Ju tr 00

Ju qtr 200

Ju qt 200

          00
De qt 200


De qt 200


     qt 00


                                                                                                                 Statistics gives no warranty that the data are free from error, are
  n r

       r


       r
Ju qt


                                                                                                                 complete, have particular quality, and are suitable for any purpose or
  c
De


                                                                                                                 otherwise.
                             Number of sales                   Median                                            *includes urban and rural residential zoning

More Related Content

Viewers also liked

Indigenous wisdom and science gaugau tavana
Indigenous wisdom and science gaugau tavanaIndigenous wisdom and science gaugau tavana
Indigenous wisdom and science gaugau tavanakathygallucci
 
Final vcj conference oct 2011
Final vcj conference  oct 2011 Final vcj conference  oct 2011
Final vcj conference oct 2011 Igor Varnavsky
 
Агентство АИТ презентация
Агентство АИТ презентацияАгентство АИТ презентация
Агентство АИТ презентацияmos_ait
 
Byt ut din gamla växel – en djupdykning i Lync telefoni
Byt ut din gamla växel – en djupdykning i Lync telefoniByt ut din gamla växel – en djupdykning i Lync telefoni
Byt ut din gamla växel – en djupdykning i Lync telefoniTommy Clarke
 
Россия — Европейский союз: возможности партнерства
Россия — Европейский союз: возможности партнерстваРоссия — Европейский союз: возможности партнерства
Россия — Европейский союз: возможности партнерстваRussian Council
 
аннотация к викторине
аннотация  к викторинеаннотация  к викторине
аннотация к викторинеrcnovo
 
Надир Хабдулин (Одноклассники.ру), Мск: «Одноклассники как площадка для бизнеса»
Надир Хабдулин (Одноклассники.ру), Мск: «Одноклассники как площадка для бизнеса»Надир Хабдулин (Одноклассники.ру), Мск: «Одноклассники как площадка для бизнеса»
Надир Хабдулин (Одноклассники.ру), Мск: «Одноклассники как площадка для бизнеса»web2win
 
Контент_Эмиграция высококвалифицированных кадров полезна для экономики Украины
Контент_Эмиграция высококвалифицированных кадров полезна для экономики УкраиныКонтент_Эмиграция высококвалифицированных кадров полезна для экономики Украины
Контент_Эмиграция высококвалифицированных кадров полезна для экономики УкраиныPublic Debate
 
Disruptive technologies: Advances that will transform life, business, and the...
Disruptive technologies: Advances that will transform life, business, and the...Disruptive technologies: Advances that will transform life, business, and the...
Disruptive technologies: Advances that will transform life, business, and the...Sustainable Brands
 
Rrrrrrrr
RrrrrrrrRrrrrrrr
Rrrrrrrrtyghj
 
Сообщества в Интернете
Сообщества в ИнтернетеСообщества в Интернете
Сообщества в Интернетеbulat lambaev
 
Licenseb
LicensebLicenseb
Licensebtyghj
 
License
LicenseLicense
Licensetyghj
 
Jstor terms_and_conditions_of_use
Jstor  terms_and_conditions_of_useJstor  terms_and_conditions_of_use
Jstor terms_and_conditions_of_usetyghj
 

Viewers also liked (19)

Bondia Lleida 07062012
Bondia Lleida 07062012Bondia Lleida 07062012
Bondia Lleida 07062012
 
Indigenous wisdom and science gaugau tavana
Indigenous wisdom and science gaugau tavanaIndigenous wisdom and science gaugau tavana
Indigenous wisdom and science gaugau tavana
 
Final vcj conference oct 2011
Final vcj conference  oct 2011 Final vcj conference  oct 2011
Final vcj conference oct 2011
 
Агентство АИТ презентация
Агентство АИТ презентацияАгентство АИТ презентация
Агентство АИТ презентация
 
Byt ut din gamla växel – en djupdykning i Lync telefoni
Byt ut din gamla växel – en djupdykning i Lync telefoniByt ut din gamla växel – en djupdykning i Lync telefoni
Byt ut din gamla växel – en djupdykning i Lync telefoni
 
Россия — Европейский союз: возможности партнерства
Россия — Европейский союз: возможности партнерстваРоссия — Европейский союз: возможности партнерства
Россия — Европейский союз: возможности партнерства
 
аннотация к викторине
аннотация  к викторинеаннотация  к викторине
аннотация к викторине
 
Надир Хабдулин (Одноклассники.ру), Мск: «Одноклассники как площадка для бизнеса»
Надир Хабдулин (Одноклассники.ру), Мск: «Одноклассники как площадка для бизнеса»Надир Хабдулин (Одноклассники.ру), Мск: «Одноклассники как площадка для бизнеса»
Надир Хабдулин (Одноклассники.ру), Мск: «Одноклассники как площадка для бизнеса»
 
Контент_Эмиграция высококвалифицированных кадров полезна для экономики Украины
Контент_Эмиграция высококвалифицированных кадров полезна для экономики УкраиныКонтент_Эмиграция высококвалифицированных кадров полезна для экономики Украины
Контент_Эмиграция высококвалифицированных кадров полезна для экономики Украины
 
Disruptive technologies: Advances that will transform life, business, and the...
Disruptive technologies: Advances that will transform life, business, and the...Disruptive technologies: Advances that will transform life, business, and the...
Disruptive technologies: Advances that will transform life, business, and the...
 
Rrrrrrrr
RrrrrrrrRrrrrrrr
Rrrrrrrr
 
Сообщества в Интернете
Сообщества в ИнтернетеСообщества в Интернете
Сообщества в Интернете
 
Licenseb
LicensebLicenseb
Licenseb
 
License
LicenseLicense
License
 
Jstor terms_and_conditions_of_use
Jstor  terms_and_conditions_of_useJstor  terms_and_conditions_of_use
Jstor terms_and_conditions_of_use
 
Bondia.cat 25/07/2014
Bondia.cat 25/07/2014Bondia.cat 25/07/2014
Bondia.cat 25/07/2014
 
Bondia.cat 22/07/2014
Bondia.cat 22/07/2014Bondia.cat 22/07/2014
Bondia.cat 22/07/2014
 
Bondia.cat 24/07/2014
Bondia.cat 24/07/2014Bondia.cat 24/07/2014
Bondia.cat 24/07/2014
 
SB'15 London - Brochure
SB'15 London - BrochureSB'15 London - Brochure
SB'15 London - Brochure
 

More from chrislaval

Recent Economic News for Mackay
Recent Economic News for MackayRecent Economic News for Mackay
Recent Economic News for Mackaychrislaval
 
West Mackay Growth Chart
West Mackay Growth ChartWest Mackay Growth Chart
West Mackay Growth Chartchrislaval
 
South Mackay Growth Chart
South Mackay Growth ChartSouth Mackay Growth Chart
South Mackay Growth Chartchrislaval
 
Shoal Point Growth Chart
Shoal Point Growth ChartShoal Point Growth Chart
Shoal Point Growth Chartchrislaval
 
Ooralea Growth Chart
Ooralea Growth ChartOoralea Growth Chart
Ooralea Growth Chartchrislaval
 
East Mackay Growth Chart
East Mackay Growth ChartEast Mackay Growth Chart
East Mackay Growth Chartchrislaval
 
Blacks Beach Growth Chart
Blacks Beach Growth ChartBlacks Beach Growth Chart
Blacks Beach Growth Chartchrislaval
 
Eimeo Growth Charts
Eimeo Growth ChartsEimeo Growth Charts
Eimeo Growth Chartschrislaval
 
Mount Pleasant Growth Charts
Mount Pleasant Growth ChartsMount Pleasant Growth Charts
Mount Pleasant Growth Chartschrislaval
 
Pop Housing Fact Sheets Mackay 200908
Pop Housing Fact Sheets Mackay 200908Pop Housing Fact Sheets Mackay 200908
Pop Housing Fact Sheets Mackay 200908chrislaval
 
Pop Growth Highlights Trends Qld 2009
Pop Growth Highlights Trends Qld 2009Pop Growth Highlights Trends Qld 2009
Pop Growth Highlights Trends Qld 2009chrislaval
 
Mackay Regional Profile
Mackay Regional ProfileMackay Regional Profile
Mackay Regional Profilechrislaval
 
E Newsletter 19 February 2010
E Newsletter 19 February 2010E Newsletter 19 February 2010
E Newsletter 19 February 2010chrislaval
 

More from chrislaval (13)

Recent Economic News for Mackay
Recent Economic News for MackayRecent Economic News for Mackay
Recent Economic News for Mackay
 
West Mackay Growth Chart
West Mackay Growth ChartWest Mackay Growth Chart
West Mackay Growth Chart
 
South Mackay Growth Chart
South Mackay Growth ChartSouth Mackay Growth Chart
South Mackay Growth Chart
 
Shoal Point Growth Chart
Shoal Point Growth ChartShoal Point Growth Chart
Shoal Point Growth Chart
 
Ooralea Growth Chart
Ooralea Growth ChartOoralea Growth Chart
Ooralea Growth Chart
 
East Mackay Growth Chart
East Mackay Growth ChartEast Mackay Growth Chart
East Mackay Growth Chart
 
Blacks Beach Growth Chart
Blacks Beach Growth ChartBlacks Beach Growth Chart
Blacks Beach Growth Chart
 
Eimeo Growth Charts
Eimeo Growth ChartsEimeo Growth Charts
Eimeo Growth Charts
 
Mount Pleasant Growth Charts
Mount Pleasant Growth ChartsMount Pleasant Growth Charts
Mount Pleasant Growth Charts
 
Pop Housing Fact Sheets Mackay 200908
Pop Housing Fact Sheets Mackay 200908Pop Housing Fact Sheets Mackay 200908
Pop Housing Fact Sheets Mackay 200908
 
Pop Growth Highlights Trends Qld 2009
Pop Growth Highlights Trends Qld 2009Pop Growth Highlights Trends Qld 2009
Pop Growth Highlights Trends Qld 2009
 
Mackay Regional Profile
Mackay Regional ProfileMackay Regional Profile
Mackay Regional Profile
 
E Newsletter 19 February 2010
E Newsletter 19 February 2010E Newsletter 19 February 2010
E Newsletter 19 February 2010
 

Residential land activity fact sheet highlights for Mackay (RC

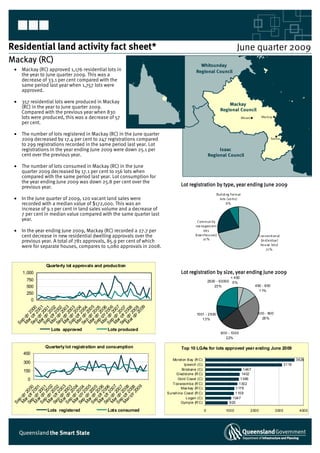
  • 1. Residential land activity fact sheet* June quarter 2009 Mackay (RC) Whitsunday Whitsunday • Mackay (RC) approved 1,176 residential lots in Regional Council Regional Council the year to June quarter 2009. This was a decrease of 33.1 per cent compared with the same period last year when 1,757 lots were approved. • 357 residential lots were produced in Mackay Mackay (RC) in the year to June quarter 2009. Regional Council Compared with the previous year when 830 lots were produced, this was a decrease of 57 Mirani ( Mackay ( per cent. • The number of lots registered in Mackay (RC) in the June quarter ( 2009 decreased by 17.4 per cent to 247 registrations compared Sarina to 299 registrations recorded in the same period last year. Lot registrations in the year ending June 2009 were down 25.1 per Isaac cent over the previous year. Regional Council • The number of lots consumed in Mackay (RC) in the June quarter 2009 decreased by 17.1 per cent to 156 lots when compared with the same period last year. Lot consumption for the year ending June 2009 was down 25.8 per cent over the previous year. type, Lot registration by type, year ending June 2009 Buil di ng format • In the June quarter of 2009, 120 vacant land sales were lots (units) recorded with a median value of $172,000. This was an 8% increase of 9.1 per cent in land sales volume and a decrease of 7 per cent in median value compared with the same quarter last year. Community ma nagement • In the year ending June 2009, Mackay (RC) recorded a 27.7 per lots cent decrease in new residential dwelling approvals over the (townhouses) Conventi onal 21% previous year. A total of 781 approvals, 85.9 per cent of which (individual house lots) were for separate houses, compares to 1,080 approvals in 2008. 71% Quarterly lot approvals and production 1,000 registration year Lot registration by size, year ending June 2009 < 450 750 2500 - 50000 5% 500 23% 450 - 600 11% 250 0 ar 2 1 ar 2 3 5 ar 2 7 9 p r 6 ar 2 2 ar 2 4 a r 6 ar r 2 8 p r2 0 p r 1 p r2 2 p r 3 p r2 4 ep r 5 p r 7 r2 8 00 M qtr 00 M qtr 200 M qtr 00 M qtr 200 M qtr 00 M qt 0 M qtr 200 M qt 200 Se qt 00 Se qt 00 Se qt 00 S r qt 200 Se r qt 200 Se qt 00 Se qt 00 Se qt 00 qt 00 20 600 - 800 ar 2 1001 - 2500 M qtr 13% 26% p a Se Lots approved Lots produced 800 - 1000 22% Quarterly lot registration and consumption Top 10 LGAs for lots approved year ending June 2009 450 Moret on Bay (R C) 3626 300 Ipswich (C) 3119 150 Brisbane (C) 1467 G ladst one (R C) 1402 0 Gold Coast (C) 1366 T oowoomba (R C) 1302 a 2 2 ar r 2 3 ar 2 4 ar 2 5 ar 2 7 9 ar r 2 1 ar 2 6 ar 2 8 p r 0 ep r 1 p r 2 p r 3 p r2 4 p r 5 p r2 6 p r 7 r2 8 Mac kay (R C) 1176 M qtr 20 0 M qtr 20 0 M qt 200 M qt 200 M qtr 00 M q tr 20 0 M qtr 00 M q tr 20 0 00 Se r q t 20 0 Se r q t 0 0 Se q t 0 0 Se q t 00 q t 00 S qt 00 Se qt 00 Se qt 00 Se qt 00 Sunshine Coast (R C) 1159 M qtr Logan (C) 1047 ep a Gympie (R C) 920 S Lots registered Lots consumed 0 1000 2000 3000 4000
  • 2. Land development pipeline data Mackay (RC) Year to Lot Op works Uncompleted Lot Lot Lot Median value Volume of June approval ¹ approval lots ^ production ¹ registration ² consumption land sales ³ land sales ³ 2001 335 N/A N/A 431 465 236 N/A N/A 2002 451 N/A N/A 268 415 595 $ 57,800 524 2003 390 N/A N/A 310 499 534 $ 66,100 680 2004 699 N/A N/A 670 811 836 $ 80,500 1,132 2005 1,075 N/A 1185 822 945 830 $ 116,500 1,029 2006 1,574 N/A 2064 556 792 837 $ 160,500 690 2007 2,434 N/A 3566 934 1,119 798 $ 178,200 692 2008 1,757 1,150 4523 830 1,008 891 $ 183,600 541 2009 1,176 590 5377 357 755 661 $ 179,100 476 Sep qtr 2008 185 114 4741 31 123 195 $ 185,000 118 Dec qtr 2008 473 112 5098 89 236 170 $ 185,000 111 Mar qtr 2009 82 268 4990 188 149 140 $ 175,000 127 Jun qtr 2009 436 96 5377 49 247 156 $ 172,000 120 ¹ : includes urban and rural residential ² : includes 250-50000 m2 lots. 3 : includes 250-2500 m2 lots. ^: no of lots with planning permit approval, but not yet produced (survey plan signing) More detail on these topics available from the Dwelling activity Planning Information and Forecasting Unit Unit (PIFU) The Planning Information and Forecasting provides a comprehensive range of professional products and services in the areas of population, housing trends, Year to Dwelling approvals projections and urban land supply. Standard and June Houses Other Total customised products are available. Please contact us for further information. 2001 309 79 388 2002 611 74 685 Department of Infrastructure and Planning 2003 580 55 635 Planning Information and Forecasting Unit 2004 894 123 1,017 PO Box 15009 City East Qld 4002 Australia tel +61 7 3237 1115 (general enquires) 2005 836 165 1,001 +61 7 3237 1200 (data enquires) 2006 855 77 932 fax +61 7 3235 4071 2007 846 281 1,127 pifu@dip.qld.gov.au 2008 909 171 1,080 2009 671 110 781 Sep qtr 2008 187 75 262 www.dip.qld.gov.au Dec qtr 2008 163 13 176 Mar qtr 2009 126 13 139 Sources for the Residential Land activity fact sheet: Jun qtr 2009 195 9 204 ABS unpublished dwelling approvals data. QDNRM Digital Cadestral Database (DCDB). QDLGP Queensland Residential Land and Dwelling Activity Monitor. QDNRW QVAS database. Copyright 2009 Planning Median residential land values and land sales volume Information and Forecasting Unit, QDIP, Australian Bureau of Statistics 450 200 Median(thousands $) 400 180 © The State of Queensland, Department of Infrastructure and Number of sales 350 160 Planning, 2009. Please note that intellectual property in the data 300 140 contained in this document provided by the Australian Bureau of 250 120 Statistics vests in the Commonwealth of Australia. The State of 100 200 80 Queensland, acting through the Department of Infrastructure and 150 60 Planning, supports and encourages the dissemination and exchange 100 40 of information. However, copyright protects this material. The State of 50 20 Queensland, acting through the Department of Infrastructure and 0 0 Planning, asserts the right to be recognised (except where otherwise noted on the material) as the author of this material and the right to have its material remain unaltered. The Australian Bureau of Den qt 20 1 n 2 2 Den q 20 5 Den qt 2 006 9 cq r 2 0 c r 01 ec tr 2 c r2 3 c r2 4 c qtr 2 0 5 c r 6 ec r 7 r2 8 3 n r 4 n 2 7 n r2 8 D q 00 Den qt 200 D qt 00 Ju t 00 Ju qtr 200 Ju qtr 200 Ju qt 00 Ju qt 00 Ju tr 00 Ju qtr 200 Ju qt 200 00 De qt 200 De qt 200 qt 00 Statistics gives no warranty that the data are free from error, are n r r r Ju qt complete, have particular quality, and are suitable for any purpose or c De otherwise. Number of sales Median *includes urban and rural residential zoning