
Recommended
Recommended
More Related Content
Similar to Systems diagrams & visualization (uml & data flow)exampl
Similar to Systems diagrams & visualization (uml & data flow)exampl (20)
More from cherry686017
More from cherry686017 (20)
Recently uploaded
Recently uploaded (20)
Systems diagrams & visualization (uml & data flow)exampl
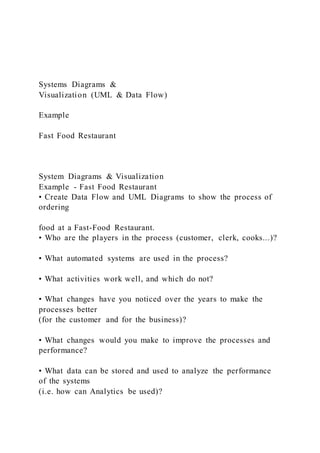
- 1. Systems Diagrams & Visualization (UML & Data Flow) Example Fast Food Restaurant System Diagrams & Visualization Example - Fast Food Restaurant • Create Data Flow and UML Diagrams to show the process of ordering food at a Fast-Food Restaurant. • Who are the players in the process (customer, clerk, cooks...)? • What automated systems are used in the process? • What activities work well, and which do not? • What changes have you noticed over the years to make the processes better (for the customer and for the business)? • What changes would you make to improve the processes and performance? • What data can be stored and used to analyze the performance of the systems (i.e. how can Analytics be used)?
- 2. FastFood - Use Case Diagram Customer Cashier Place Order Pay Order Deliver Order The Use Case diagram is a high-level diagram that identifies an Actor’s interactions with a system. It is not meant to get into details. Details are covered in other types of diagrams. A Customer places an order with a Cashier (or Kiosk) and then pays the Cashier (or via the Kiosk). The Cashier then delivers the order to the Customer. Notice this does not try to show the different between a drive-in transaction versus a walk-in; Or a person or a kiosk (like Taco Bell or McDonalds) FastFood Activity Diagram Cashier Order System Payment System Cook
- 3. Process Payment Process Order Request Payment Refund Difference Enter Order Display Order & Total Process Payment Confirm Payment & Refund Cook ItemsProcess Order Stage Items Order Complete? NO YES Deliver
- 4. Order Stage Order Receive Order The Activity diagram provides details on the activities of a process using “Swim Lanes”. In this case, the customer places the order with the Cashier who enters the order and receives details from the Order system and enters the payment and receives details from the Payment system. Note in this diagram that the actual order is not transmitted to the Cook until the transactions are processed. How might this diagram be different if the customer used a Kiosk rather than a Cashier? FastFood - Sequence Diagram returnRefund (refund) placeOrder (orderList, exceptions) enterOrder (orderList, exceptions)
- 5. displayOrder (orderList, exceptions, totalCost) confirmOrder (orderList, exceptions, totalCost) payBill (payment) processPayment (payment) confirmPayment (payment, refund) processOrder (orderList, exceptions) stageOrder (preparedItems) deliverOrder (packagedItems) x x Customer Cashier Order System Payment System The Sequence diagram shows the sequence of activities. The Customer places an order as a list of items (with exceptions) and the Cashier enters them into the Order system. The order is displayed back. The Customer makes a payment
- 6. which triggers the order to the Cook and to the Payment system. The payment is displayed back, and the Cashier refunds any overpayment. The Cook stages the order items, and the Cashier gives them to the Customer when complete. Notice bars that extend down and represent the approximate time needed to satisfy an action. The X’s at the bottom represent the last actions. These just happen to end at the same time. Payment System Cook FastFood - Communication Diagram :: orderSystem:: paymentSystem 1. Place Order 5. Pay Bill 2. Enter Order 3. Display Order 8. Confirm Payment
- 7. 10. Stage Order Customer Cashier Cook6. Process Order 4. Confirm Order 9. Refund 11. Deliver Order 7. Process Payment The Communication diagram shows the interaction of the actors/systems. Notice the numbers represent the sequence. Notice the symbols used to represent a system. FastFood Data Flow Diagram Level 0 1 Place Order 2
- 8. Calculate Bill 3 Pay Bill 4 Prepare Order 5 Package Order 6 Deliver Order Customer Refund Item Price Payment Amount Total Bill Order List & Exceptions
- 9. Packaged Order Prepared Items D1 Temp Data Store Order List & Exceptions Payment The Data Flow diagram shows how data flows within the process. This is Level 0 which is the highest level. A Temp Data Store is shown and could be incorporated in the next levels. FastFood - Statechart Diagram Pending Order Customer Places Order Confirmed Order Payment
- 10. Made Staged Order Cooked Items placed in Bin Packaged Order Items placed in Bag Order given to Customer Request Payment Customer Notified of Cost Cook Order Order sent to Cook for Processing The Statechart diagram shows states (i.e. waiting for something) within the process. Once the Customer places the
- 11. order, it is ‘pending’ approval (awaiting cashier data entry and system response). Once the Customer is told the cost, it is ‘pending’ customer acceptance and payment. Once payment is made, it is ‘pending’ acceptance by the cashier or card processor. Etc. Notice the loops indicating that all items are not finished cooking at the same time and are bagged as they are ready and discovered by the Cashier. FastFood - Class Diagram Cashier orderList exceptions totalCost payment refund preparedItems packagedOrder Cook
- 12. orderList exceptions preparedItems Order System orderList exceptions totalCost Payment System payment refund Customer places Order Order delivered to Customer Enter into Confirms to Processes a Confirmed to The Class diagram shows the structure of a system. The top box provides the name of the class. The middle box contains the attributes
- 13. (fields) of the class. The bottom box contains the operations the class can execute. Lines connect and describe the actions taken (Cashier processes a Payment and the Payment is confirmed by the Cashier); etc. receiveCustomerOrder() deliverOrderToCustomer() enterOrderInOrderSystem() placeOrderWithCook() receiveCustomerPayment() processPaymentInPaySystem() returnRefundToCustomer() processOrder() displayOrder() processPayment() confirmPayment() cookOrder() stageOrder()
- 14. Policy Practice PowerPoint Presentation The purpose of this assignment is to give you the opportunity to learn about the process of how proposed legislation becomes a law and the political forces involved. You will also have the opportunity to engage in policy practice by persuading your classmates to take action on behalf of the bill. 1. Identify a bill or amendment (no resolutions) that advances social well-being and is being considered by your state legislature. (I LIVE IN NEW YORK!) You may want to identify more than one bill in case your first choice is killed early. You may want to choose a state bill that is related to your comprehensive assignment (paper).Presentations submitted on federal legislation will receive a 0 for the assignment. 2. Interview at least one person who is committed to the bill (a stakeholder). This may be the bill’s sponsor, a committee staff person, an aide to the legislator, a lobbyist, a state agency bureaucrat, a beneficiary of the bill, a community or state leader, etc. NOTE: Do not just email a list of the questi ons to someone and expect her/him to respond. Interview a real person, either face-to-face, Skype, or on the telephone. Failure to complete the interview will result in a 0 for the assignment. In addition to referring to and correctly citing the interview , you will provide the instructor a report indicating your bill choice and stakeholder. (see below)For this portion, please include the name of the stakeholder, their e-mail, contact number, etc. for the instructor to believe the interview took place in New York. 3. Use a variety of source-types such as academic research articles, news articles, interviews with stakeholders, government reports, etc. 4. Create a PowerPoint presentation that discusses the issue
- 15. below (no more than 10 slides) with a short, audio discussion accompanying each slide. You may use the following bullet points in your presentation, but please also refer to the grading rubric for this assignment. The presentation should last no more than 10 minutes. Upload your presentation to your Moodle course page and the Social Forum so that it can be viewed by the class. Include this information: a. Basic description of bill and its purpose (what problem does it address?) b. What cultural values underpin the bill (family, work, self- reliance, etc.) and how the problem is understood? c. Who is affected, directly and indirectly? In what way(s) will the bill affect social justice, oppression and discrimination issues? d. Political pressure for/against the bill. e. Role of service recipients in the development and/or passage of the bill. f. Costs of implementation, who will implement, and timeframe g. Analysis of the policy’s development (see rubric) h. Note: The final step of this assignment is to engage your classmates in supporting your bill, much as you would in actual policy practice. You may be as creative as you like. Consider asking them to identify their legislators, write a letter to the editor of a newspaper, create a petition on change.org, create a talking point on the signature to their email, etc. Tips for Creating Good PowerPoints · Keep it simple.
- 16. · Use plenty of white space · Use text minimally. Follow “general rule” of no more than 6 lines of text, with no more than 6 words per line (this is approximate, not exact) · Make it visually engaging by using graphics, but don’t overdo it by making it too “busy.” · Use the same font on each slide · Use animations sparingly · To learn how to set up a PowerPoint presentation using APA 6th edition formatting, click here. · To learn how to narrate a PPT file, click here. ***** The last slide of the power point should be REFERENCES in APA format.*** PowerPoint Policy Presentation Topic and Stakeholder Report Name: Date submitted: State Bill Name/Number: State Legislature Link to Bill: Name of Stakeholder: Stakeholder’s Email Address: Date of Interview: Describe the Stakeholder’s role in relation to the bill:
- 17. 3 Grading Rubric: Comprehensive Policy Analysis SW 401 – Comprehensive Policy Analysis % Excellent (4) Competent (3) Developing (2) Insufficient (1) Points Identifies social problem, possible causes and interventions to address the problem in society. 20 Excellent ability to describe social problem, multiple problems, interventions and impact on society. Adequate identification of social problem, causes and interventions in society. Limited reference to social problem, causes or interventions in society. No reference to social problem, causes or interventions to address problem in society. Analyzes and formulates policies at various levels that impact well-being and service delivery. Analyzes contexts in which policy emerged and main dimensions of the policy. (Comp. 5 S) 40 Demonstrates excellent ability to analyze social policy, its impact, contexts, dimensions of the policy and societal impact.
- 18. Adequate discussion of policy analysis, impact, contexts and dimensions. Minimal discussion of policy analysis, impact, contexts and dimensions. Analysis of policy did not include impact, contexts and main dimensions. Analyzes effect of policy on racial/ethnic groups-advancement of human rights and social, economic, and environmental justice. (Comp. 5 CAP) 15 Provides excellent commentary on policy’s effect on minority groups and/or the advancement of human rights/ justice i ssues, including historical context. Adequate discussion of effect of policy on racial/ethnic groups or advancement of human rights/ justice issues. Minimal discussion of effect of policy on racial/ethnic groups or the advancement of human rights/ justice issues. Did not address effect of policy on racial/ethnic groups or the advancement of human rights/ justice issues. Proper use of source material and APA style of referencing. 15 Identifies and appraises multiple sources of knowledge regarding social policy. Demonstrates competency in APA style. Sources for assignment were adequate and few errors in APA referencing. Used minimal resources for assignment and incorrect use of APA style. Use inappropriate sources for assignment and incorrect use of APA. Correct use of grammar, spelling, sentence structure, punctuation. 10
- 19. Good flow of information with no errors noted that affect an approximation to professional writing. Mechanical errors are distraction, but do not confuse understanding. Mechanical errors hinder the connection of ideas. Many mechanical errors in paper, poor flow of information. Order #237528387 New York State Bill (4 pages, 8 slides) Type of service: Writing from scratch Work type: Research paper Deadline: (24h) Academic level: College (3-4 years: Junior, Senior) Subject or Discipline: Law Title: New York State Bill Number of sources: 3 Provide digital sources used: No Paper format: APA # of pages: 4 Spacing: Double spaced # of words: 1100
- 20. # of slides: ppt icon 8 # of charts: 0 Paper details: Policy Practice Power Point Presentation - New York State Bill - For this assignment I have to complete a power point hitting points A through G of the attached file (assignment guideline). Over the PowerPoint, I will be recording my voice reading the actual research paper; discussing the information on the PowerPoint. The tricky part is that for this assignment is that the professor has to believe I interviewed a stakeholder of the policy. I need to include his/her contact information in the slides and a little briefing of our "conversation" during the "interview". If you have any questions, feel free to reach out. Comments: Customer local details 03:09 AM, United States of America # Files Who Uploaded 1 237528387_Policy_Pra...130884581995046.docx Guidelines for writing 26 KB 27 Mar, 03:27 AM Customer
- 21. Systems Diagrams and Visualization Project Create the following UML diagrams to visualize the process of completing the IT project from the previous exercise (providing IT services for a new building): • Use Case diagram • Activity diagram • Communications diagram • Data Flow diagram Assume the following basic processes: 1. Procurement of all resources. 2. Setup of PCs and network servers. 3. Deployment and Testing of resources to the IT Area/Office. 4. Deployment and Testing of resources to the Administrative Area. 5. Deployment and Testing of resources to the Conference Room. 6. Deployment and Testing of resources to the Meeting Room. 7. Deployment and Testing of resources to the Individual Offices.
- 22. 8. Deployment and Testing of resources to the Computer Labs. 9. Testing of all Other Locations. • Create a Use Case diagram to show all actors and the basic processes above o Procurement, Setup, Deployment & testing of each major location. • Create an Activity diagram to show the deployment and testing of resources into the Computer Labs o Network connectivity testing requires interaction between the PC and Network Specialist o Projector connectivity testing requires interaction between the PC and AV Specialist. • Create a Communications diagram to show collaboration between the PC Specialist, the Network Specialist and the AV Specialist during deployment and testing of resources into the Computer Labs. o If network connectivity issues arise, the PC Specialist will communicate with the Network Specialist. o If projector connectivity issues arise, the PC Specialist will communicate with the AV Specialist.
- 23. • Create a Data Flow diagram to show the Procurement of all resources, based on this additional information: o The PC Specialist enters all purchases into the Purchase Application system once the resources are purchased. o The PC Specialists closes all purchases in the Purchase Application system once the resources are received.