Report
Share
Recommended
Recommended
https://app.box.com/s/x7vf0j7xaxl2hlczxm3ny497y4yto33i80 ĐỀ THI THỬ TUYỂN SINH TIẾNG ANH VÀO 10 SỞ GD – ĐT THÀNH PHỐ HỒ CHÍ MINH NĂ...
80 ĐỀ THI THỬ TUYỂN SINH TIẾNG ANH VÀO 10 SỞ GD – ĐT THÀNH PHỐ HỒ CHÍ MINH NĂ...Nguyen Thanh Tu Collection
Model Call Girl Services in Delhi reach out to us at 🔝 9953056974🔝✔️✔️ Our agency presents a selection of young, charming call girls available for bookings at Oyo Hotels. Experience high-class escort services at pocket-friendly rates, with our female escorts exuding both beauty and a delightful personality, ready to meet your desires. Whether it's Housewives, College girls, Russian girls, Muslim girls, or any other preference, we offer a diverse range of options to cater to your tastes. We provide both in- call and out-call services for your convenience. Our in-call location in Delhi ensures cleanliness, hygiene, and 100% safety, while our out-call services offer doorstep delivery for added ease. We value your time and money, hence we kindly request pic collectors, time-passers, and bargain hunters to refrain from contacting us. Our services feature various packages at competitive rates: One shot: ₹2000/in-call, ₹5000/out-call Two shots with one girl: ₹3500 /in-call, ₱6000/out-call Body to body massage with sex: ₱3000/in-call Full night for one person: ₱7000/in-call, ₱10000/out-call Full night for more than 1 person : Contact us at 🔝 9953056974🔝. for details Operating 24/7, we serve various locations in Delhi, including Green Park, Lajpat Nagar, Saket, and Hauz Khas near metro stations. For premium call girl services in Delhi 🔝 9953056974🔝. Thank you for considering us Call Girls in Uttam Nagar (delhi) call me [🔝9953056974🔝] escort service 24X7
Call Girls in Uttam Nagar (delhi) call me [🔝9953056974🔝] escort service 24X79953056974 Low Rate Call Girls In Saket, Delhi NCR
Mehran University Newsletter is a Quarterly Publication from Public Relations OfficeMehran University Newsletter Vol-X, Issue-I, 2024
Mehran University Newsletter Vol-X, Issue-I, 2024Mehran University of Engineering & Technology, Jamshoro
More Related Content
Recently uploaded
https://app.box.com/s/x7vf0j7xaxl2hlczxm3ny497y4yto33i80 ĐỀ THI THỬ TUYỂN SINH TIẾNG ANH VÀO 10 SỞ GD – ĐT THÀNH PHỐ HỒ CHÍ MINH NĂ...
80 ĐỀ THI THỬ TUYỂN SINH TIẾNG ANH VÀO 10 SỞ GD – ĐT THÀNH PHỐ HỒ CHÍ MINH NĂ...Nguyen Thanh Tu Collection
Model Call Girl Services in Delhi reach out to us at 🔝 9953056974🔝✔️✔️ Our agency presents a selection of young, charming call girls available for bookings at Oyo Hotels. Experience high-class escort services at pocket-friendly rates, with our female escorts exuding both beauty and a delightful personality, ready to meet your desires. Whether it's Housewives, College girls, Russian girls, Muslim girls, or any other preference, we offer a diverse range of options to cater to your tastes. We provide both in- call and out-call services for your convenience. Our in-call location in Delhi ensures cleanliness, hygiene, and 100% safety, while our out-call services offer doorstep delivery for added ease. We value your time and money, hence we kindly request pic collectors, time-passers, and bargain hunters to refrain from contacting us. Our services feature various packages at competitive rates: One shot: ₹2000/in-call, ₹5000/out-call Two shots with one girl: ₹3500 /in-call, ₱6000/out-call Body to body massage with sex: ₱3000/in-call Full night for one person: ₱7000/in-call, ₱10000/out-call Full night for more than 1 person : Contact us at 🔝 9953056974🔝. for details Operating 24/7, we serve various locations in Delhi, including Green Park, Lajpat Nagar, Saket, and Hauz Khas near metro stations. For premium call girl services in Delhi 🔝 9953056974🔝. Thank you for considering us Call Girls in Uttam Nagar (delhi) call me [🔝9953056974🔝] escort service 24X7
Call Girls in Uttam Nagar (delhi) call me [🔝9953056974🔝] escort service 24X79953056974 Low Rate Call Girls In Saket, Delhi NCR
Mehran University Newsletter is a Quarterly Publication from Public Relations OfficeMehran University Newsletter Vol-X, Issue-I, 2024
Mehran University Newsletter Vol-X, Issue-I, 2024Mehran University of Engineering & Technology, Jamshoro
Recently uploaded (20)
HMCS Max Bernays Pre-Deployment Brief (May 2024).pptx
HMCS Max Bernays Pre-Deployment Brief (May 2024).pptx
Exploring_the_Narrative_Style_of_Amitav_Ghoshs_Gun_Island.pptx
Exploring_the_Narrative_Style_of_Amitav_Ghoshs_Gun_Island.pptx
Basic Civil Engineering first year Notes- Chapter 4 Building.pptx
Basic Civil Engineering first year Notes- Chapter 4 Building.pptx
80 ĐỀ THI THỬ TUYỂN SINH TIẾNG ANH VÀO 10 SỞ GD – ĐT THÀNH PHỐ HỒ CHÍ MINH NĂ...
80 ĐỀ THI THỬ TUYỂN SINH TIẾNG ANH VÀO 10 SỞ GD – ĐT THÀNH PHỐ HỒ CHÍ MINH NĂ...
21st_Century_Skills_Framework_Final_Presentation_2.pptx
21st_Century_Skills_Framework_Final_Presentation_2.pptx
Call Girls in Uttam Nagar (delhi) call me [🔝9953056974🔝] escort service 24X7
Call Girls in Uttam Nagar (delhi) call me [🔝9953056974🔝] escort service 24X7
Python Notes for mca i year students osmania university.docx
Python Notes for mca i year students osmania university.docx
Food safety_Challenges food safety laboratories_.pdf
Food safety_Challenges food safety laboratories_.pdf
Featured
More than Just Lines on a Map: Best Practices for U.S Bike Routes
This session highlights best practices and lessons learned for U.S. Bike Route System designation, as well as how and why these routes should be integrated into bicycle planning at the local and regional level.
Presenters:
Presenter: Kevin Luecke Toole Design Group
Co-Presenter: Virginia Sullivan Adventure Cycling AssociationMore than Just Lines on a Map: Best Practices for U.S Bike Routes
More than Just Lines on a Map: Best Practices for U.S Bike RoutesProject for Public Spaces & National Center for Biking and Walking
Featured (20)
How to Prepare For a Successful Job Search for 2024
How to Prepare For a Successful Job Search for 2024
Social Media Marketing Trends 2024 // The Global Indie Insights
Social Media Marketing Trends 2024 // The Global Indie Insights
Trends In Paid Search: Navigating The Digital Landscape In 2024
Trends In Paid Search: Navigating The Digital Landscape In 2024
5 Public speaking tips from TED - Visualized summary
5 Public speaking tips from TED - Visualized summary
Google's Just Not That Into You: Understanding Core Updates & Search Intent
Google's Just Not That Into You: Understanding Core Updates & Search Intent
The six step guide to practical project management
The six step guide to practical project management
Beginners Guide to TikTok for Search - Rachel Pearson - We are Tilt __ Bright...
Beginners Guide to TikTok for Search - Rachel Pearson - We are Tilt __ Bright...
Unlocking the Power of ChatGPT and AI in Testing - A Real-World Look, present...
Unlocking the Power of ChatGPT and AI in Testing - A Real-World Look, present...
More than Just Lines on a Map: Best Practices for U.S Bike Routes
More than Just Lines on a Map: Best Practices for U.S Bike Routes
Ride the Storm: Navigating Through Unstable Periods / Katerina Rudko (Belka G...
Ride the Storm: Navigating Through Unstable Periods / Katerina Rudko (Belka G...
Good Stuff Happens in 1:1 Meetings: Why you need them and how to do them well
Good Stuff Happens in 1:1 Meetings: Why you need them and how to do them well
Task 14
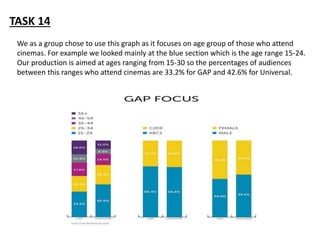
- 1. TASK 14 We as a group chose to use this graph as it focuses on age group of those who attend cinemas. For example we looked mainly at the blue section which is the age range 15-24. Our production is aimed at ages ranging from 15-30 so the percentages of audiences between this ranges who attend cinemas are 33.2% for GAP and 42.6% for Universal.