Download as PDF, PPTX
![Overview of CBO’s Growth Model
QNFB = F [LNFB, KNFB, TFPNFB]
Where
■ QNFB = real GDP in the non-farm business sector;
■ LNFB = index of hours worked;
■ KNFB = index of real capital services from 7
different types of capital assets; and
■ TFPNFB = total factor productivity (a residual)
CONGRESSIONAL BUDGET OFFICE](https://image.slidesharecdn.com/cboforecastnabepresentation07-31-12-120802080518-phpapp02/85/Productivity-and-Growth-in-CBO-s-Forecasts-5-320.jpg)
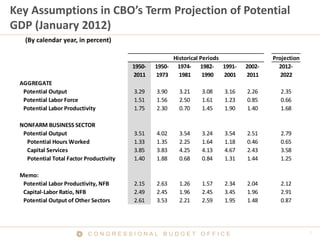

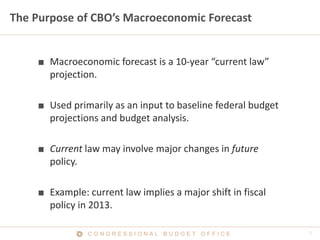
The Congressional Budget Office (CBO) produces a 10-year economic forecast that is used as an input for federal budget projections. The forecast is based on a "current law" approach and includes projections for potential output, labor force, productivity, and capital stock. CBO's long-term forecast relies on a neoclassical growth model, while the near-term outlook uses an econometric model. The forecast assumes gradually declining growth rates for potential output and productivity over the projection period.