
Recommended
Recommended
More Related Content
Similar to Deliverable 6 - Profit Maximizing Quantity and Price Present.docx
Similar to Deliverable 6 - Profit Maximizing Quantity and Price Present.docx (12)
More from cargillfilberto
More from cargillfilberto (20)
Recently uploaded
Recently uploaded (20)
Deliverable 6 - Profit Maximizing Quantity and Price Present.docx
- 1. Deliverable 6 - Profit Maximizing Quantity and Price Presentation Competency Understand economic terminology and economic definitions pertaining to decisions made by managers. Course Scenario Oil Company X is a large oil refinery which has been expanding and taking on new investment projects. Recently, they have considered building a pipeline that stretches across the United States, from Canada to New Orleans. As an alternate investment, they are considering increasing production at existing facilities. In order to compare these investment opportunities, the head of the Cost Analysis Department has tasked you with finding the profit maximizing quantity and price if production continues at existing facilities. You will then present this to the head of the department in a meeting, along with supporting documentation such as cost curves, data tables, and equations. Instructions As a Cost Analyst at your firm, you are being asked to evaluate the profit maximizing quantity and price for your product to submit to
- 2. your manager. Assume that your firm is a monopoly supplier of oil in your region, due to extensive trade restrictions. Another team member in the Cost Analysis Department has compiled the necessary data in the linked spreadsheet. You will have to complete the missing columns for ATC, AVC, and MC. If the company is incurring a profit, include the amount of the profit earned when quantity and price are maximized. If your company is incurring a loss, prove whether it should shut down or continue operating at a loss. Use graphs and equations to support your argument. You will create a short screen recording with narration arguing your case to your manager. Create a PowerPoint presentation to support your https://content.learntoday.info/Competency/ECO3250/Deliverab le%206%20Spreadsheet.xlsx recommendation which can serve as the visuals for your recorded screen capture. There are many free screen recording software/Webware options available (such as Screencast-O-Matic) to use in presenting your PowerPoint. Make sure that both your voiced narration and the PowerPoint slides
- 3. are captured during your screen recording. Be sure to include a cohesive introduction and conclusion of your findings. Your body slides should include any relevant curves created in Excel from the data spreadsheet. After recording, paste a link to the recording on the last slide of the PowerPoint presentation. Attach the PowerPoint presentation as well as the Excel spreadsheet showing how you created the curves and obtained the profit maximizing quantity and price, as well as the corresponding profit or loss. Format your PowerPoint to include a title page, introduction, body slides, conclusion, and references. Remember to cite your sources using correct APA format, and also use correct grammar, spelling, and formatting. Grading Rubric F F C B A 0 1 2 3 4 Not Submitted No Pass Competence Proficiency Mastery
- 4. Not Submitted Introduction and/or conclusion did not summarize the profit-maximizing recommendation. Introduction and conclusion summarized the profit-maximizing recommendation. Introduction and conclusion summarized the profit-maximizing recommendation, using clear supporting evidence. Introduction and conclusion summarized the profit-maximizing recommendation, using clear supporting evidence and a well- defined synopsis of the report goals. Not Submitted
- 5. One or more of average cost, marginal revenue, and average total costs curves are not Average cost, marginal revenue, and average total costs curves are all included, but with minor errors. Average cost, marginal revenue, and average total costs curves are all included, with no errors. Average cost, marginal revenue, and average total costs curves are all included, with no included, or include major errors. errors and justification for inclusion. Not
- 6. Submitted Equilibrium price and quantity included, but one or both are incorrect. Equilibrium price and equilibrium quantity are both correct. Equilibrium price and equilibrium quantity are both correct, and a profit- maximizing equation included. Equilibrium price and equilibrium quantity are both correct, and a profit-maximizing equation is included and clearly explained using corresponding graphs. Not Submitted Profit/loss included, but are incorrect. Profit/loss are correct, but the
- 7. shut-down decision is incorrect. Profit/loss and shut- down decisions are correct and clearly presented. Profit/loss and shut- down decisions are correct, clearly presented, and accurately depicted graphically. Deliverable 6 - Profit Maximizing Quantity and Price Presentation PROPOSAL TO BUILD A PIPELINE 1 PROPOSAL TO BUILD A PIPELINE 2 Hello Angela Below you will find comments for your Deliverable 7 submission. I have included a diagram below showing what was included and correct (YES), what needs editing (Yes – but requires editing) and what was not included (NO) Please let me know if you have any additional questions. Marlo Chavarria
- 8. Proposal to Build A Pipeline Angela Petersen Rasmussen College Author Note This paper is being submitted on February 8, 2019, for Audra Sherwood’s, Managerial Economics course. Proposal to Build a Pipeline: Oil Company X Introduction Every company endeavours to capture a bigger market share. In most cases, companies will resort to expansion through investing on more projects. This is what Oil Company X is doing. On the same note, such an expansion will have an impact on the demand and supply in the market. This paper discusses the company’s extension of its oil pipeline, the effect of economic shocks on its demand and supply, cost analysis regarding to its new investment, its alternative investment as well as their expected returns. Discussion Building a new oil pipeline by Oil Company X is a good strategy for meeting the high oil demand in the market. This is because with such an extension, the company will be in a
- 9. positon to increase the supply of oil to areas which it could not reached earlier. In a situation of economic shocks, the demand and supply of oil as a source of energy will be adversely affected. The company will too be affected as the supplier of oil. For example in the case of natural disasters, the supply of oil and even other alternative sources of energy is generally impeded. Suppliers including Oil Company X will be cut short by such natural disasters from reaching the market. With shortage of supply, therefore, the demand will increase which will consequently lead to increase in prices of oil and other sources of energy. Generally, natural disasters will negatively impact on the profitability of the company since its supplies are disturbed. This applies to the case of recession as well. This is because during recession the general economy is performing poorly. The demand is low. For the case of substitute products, the demand for oil from Oil Company X will fall. This is because consumers will opt for alternative sources of energy which can be trading relatively cheaper compared to oil in the market. The extensive trade restrictions that the government will put in place upon the completion of the extension will give the firm an added advantage over its competitors in the market. In fact the restrictions will give monopoly powers to the company since the restrictions will have prevented other firms from trading in the market. Therefore, the company will be in a monopoly market. The firm will have to adopt the following new strategies as a measure towards maximizing its profits in the monopoly market: i. Boxing Day sales- the firm ought to take opportunity of peak seasons for example during Christmas time since this is the time when products are on high demand. ii. Coupons- the firm should use this pricing technique whereby it segments its customers in terms of sensitive ones and the less sensitive. This means it will be able to reap from sales from various kinds of customers (Hunt, 2018). iii. Pricing complements- the firm ensures that their products can be accompanied by certain complements especially to loyal
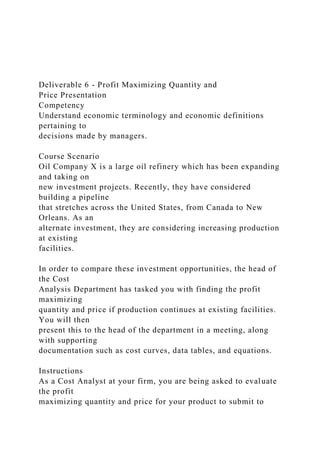
- 10. customers. For example rewarding customers who spend more on their oil products to a specified limit. This will attract new customers and motivate existing customers to spend more. iv. Unadvertised prices- the company can provide discount only when they ask for. This pricing technique will boost the morale of a customer to engage more with the firm (Spulber, 1991; Yu, 2013). Figure 1: Figure 2: From Figure 2, the new expected profit-maximizing quantity and price is obtained where marginal cost is equal to marginal cost, MR=MC. The profit-maximizing price and quantity, therefore, is $32.12 million. The corresponding average variable cost (AVC) is $30.31 million. The expected total profit is given by; ($32.12-$30.31) million*15 years= $27.15 million Expected return= 90% ($320-$27.15) = $292.85 million Alternative investment: The expected returns of the alternative investment is given by 80% (1.6)+20%(1.15)= $1.51 billion. Conclusion Based on the expected returns, Oil Company X should invest on the alternative investment since it has higher returns.
- 11. References Hunt, J. (2018). Pricing strategy: Pricing Strategies in Monopolies. Retrieved from: https://smallbusiness.chron.com/pricing-strategies-monopolies- 15298.html R.A. (February26, 2012). Oil: When the supply shocks are demand shocks and the demand shocks are supply shocks Spulber, D.F. (1991). "Monopoly Pricing Strategies," Discussion Papers 936, Northwestern University, Center for Mathematical Studies in Economics and Management Science. Yu, K. (2013). Monopoly Power and Pricing Strategies: Business 5017 Managerial Economics. MR, MC and AVC ($, 'Millions') MR 0 82.7 70.100000000000009 57.499999999999972 44.900000000000006 32.300000000000011 19.700000000000045 7.0999999999999659 -5.5 - 18.099999999999966 -30.700000000000045 MC 0 27.467000000000002 29.921000000000003 30.655000000000001 31.388999999999996 32.123000000000005 32.856999999999999 33.591000000000008 34.324999999999989 35.058999999999969 35.793000000000006 AVC 0 27.467000000000002 28.694000000000003 29.347666666666669 29.858000000000001 30.311 30.735333333333333 31.143285714285717 31.541 31.931888888888881 32.317999999999998
- 12. TR, TC and AVC ($, 'Millions') TR 0 82.7 152.80000000000001 210.3 255.2 287.5 307.2 314.3 308.8 290.7 260 TC 1.72 29.19 59.11 89.76 121.15 153.28 186.13 219.72 254.05 289.11 324.89999999999998 AVC 0 27.467000000000002 28.694000000000003 29.347666666666669 29.858000000000001 30.311 30.735333333333333 31.143285714285717 31.541 31.931888888888881 32.317999999999998 Deliverable 7 - Proposal to Build a Pipeline Competencies • Understand economic terminology and economic definitions pertaining to decisions made by managers. • Explain and demonstrate knowledge of concepts including the supply/demand relationship, price ceilings and floors, and market surpluses and shortages. • Elasticity, consumer choice, utility, productivity, and nature of costs. • Demonstrate how economic theory contributes to strategic
- 13. managerial decision-making. • Understand various market structures and impacts upon firms, consumers, and government policies. • Calculate profits and profit maximization in order to determine the optimal price and output at which firms should produce. Course Scenario Oil Company X is a large oil refinery which has been expanding and taking on new investment projects. Recently, they have considered building a pipeline that stretches across the United States, from Canada to New Orleans. As a cost analyst at Oil Company X, submit a proposal to the board of the company critiquing the costs and benefits of building a new oil pipeline that stands to generate copious amounts of revenue. Include in your report the following: expected changes to supply and demand, a cost analysis of the project, the cross-price elasticity of an alternative energy source, cost curves, the new expected profit-maximizing quantity and price of oil after completion, a risk assessment evaluating liabilities from potential environmental damage, and a final recommendation. Instructions
- 14. Use the Excel document attached below to complete the assignment, and submit it to the Drop Box when finished. Student Excel Spreadsheet As an economic analyst at your firm, you are being asked to evaluate this investment opportunity and submit a 5-page proposal as a Word document. https://content.learntoday.info/Competency/ECO3250/Deliverab le%207%20Spreadsheet.xlsx You must include an explanation of expected changes to supply and/or demand from economic shocks such as natural disasters and recessions, as well as the anticipated effect of substitute goods (alternative energy sources) flooding the oil market. Be sure to include the expected impact on equilibrium quantity and price in your regional market from these potential changes. Another team member in the Cost Analysis Department has compiled the necessary data in the attached spreadsheet below.The total upfront cost of this project is $1.72 million in fixed costs. Be sure to include in your proposal any relevant curves graphed from the data in the spreadsheet. Your Excel spreadsheet needs to include the following columns in addition to what has been given to you:
- 15. 1. TFC 2. TVC 3. ATC 4. AVC 5. MC Assume that your firm will hold market power as a supplier of oil in your region, due to extensive trade restrictions the government has agreed to put in place after completion of the pipeline. Define the new market structure, and give new pricing strategies the firm can use to maximize profits for this particular market structure. You will also include graphs to show new expected profit- maximizing quantity and price of oil after completion. After determining the profit- maximizing price and quantity, as well as the corresponding average variable cost, determine the expected total profit for the 15-year duration the pipeline will be in operation. Be sure to also include a calculation of the cross-price elasticity of the alternative energy source and oil. Assume the current price of oil is $50/gallon of crude oil. If the price increases to the profit-maximizing price, the quantity demanded of the alternative energy source increases by 20%. Explain if these goods are complementary goods, substitute goods, or non-
- 16. related goods. If there is a relationship, indicate whether the relationship is weak or strong. Justify your answer with an explanation based on the elasticity figure. Assume there is a 10% probability of the pipeline leaking, with an expected liability of $3.2 billion which will be deducted from total profit. There is a 90% probability the pipeline will not leak. Determine the expected return on this investment, as well as the variance. The firm also has an alternative investment which will yield $1.6 billion over the course of the same 15-year period, with a probability of 80%, or $1.15 billion with a probability of 20%. Calculate the expected return, as well as the variance. The risk should be expressed as the standard deviation. Perform a marginal analysis to determine if the firm should build the pipeline, considering currently available investments and opportunity costs. Format your proposal to include a title page, introduction, conclusion, and references. Include all relevant graphs, equations, and calculations. Show your work on calculations to ensure you receive partial credit
- 17. for incorrect answers. No credit will be given if your work is not shown. Remember to cite your sources using correct APA format, and also use correct grammar, spelling, and formatting. Grading Rubric F F C B A 0 1 2 3 4 Not Submitted No Pass Competence Proficiency Mastery Not Submitted Proposal recommendation is included, but does not apply the concept of opportunity cost. Proposal recommendation is included, and applies the concept of opportunity cost. Proposal recommendation is included and applies
- 18. the concept of opportunity cost, using clear examples. Proposal recommendation is included, applies the concept of opportunity cost, using clear examples and well- defined reasons for proposal recommendation. Not Submitted Explanation did not summarize the changes in supply and/or demand curves, or anticipated curve shifts were incorrect. Explanation summarized the anticipated changes in supply and/or demand curves correctly, but did not adequately explain changes in equilibrium price
- 19. and quantity. Explanation summarized the anticipated changes in supply and/or demand curves correctly, adequately explained changes in equilibrium price and quantity, and used clear examples of each. Explanation summarized the anticipated changes in supply and/or demand curves correctly, adequately explained changes in equilibrium price and quantity, used clear examples of each, and included well- defined reasons for proposal recommendation. Not Submitted Calculation of some
- 20. costs included, or contained major errors. Calculation of all costs included, and contained minor errors, or no relevant curves are graphed. Calculation of all costs are correct but had minor errors with graphing. Calculation of all costs are correct, and all relevant curves are graphed correctly. Not Submitted Calculation of cross-price elasticity is included, but is unclear or incorrect. Calculation of cross- price elasticity is correct. Calculation of cross-
- 21. price elasticity is correct, and a relationship is correctly identified. Calculation of cross- price elasticity is correct, a relationship is correctly identified, and explanation of strength of the relationship is well- justified. Not Submitted Calculations of expected value and variance for both investments are incorrect with major errors. Calculations of expected value and variance for both investments contain minor errors, but the overall risk is not quantified. Calculations of expected value and variance for both investments are
- 22. correct, but the overall risk is incorrectly quantified or interpreted. Calculations of expected value and variance for both investments are correct, and risk is correctly quantified and interpreted. Not Submitted Explanation of anticipated market is incorrect, or recommendations for new pricing strategy are not included. Explanation of anticipated market is correct, and recommendations for new pricing strategy are included. Explanation of anticipated market is correct, and recommendations for
- 23. new pricing strategy are included, using clear examples. Explanation of anticipated market is correct, and recommendations for new pricing strategy included, using clear examples and well- defined reasons for proposal recommendation. Not Submitted Profit/loss and profit-maximizing price and quantity are included, but with major errors. Profit/loss and profit- maximizing price and quantity are included, but with minor errors. Profit/loss and profit- maximizing price and quantity are correct and clearly presented.
- 24. Profit/loss and profit- maximizing price and quantity are correct, clearly presented, and accurately depicted graphically. Deliverable 7 - Proposal to Build a Pipeline Sheet1PRICE QUANTITY (in millions)TOTAL REVENUEMARGINAL REVENUETOTAL COST (in millions)TOTAL FIXED COST (in millions)TOTAL VARIABLE COST (in million)AVERAGE TOTAL COSTAVERAGE VARIABLE COSTMARGINAL COST890$0.00$0.00$1.7282.71$82.70$82.70$29.1976.42$152.8 0$70.10$59.1170.13$210.30$57.50$89.7663.84$255.20$44.90$1 21.1557.55$287.50$32.30$153.2851.26$307.20$19.70$186.1344 .97$314.30$7.10$219.7238.68$308.80- $5.50$254.0532.39$290.70-$18.10$289.112610$260.00- $30.70$324.90