More Related Content
Similar to MDG 2 & 3 School Enrollment, Literacy & Gender Equality
Similar to MDG 2 & 3 School Enrollment, Literacy & Gender Equality (20)
More from Bread for the World
More from Bread for the World (20)
MDG 2 & 3 School Enrollment, Literacy & Gender Equality
- 1. Table 4
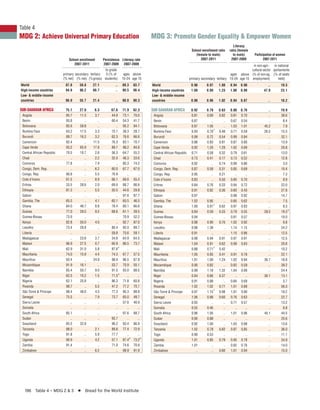
MDG 2: Achieve Universal Primary Education MDG 3: Promote Gender Equality & Empower Women
196 Table 4 – MDG 2 & 3 I Bread for the World Institute
School enrollment
2007-2011
Persistence
2007-2009
Literacy rate
2007-2009
primary
(% net)
secondary
(% net)
tertiary
(%gross)
to grade
5 (% of
students)
ages
15-24
above
age 15
World 87.8 59.8 27.1 .. 89.3 83.7
High-income countries 94.9 90.2 69.7 .. 99.5 98.4
Low- & middle-income
countries 86.9 55.7 21.4 .. 88.0 80.3
SUB-SAHARAN AFRICA 75.1 27.0 6.3 67.6 71.9 62.3
Angola 85.7 11.5 3.7 44.8 73.1 70.0
Benin 93.8 .. .. 60.4 54.3 41.7
Botswana 85.6 58.8 .. .. 95.2 84.1
Burkina Faso 63.2 17.5 3.3 75.1 39.3 28.7
Burundi 89.7 16.2 3.2 62.3 76.6 66.6
Cameroon 92.4 .. 11.5 76.3 83.1 70.7
Cape Verde 93.2 65.9 17.8 89.7 98.2 84.8
Central African Republic 70.5 10.7 2.6 56.3 64.7 55.2
Chad .. .. 2.2 32.0 46.3 33.6
Comoros 77.8 .. 7.9 .. 85.3 74.2
Congo, Dem. Rep. .. .. 6.2 60.0 67.7 67.0
Congo, Rep. 90.8 .. 5.5 76.9 .. ..
Cote d’Ivoire 61.5 .. 8.9 66.1 66.6 55.3
Eritrea 33.5 28.6 2.0 69.0 88.7 66.6
Ethiopia 81.3 .. 5.5 50.5 44.6 29.8
Gabon .. .. .. .. 97.6 87.7
Gambia, The 65.5 .. 4.1 65.1 65.5 46.5
Ghana 84.0 48.7 8.8 78.4 80.1 66.6
Guinea 77.0 29.5 9.5 68.6 61.1 39.5
Guinea-Bissau 73.9 .. .. .. 70.9 52.2
Kenya 82.8 50.0 4.0 .. 92.7 87.0
Lesotho 73.4 29.8 .. 80.4 92.0 89.7
Liberia .. .. .. 59.8 75.6 59.1
Madagascar .. 23.6 3.7 34.6 64.9 64.5
Malawi 96.9 27.5 0.7 60.9 86.5 73.7
Mali 62.9 31.0 5.8 87.6 .. ..
Mauritania 74.0 15.9 4.4 74.3 67.7 57.5
Mauritius 93.4 .. 24.9 98.0 96.5 87.9
Mozambique 91.9 16.1 .. 53.7 70.9 55.1
Namibia 85.4 50.7 9.0 91.5 93.0 88.5
Niger 62.5 10.2 1.5 71.5 .. ..
Nigeria 62.1 25.8 .. 86.3 71.8 60.8
Rwanda 98.7 .. 5.5 47.2 77.2 70.7
São Tomé & Principe 98.4 48.0 4.5 77.3 95.3 88.8
Senegal 75.5 .. 7.9 73.7 65.0 49.7
Sierra Leone .. .. .. .. 57.6 40.9
Somalia .. .. .. .. .. ..
South Africa 85.1 .. .. .. 97.6 88.7
Sudan .. .. .. 93.7 .. ..
Swaziland 85.5 32.8 .. 96.2 93.4 86.9
Tanzania 98.0 .. 2.1 89.8 77.4 72.9
Togo 91.8 .. 5.9 77.7 .. ..
Uganda 90.9 .. 4.2 57.1 87.4 73.2
Zambia 91.4 .. .. 71.0 74.6 70.9
Zimbabwe .. .. 6.2 .. 98.9 91.9
School enrollment ratio
(female to male)
2007-2011
Literacy
ratio (female
to male)
2007-2009
Participation of women
2007-2011
primary secondary tertiary
ages
15-24
above
age 15
in non-agri-
cultural sector
(% of non-ag.
employment)
in national
parliaments
(% of seats
held)
World 0.96 0.97 1.08 0.94 0.90 .. 19.5
High-income countries 1.00 0.99 1.23 1.00 0.99 47.0 23.1
Low- & middle-income
countries 0.96 0.96 1.02 0.94 0.87 .. 18.2
SUB-SAHARAN AFRICA 0.92 0.79 0.63 0.88 0.76 .. 19.9
Angola 0.81 0.69 0.82 0.81 0.70 .. 38.6
Benin 0.87 .. .. 0.67 0.54 .. 8.4
Botswana 0.97 1.05 .. 1.03 1.01 45.2 7.9
Burkina Faso 0.93 0.78 0.48 0.71 0.59 26.5 15.3
Burundi 0.99 0.72 0.54 0.99 0.84 .. 32.1
Cameroon 0.86 0.83 0.81 0.87 0.80 .. 13.9
Cape Verde 0.92 1.20 1.29 1.02 0.89 .. 20.8
Central African Republic 0.71 0.58 0.32 0.79 0.61 .. 13.0
Chad 0.73 0.41 0.17 0.73 0.52 .. 12.8
Comoros 0.92 .. 0.74 0.99 0.86 .. 3.0
Congo, Dem. Rep. 0.87 0.58 0.31 0.85 0.69 .. 10.4
Congo, Rep. 0.95 .. 0.21 .. .. .. 7.3
Cote d’Ivoire 0.83 .. 0.50 0.85 0.70 .. 8.9
Eritrea 0.84 0.76 0.33 0.94 0.72 .. 22.0
Ethiopia 0.91 0.82 0.36 0.60 0.43 .. 27.8
Gabon 0.97 .. .. 0.98 0.92 .. 14.7
Gambia, The 1.02 0.95 .. 0.85 0.62 .. 7.5
Ghana 1.00 0.91 0.62 0.97 0.83 .. 8.3
Guinea 0.84 0.59 0.33 0.79 0.55 28.5 19.3
Guinea-Bissau 0.94 .. .. 0.81 0.57 .. 10.0
Kenya 0.98 0.90 0.70 1.02 0.92 .. 9.8
Lesotho 0.98 1.38 .. 1.14 1.15 .. 24.2
Liberia 0.91 .. .. 1.15 0.86 .. 12.5
Madagascar 0.98 0.94 0.91 0.97 0.91 .. 12.5
Malawi 1.04 0.91 0.62 0.99 0.83 .. 20.8
Mali 0.88 0.71 0.42 .. .. .. 10.2
Mauritania 1.05 0.85 0.41 0.91 0.78 .. 22.1
Mauritius 1.01 1.00 1.24 1.02 0.94 36.7 18.8
Mozambique 0.90 0.82 .. 0.82 0.59 .. 39.2
Namibia 0.99 1.18 1.32 1.04 0.99 .. 24.4
Niger 0.84 0.66 0.37 .. .. 36.1 13.1
Nigeria 0.91 0.88 .. 0.84 0.69 .. 3.7
Rwanda 1.02 1.02 0.77 1.01 0.89 .. 56.3
São Tomé & Principe 0.97 1.15 0.98 1.01 0.90 .. 18.2
Senegal 1.06 0.88 0.60 0.76 0.63 .. 22.7
Sierra Leone 0.93 .. .. 0.71 0.57 .. 13.2
Somalia 0.55 0.46 .. .. .. .. 6.8
South Africa 0.96 1.05 .. 1.01 0.96 45.1 44.5
Sudan 0.90 0.88 .. .. .. .. 25.6
Swaziland 0.92 1.00 .. 1.03 0.98 .. 13.6
Tanzania 1.02 0.78 0.82 0.97 0.85 .. 36.0
Togo 0.90 0.53 .. .. .. .. 11.1
Uganda 1.01 0.85 0.79 0.95 0.78 .. 34.9
Zambia 1.01 .. .. 0.82 0.76 .. 14.0
Zimbabwe .. .. 0.80 1.01 0.94 .. 15.0
e
e
ee
c
f
f
f
f
- 2. Table 4
MDG 2: Achieve Universal Primary Education MDG 3: Promote Gender Equality & Empower Women
www.bread.org/institute I 2013 Hunger Report 197
School enrollment
2007-2011
Persistence
2007-2009
Literacy rate
2007-2009
primary
(% net)
secondary
(% net)
tertiary
(%gross)
to grade
5 (% of
students)
ages
15-24
above
age 15
MIDDLE EAST & NORTH AFRICA 90.4 63.9 27.4 .. 90.1 74.4
Algeria 95.6 .. 30.8 95.0 .. ..
Djibouti 44.5 24.2 4.9 64.3 .. ..
Egypt, Arab Rep. 95.8 .. 30.4 .. .. ..
Iran, Islamic Rep. 99.5 .. 42.8 94.3 98.7 85.0
Iraq 89.2 44.3 .. .. 82.7 78.1
Jordan 89.7 84.2 41.8 .. 98.9 92.2
Lebanon 91.7 74.7 54.0 90.3 98.7 89.6
Libya .. .. .. .. 99.9 88.9
Morocco 95.7 .. 13.2 93.9 79.5 56.1
Syrian Arab Republic 93.5 67.0 .. .. 94.4 84.2
Tunisia 98.5 .. 34.4 96.1 96.8 77.6
West Bank & Gaza 86.5 83.5 50.2 .. 99.2 94.6
Yemen, Rep. 77.6 .. 10.2 .. 84.1 62.4
South Asia 86.4 .. 11.4 .. 78.7 61.1
Afghanistan .. 24.1 3.3 .. .. ..
Bangladesh 92.2 45.7 10.6 66.2 75.5 55.9
Bhutan 88.3 53.8 8.8 95.5 .. ..
India 92.1 .. 16.2 .. .. ..
Maldives 96.2 .. .. .. .. ..
Nepal .. .. .. 61.7 82.0 59.1
Pakistan 74.1 33.8 5.4 61.5 71.1 55.5
Sri Lanka 94.0 .. 15.5 .. 98.0 90.6
EAST ASIA & PACIFIC 93.3 66.8 24.7 .. 98.7 93.5
Cambodia 95.9 35.1 7.8 62.1 87.5 77.6
China .. .. 25.9 .. 99.4 94.0
Fiji 96.7 83.5 .. 94.3 .. ..
Indonesia 96.0 67.3 23.1 86.1 99.5 92.2
Kiribati .. .. .. .. .. ..
Korea, Rep. .. .. .. .. 100.0 100.0
Lao PDR 89.0 37.0 13.4 67.0 .. ..
Malaysia .. 67.9 40.2 98.2 98.5 92.5
Mongolia 95.3 82.9 53.3 94.1 96.0 97.5
Myanmar .. 50.8 11.0 74.8 95.7 92.0
Papua New Guinea .. .. .. .. 67.5 60.1
Philippines 89.0 61.0 28.9 78.7 97.8 95.4
Samoa 96.5 77.8 .. 96.4 99.5 98.8
Solomon Islands 82.0 30.9 .. .. .. ..
Thailand 89.7 74.1 47.7 .. .. ..
Timor-Leste 85.3 36.5 16.7 70.5 .. 50.6
Tuvalu .. .. .. .. .. ..
Vanuatu .. 47.4 .. 76.1 94.0 82.0
Vietnam 98.0 .. 22.3 .. 96.9 92.8
EUROPE & CENTRAL ASIA 91.7 81.3 55.1 .. 99.2 97.9
Albania 79.9 .. .. 95.2 98.8 95.9
Armenia 87.1 86.3 51.5 .. 99.8 99.5
Azerbaijan 84.4 .. 19.3 .. 100.0 99.5
Belarus 91.7 86.5 83.0 .. 99.8 99.7
School enrollment ratio
(female to male)
2007-2011
Literacy
ratio (female
to male)
2007-2009
Participation of women
2007-2011
primary secondary tertiary
ages
15-24
above
age 15
in non-agri-
cultural sector
(% of non-ag.
employment)
in national
parliaments
(% of seats
held)
MIDDLE EAST & NORTH AFRICA 0.93 0.93 0.97 0.94 0.80 .. 9.3
Algeria 0.94 1.02 1.46 .. .. 15.0 7.7
Djibouti 0.90 0.80 0.67 .. .. .. 13.8
Egypt, Arab Rep. 0.96 .. .. .. .. 18.1 1.8
Iran, Islamic Rep. 0.99 0.94 1.01 1.00 0.90 .. 2.8
Iraq 0.84 0.75 .. 0.95 0.81 12.1 25.2
Jordan 1.01 1.04 1.12 1.00 0.93 15.7 10.8
Lebanon 0.97 1.12 1.19 1.01 0.92 .. 3.1
Libya .. .. .. 1.00 0.86 .. 7.7
Morocco 0.94 0.86 0.87 0.83 0.64 20.8 10.5
Syrian Arab Republic 0.98 1.00 .. 0.97 0.86 15.3 12.4
Tunisia 0.96 1.06 1.51 0.98 0.82 .. 27.6
West Bank & Gaza 0.98 1.08 1.34 1.00 0.94 17.9 ..
Yemen, Rep. 0.82 0.62 0.42 0.75 0.56 6.2 0.3
South Asia 0.95 0.88 0.69 0.85 0.68 .. 20.1
Afghanistan 0.69 0.51 0.24 .. .. 18.4 27.7
Bangladesh 1.06 1.09 0.61 1.04 0.84 .. 18.6
Bhutan 1.01 1.04 0.68 .. .. 26.8 8.5
India 0.97 0.88 0.68 .. .. .. 10.8
Maldives 0.96 .. .. .. .. .. 6.5
Nepal .. .. .. 0.88 0.65 .. 33.2
Pakistan 0.82 0.76 0.83 0.77 0.58 12.6 22.2
Sri Lanka 1.00 .. 1.92 1.01 0.97 31.0 5.8
EAST ASIA & PACIFIC 1.01 1.05 1.08 1.00 0.94 .. 17.7
Cambodia 0.95 0.90 0.53 0.96 0.83 .. 21.1
China 1.03 1.04 1.10 1.00 0.94 .. 21.3
Fiji 0.98 1.09 .. .. .. .. ..
Indonesia 1.02 1.00 0.89 1.00 0.93 32.4 18.0
Kiribati 1.04 1.11 .. .. .. .. 4.3
Korea, Rep. .. .. .. 1.00 1.00 .. 14.7
Lao PDR 0.90 0.81 0.78 .. .. 25.0
Malaysia .. 1.07 1.29 1.00 0.95 39.2 9.9
Mongolia 0.98 1.08 1.53 1.03 1.01 51.1 3.9
Myanmar 1.00 1.06 1.38 0.99 0.94 .. 4.3
Papua New Guinea 0.89 .. .. 1.09 0.89 .. 0.9
Philippines 0.98 1.08 1.25 1.02 1.01 41.9 22.1
Samoa 1.02 1.14 .. 1.00 1.00 .. 4.1
Solomon Islands 0.97 0.84 .. .. .. .. ..
Thailand 0.99 1.08 1.31 .. .. 45.5 13.3
Timor-Leste 0.96 1.01 0.70 .. 0.73 .. 29.2
Tuvalu .. .. .. .. .. .. ..
Vanuatu 0.95 1.02 .. 1.00 0.96 38.9 3.8
Vietnam 0.94 1.09 1.00 0.99 0.95 .. 24.4
EUROPE & CENTRAL ASIA 0.99 0.96 1.22 1.00 0.98 48.3 16.0
Albania 0.99 0.98 .. 1.01 0.97 .. 16.4
Armenia 1.02 1.02 1.28 1.00 1.00 40.4 9.2
Azerbaijan 0.99 .. 0.99 1.00 0.99 42.9 16.0
Belarus 1.00 1.02 1.43 1.00 1.00 55.8 31.8
e
f f
f f
f f
- 3. Table 4
MDG 2: Achieve Universal Primary Education MDG 3: Promote Gender Equality & Empower Women
198 Table 4 – MDG 2 & 3 I Bread for the World Institute
School enrollment
2007-2011
Persistence
2007-2009
Literacy rate
2007-2009
primary
(% net)
secondary
(% net)
tertiary
(%gross)
to grade
5 (% of
students)
ages
15-24
above
age 15
CONTINUED: EUROPE & CENTRAL ASIA
Bosnia & Herzegovina 85.2 .. 35.9 73.2 99.7 97.8
Bulgaria 97.7 82.8 53.0 .. 97.5 98.3
Georgia 99.6 79.4 28.2 96.4 99.8 99.7
Kazakhstan 88.2 89.6 40.8 .. 99.8 99.7
Kosovo .. .. .. .. .. ..
Kyrgyz Republic 87.5 78.9 48.8 .. 99.8 99.2
Latvia 95.1 83.7 60.1 95.7 99.7 99.8
Lithuania 93.3 91.0 77.4 .. 99.8 99.7
Macedonia, FYR 86.9 .. 40.4 .. 98.7 97.1
Moldova 87.6 78.6 38.1 .. 99.5 98.5
Montenegro 83.2 .. 47.6 .. .. ..
Romania 87.2 82.3 63.8 .. 97.4 97.7
Russian Federation 93.4 .. 75.9 .. 99.7 99.6
Serbia 92.7 90.2 49.1 .. .. ..
Tajikistan 97.3 85.0 19.7 .. 99.9 99.7
Turkey 97.5 74.1 45.8 91.8 97.8 90.8
Turkmenistan .. .. .. .. 99.8 99.6
Ukraine 90.7 86.0 79.5 .. 99.8 99.7
Uzbekistan 89.8 92.0 8.9 .. 99.9 99.3
LATIN AMERICA
& CARIBBEAN 94.0 73.0 37.0 .. 97.0 91.1
Argentina .. 82.2 71.2 95.4 99.2 97.7
Belize 94.7 63.2 21.5 91.1 .. ..
Bolivia 94.2 68.1 38.6 85.1 99.1 90.7
Brazil 94.1 82.0 36.1 .. 97.8 90.0
Chile 93.6 82.6 59.2 .. 99.2 98.6
Colombia 88.1 74.4 39.1 84.5 97.9 93.2
Costa Rica .. .. .. 91.2 98.2 96.1
Cuba 99.2 85.5 95.2 96.6 100.0 99.8
Dominican Republic 90.2 62.3 .. .. 95.8 88.2
Ecuador 97.0 58.7 39.8 .. 96.8 84.2
El Salvador 93.7 57.6 23.4 89.4 95.0 84.1
Guatemala 96.9 50.1 17.8 70.6 86.5 74.5
Guyana 80.6 .. 11.9 86.7 .. ..
Haiti .. .. .. .. .. ..
Honduras 96.1 .. 18.8 77.8 93.9 83.6
Jamaica 82.0 83.6 29.0 96.1 95.2 86.4
Mexico 98.0 70.5 27.0 96.0 98.5 93.4
Nicaragua 92.5 45.8 .. 51.4 .. ..
Panama 98.0 68.7 44.6 94.6 96.4 93.6
Paraguay 85.1 60.0 36.6 82.3 98.8 94.6
Peru 94.5 78.4 .. .. 97.4 89.6
Suriname 90.9 50.5 .. 94.1 99.4 94.6
Uruguay 99.1 69.6 63.3 95.4 99.0 98.3
Venezuela, RB 92.5 71.8 78.1 93.8 98.4 95.2
School enrollment ratio
(female to male)
2007-2011
Literacy
ratio (female
to male)
2007-2009
Participation of women
2007-2011
primary secondary tertiary
ages
15-24
above
age 15
in non-agri-
cultural sector
(% of non-ag.
employment)
in national
parliaments
(% of seats
held)
CONTINUED: EUROPE & CENTRAL ASIA
Bosnia & Herzegovina 1.02 1.03 1.30 1.00 0.97 35.7 16.7
Bulgaria 1.00 0.96 1.31 1.00 0.99 51.1 20.8
Georgia 1.03 0.95 1.25 1.00 1.00 47.6 6.5
Kazakhstan 1.00 0.97 1.44 1.00 1.00 50.0 17.8
Kosovo .. .. .. .. .. .. ..
Kyrgyz Republic 0.99 0.99 1.30 1.00 0.99 50.6 23.3
Latvia 0.99 0.98 1.75 1.00 1.00 55.3 20.0
Lithuania 0.98 1.00 1.51 1.00 1.00 53.0 19.1
Macedonia, FYR 1.01 0.98 1.19 1.00 0.97 42.2 30.9
Moldova 1.00 1.02 1.34 1.00 0.99 54.3 18.8
Montenegro 0.98 1.01 1.24 .. .. 46.3 11.1
Romania 0.99 0.99 1.34 1.00 0.99 46.3 11.4
Russian Federation 1.00 0.98 1.35 1.00 1.00 52.8 14.0
Serbia 0.99 1.02 1.30 .. .. 43.7 21.6
Tajikistan 0.96 0.87 0.41 1.00 1.00 .. 19.0
Turkey 0.98 0.91 0.79 0.98 0.89 23.5 14.2
Turkmenistan .. .. .. 1.00 1.00 .. 16.8
Ukraine 1.01 0.98 1.25 1.00 1.00 54.6 8.0
Uzbekistan 0.97 0.98 0.65 1.00 0.99 39.4 22.0
LATIN AMERICA
& CARIBBEAN 0.97 1.08 1.26 1.00 0.98 41.2 22.9
Argentina 0.99 1.12 1.51 1.00 1.00 .. 38.5
Belize 0.91 .. 1.57 .. .. 37.7 6.7
Bolivia 0.99 0.99 0.84 0.99 0.91 38.1 25.4
Brazil 0.93 1.11 1.35 1.01 1.00 41.6 8.6
Chile 0.95 1.03 1.06 1.00 1.00 36.9 14.2
Colombia 0.98 1.10 1.09 1.01 1.00 47.5 12.7
Costa Rica 0.99 1.06 .. 1.01 1.00 41.3 38.6
Cuba 0.98 0.99 1.65 1.00 1.00 43.4 43.2
Dominican Republic 0.88 1.12 .. 1.02 1.00 38.8 20.8
Ecuador 1.01 1.05 1.15 1.00 0.93 .. 32.3
El Salvador 0.95 1.01 1.16 1.01 0.94 48.0 19.0
Guatemala 0.96 0.93 1.00 0.95 0.87 .. 12.0
Guyana 1.04 1.11 2.52 .. .. .. 30.0
Haiti .. .. .. .. .. .. 11.1
Honduras 1.00 1.23 1.51 1.03 1.00 41.9 18.0
Jamaica 0.95 1.03 2.28 1.07 1.12 48.2 13.3
Mexico 0.99 1.08 0.98 1.00 0.97 39.4 26.2
Nicaragua 0.98 1.10 .. .. .. 38.1 20.7
Panama 0.97 1.07 1.53 1.00 0.99 42.1 8.5
Paraguay 0.97 1.05 1.43 1.00 0.98 39.5 12.5
Peru 1.00 0.98 .. 0.99 0.89 37.5 21.5
Suriname 0.95 1.23 .. 1.00 0.98 .. 9.8
Uruguay 0.97 1.13 1.74 1.01 1.01 45.5 15.2
Venezuela, RB 0.97 1.10 1.69 1.01 1.00 41.6 17.0
b
f f
f f
.. Data not availble.
0 Zero, or rounds to zero at the displayed number of decimal places.
a Data refers to 2006
b Data refers to 2007
c Data refers to 2008
d Data refers to 2009
e Data refers to 2010
f Data refers to 2011
Note: South Sudan is not included due to insufficient information.
Sources for tables on page 215.