More Related Content
Similar to Table 11, us hunger & poverty trends
Similar to Table 11, us hunger & poverty trends (20)
More from Bread for the World
More from Bread for the World (20)
Table 11, us hunger & poverty trends
- 1. Table 11
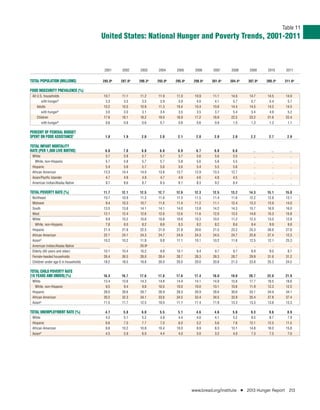
United States: National Hunger and Poverty Trends, 2001-2011
2001 2002 2003 2004 2005 2006 2007 2008 2009 2010 2011
TOTAL POPULATION (MILLIONS) 285.0a 287.8a 290.3a 293.0a 295.8a 298.6a 301.6a 304.4a 307.0a 309.3a 311.6a
FOOD INSECURITY PREVALENCE (%)
All U.S. households 10.7 11.1 11.2 11.9 11.0 10.9 11.1 14.6 14.7 14.5 14.9
with hungerb 3.3 3.5 3.5 3.9 3.9 4.0 4.1 5.7 5.7 5.4 5.7
Adults 10.2 10.5 10.8 11.3 10.4 10.4 10.6 14.4 14.5 14.2 14.5
with hungerb 3.0 3.0 3.1 3.4 3.5 3.5 3.7 5.4 5.4 4.9 5.2
Children 17.6 18.1 18.2 19.0 16.9 17.2 16.9 22.5 23.2 21.6 22.4
with hungerb 0.6 0.8 0.6 0.7 0.8 0.6 0.9 1.5 1.3 1.3 1.1
PERCENT OF FEDERAL BUDGET
SPENT ON FOOD ASSISTANCEc 1.8 1.9 2.0 2.0 2.1 2.0 2.0 2.0 2.2 2.7 2.9
TOTAL INFANT MORTALITY
RATE (PER 1,000 LIVE BIRTHS) 6.8 7.0 6.8 6.8 6.9 6.7 6.8 6.6 .. .. ..
White 5.7 5.8 5.7 5.7 5.7 5.6 5.6 5.5 .. .. ..
White, non-Hispanic 5.7 5.8 5.7 5.7 5.8 5.6 5.6 5.5 .. .. ..
Hispanic 5.4 5.6 5.7 5.6 5.6 5.4 5.5 5.6 .. .. ..
African American 13.3 14.4 14.0 13.8 13.7 12.9 13.3 12.7 .. .. ..
Asian/Pacific Islander 4.7 4.8 4.8 4.7 4.9 4.6 4.8 4.5 .. .. ..
American Indian/Alaska Native 9.7 8.6 8.7 8.5 8.1 8.3 9.2 8.4 .. .. ..
TOTAL POVERTY RATE (%) 11.7 12.1 12.5 12.7 12.6 12.3 12.5 13.2 14.3 15.1 15.0
Northeast 10.7 10.9 11.3 11.6 11.3 11.5 11.4 11.6 12.2 12.8 13.1
Midwest 9.4 10.3 10.7 11.6 11.4 11.2 11.1 12.4 13.3 13.9 14.0
South 13.5 13.8 14.1 14.1 14.0 13.8 14.2 14.3 15.7 16.9 16.0
West 12.1 12.4 12.6 12.6 12.6 11.6 12.0 13.5 14.8 15.3 15.8
White 9.9 10.2 10.6 10.8 10.6 10.3 10.5 11.2 12.3 13.0 12.8
White, non-Hispanic 7.8 8.0 8.2 8.6 8.3 8.2 8.2 8.6 9.4 9.9 9.8
Hispanic 21.4 21.8 22.5 21.9 21.8 20.6 21.5 23.2 25.3 26.6 27.6
African American 22.7 24.1 24.3 24.7 24.9 24.3 24.5 24.7 25.8 27.4 12.3
Asiand 10.2 10.2 11.8 9.8 11.1 10.1 10.2 11.6 12.5 12.1 25.3
American Indian/Alaska Native .. .. 20.0e .. .. .. .. .. .. .. ..
Elderly (65 years and older) 10.1 10.4 10.2 9.8 10.1 9.4 9.7 9.7 8.9 9.0 8.7
Female-headed households 26.4 26.5 28.0 28.4 28.7 28.3 28.3 28.7 29.9 31.6 31.2
Children under age 6 in households 18.2 18.5 19.8 20.0 20.0 20.0 20.8 21.3 23.8 25.3 24.5
TOTAL CHILD POVERTY RATE
(18 YEARS AND UNDER) (%) 16.3 16.7 17.6 17.8 17.6 17.4 18.0 19.0 20.7 22.0 21.9
White 13.4 13.6 14.3 14.8 14.4 14.1 14.9 15.8 17.7 18.5 18.6
White, non-Hispanic 9.5 9.4 9.8 10.5 10.0 10.0 10.1 10.6 11.9 12.3 12.5
Hispanic 28.0 28.6 29.7 28.9 28.3 26.9 28.6 30.6 33.1 34.9 34.1
African American 30.2 32.3 34.1 33.6 34.5 33.4 34.5 33.9 35.4 37.8 37.4
Asiand 11.5 11.7 12.5 10.0 11.1 11.4 11.9 13.3 13.3 13.6 13.3
TOTAL UNEMPLOYMENT RATE (%) 4.7 5.8 6.0 5.5 5.1 4.6 4.6 5.8 9.3 9.6 8.9
White 4.2 5.1 5.2 4.8 4.4 4.0 4.1 5.2 8.5 8.7 7.9
Hispanic 6.6 7.5 7.7 7.0 6.0 5.2 5.6 7.6 12.1 12.5 11.5
African American 8.6 10.2 10.8 10.4 10.0 8.9 8.3 10.1 14.8 16.0 15.8
Asiand 4.5 5.9 6.0 4.4 4.0 3.0 3.2 4.0 7.3 7.5 7.0
www.bread.org/institute I 2013 Hunger Report 213
- 2. Table 11
United States: National Hunger and Poverty Trends, 2001-2011
2001 2002 2003 2004 2005 2006 2007 2008 2009 2010 2011
HOUSEHOLD INCOME DISTRIBUTION (%)
Total population
Lowest 20 percent 3.5 3.5 3.4 3.4 3.4 3.4 3.4 3.4 3.4 3.3 3.2
Second quintile 8.7 8.8 8.7 8.7 8.6 8.6 8.7 8.6 8.6 8.5 8.4
Third quintile 14.6 14.8 14.8 14.7 14.6 14.5 14.8 14.7 14.6 14.6 14.3
Fourth quintile 23.0 23.3 23.4 23.2 23.0 22.9 23.4 23.3 23.2 23.4 23.0
Highest 20 percent 50.1 49.7 49.8 50.1 50.4 50.5 49.7 50.0 50.3 50.2 51.1
Ratio of highest 20 percent to lowest 20 percent 14.3 14.2 14.6 14.7 14.8 14.8 14.6 14.7 14.8 15.2 16.0
White
Lowest 20 percent 3.7 3.7 3.6 3.6 3.6 3.7 3.7 3.6 3.7 3.5 3.5
Second quintile 8.9 9.0 8.9 8.8 8.9 8.9 8.9 8.8 8.9 8.7 8.6
Third quintile 14.7 15.0 14.8 14.8 14.7 14.6 14.9 14.8 14.8 14.7 14.5
Fourth quintile 22.9 23.2 23.2 23.1 22.9 22.9 23.3 23.3 23.2 23.3 22.9
Highest 20 percent 49.8 49.2 49.4 49.6 49.9 49.9 49.2 49.4 49.5 49.7 50.5
Ratio of highest 20 percent to lowest 20 percent 13.5 13.2 21.4 13.8 13.9 13.4 13.3 13.7 13.4 14.2 14.3
Hispanic
Lowest 20 percent 4.0 3.9 3.9 3.8 3.9 3.8 3.9 3.7 3.7 3.5 3.5
Second quintile 9.4 9.4 9.4 9.3 9.5 9.3 9.5 9.2 9.0 9.0 9.1
Third quintile 15.2 14.8 15.0 14.9 15.2 15.0 15.2 14.7 14.7 14.7 14.7
Fourth quintile 23.2 22.9 23.1 22.9 23.3 22.9 23.5 23.2 23.1 23.4 22.9
Highest 20 percent 48.3 49.0 48.6 49.1 48.1 48.9 47.9 49.2 49.5 49.4 49.7
Ratio of highest 20 percent to lowest 20 percent 12.1 12.6 12.5 12.9 12.3 12.8 12.3 13.3 13.4 14.1 14.2
African American
Lowest 20 percent 3.0 2.9 2.9 2.8 2.8 2.8 2.8 3.0 2.9 2.6 2.6
Second quintile 8.6 8.2 8.2 8.3 8.0 8.1 8.1 8.4 8.2 7.8 7.5
Third quintile 15.0 14.5 14.7 14.6 14.5 14.3 14.5 14.6 14.3 14.2 13.7
Fourth quintile 24.2 23.3 24.0 23.8 23.7 23.2 23.7 23.5 23.5 23.6 23.3
Highest 20 percent 49.2 51.1 50.2 50.5 50.9 51.6 50.8 50.6 51.1 51.7 52.9
Ratio of highest 20 percent to lowest 20 percent 16.4 17.6 17.3 18.0 18.2 18.4 18.1 16.9 17.6 19.9 20.3
Asiand
Lowest 20 percent .. 3.3 2.7 3.2 2.9 3.2 3.1 2.9 2.7 3.0 3.0
Second quintile .. 9.1 9.1 9.2 9.2 8.8 9.2 8.6 8.2 8.9 8.7
Third quintile .. 15.2 15.9 15.1 15.3 14.7 15.6 15.1 14.4 15.3 15.1
Fourth quintile .. 23.8 24.6 23.3 23.7 23.0 24.0 24.1 23.0 24.5 23.5
Highest 20 percent .. 48.6 47.8 49.2 48.9 50.3 48.0 49.3 51.6 48.3 49.7
Ratio of highest 20 percent to lowest 20 percent .. 14.7 17.7 15.4 16.9 15.7 15.5 17.0 19.0 16.2 16.6
.. Data not availble.
0 Zero, or rounds to zero at the displayed number of decimal places.
a U.S. Census estimate.
b Data from 2005 onward is referred to by the USDA as “very low food security” instead of “food insecure with hunger.”
c Data refer to fiscal year.
d Reclassified from “Asian and Pacific Islander” in 2002.
e 3-year average: 1998, 1999, and 2000.
Sources for tables on page 215.
214 Table 11 – United States: National Hunger and Poverty Trends, 2001-2011 I Bread for the World Institute