More Related Content
Similar to Tables3 7 wef-globalcompetitivenessreport 2014
Similar to Tables3 7 wef-globalcompetitivenessreport 2014 (20)
More from William Henry Vegazo Muro
More from William Henry Vegazo Muro (20)
Tables3 7 wef-globalcompetitivenessreport 2014
- 1. The Global Competitiveness Report 2014–2015 | 13
1.1: The Global Competitiveness Index 2014–2015
GCI 2014–2015
Country/Economy
Rank
(out of 144)
Score
(1–7)
Rank among
2013–2014
economies*
GCI 2013–
2014 rank
(out of 148)†
Switzerland 1 5.70 1 1
Singapore 2 5.65 2 2
United States 3 5.54 3 5
Finland 4 5.50 4 3
Germany 5 5.49 5 4
Japan 6 5.47 6 9
Hong Kong SAR 7 5.46 7 7
Netherlands 8 5.45 8 8
United Kingdom 9 5.41 9 10
Sweden 10 5.4110 6
Norway 11 5.351111
United Arab Emirates 12 5.331219
Denmark 13 5.291315
Taiwan, China 14 5.251412
Canada 15 5.241514
Qatar 16 5.241613
New Zealand 17 5.201718
Belgium 18 5.181817
Luxembourg 19 5.171922
Malaysia 20 5.162024
Austria 21 5.162116
Australia 22 5.082221
France 23 5.082323
Saudi Arabia 24 5.062420
Ireland 25 4.982528
Korea, Rep. 26 4.962625
Israel 27 4.952727
China 28 4.892829
Estonia 29 4.712932
Iceland 30 4.713031
Thailand 31 4.663137
Puerto Rico 32 4.643230
Chile 33 4.603334
Indonesia 34 4.573438
Spain 35 4.553535
Portugal 36 4.543651
Czech Republic 37 4.533746
Azerbaijan 38 4.533839
Mauritius 39 4.523945
Kuwait 40 4.514036
Lithuania 41 4.514148
Latvia 42 4.504252
Poland 43 4.484342
Bahrain 44 4.484443
Turkey 45 4.464544
Oman 46 4.464633
Malta 47 4.454741
Panama 48 4.434840
Italy 49 4.424949
Kazakhstan 50 4.425050
Costa Rica 51 4.425154
Philippines 52 4.405259
Russian Federation 53 4.375364
Bulgaria 54 4.375457
Barbados 55 4.365547
South Africa 56 4.355653
Brazil 57 4.345756
Cyprus 58 4.315858
Romania 59 4.305976
Hungary 60 4.286063
Mexico 61 4.276155
Rwanda 62 4.276266
Macedonia, FYR 63 4.266373
Jordan 64 4.256468
Peru 65 4.246561
Colombia 66 4.236669
Montenegro 67 4.236767
Vietnam 68 4.236870
Georgia 69 4.226972
Slovenia 70 4.227062
India 71 4.217160
Morocco 72 4.217277
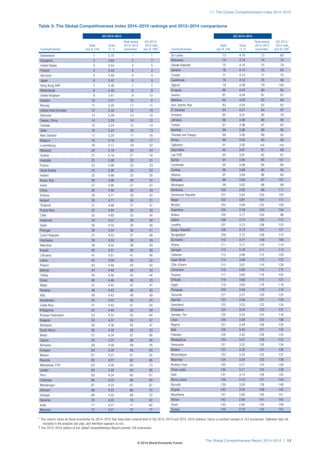
Table 3: The Global Competitiveness Index 2014–2015 rankings and 2013–2014 comparisons
GCI 2014–2015
Country/Economy
Rank
(out of 144)
Score
(1–7)
Rank among
2013–2014
economies*
GCI 2013–
2014 rank
(out of 148)†
Sri Lanka 73 4.197365
Botswana 74 4.157474
Slovak Republic 75 4.157578
Ukraine 76 4.147684
Croatia 77 4.137775
Guatemala 78 4.107886
Algeria 79 4.0879100
Uruguay 80 4.048085
Greece 81 4.048191
Moldova 82 4.038289
Iran, Islamic Rep. 83 4.038382
El Salvador 84 4.018497
Armenia 85 4.018579
Jamaica 86 3.988694
Tunisia 87 3.968783
Namibia 88 3.968890
Trinidad and Tobago 89 3.958992
Kenya 90 3.939096
Tajikistan 91 3.93n/an/a
Seychelles 92 3.919180
Lao PDR 93 3.919281
Serbia 94 3.9093101
Cambodia 95 3.899488
Zambia 96 3.869593
Albania 97 3.849695
Mongolia 98 3.8397107
Nicaragua 99 3.829899
Honduras 100 3.8299111
Dominican Republic 101 3.82100105
Nepal 102 3.81101117
Bhutan 103 3.80102109
Argentina 104 3.79103104
Bolivia 105 3.7710498
Gabon 106 3.74105112
Lesotho 107 3.73106123
Kyrgyz Republic 108 3.73107121
Bangladesh 109 3.72108110
Suriname 110 3.71109106
Ghana 111 3.71110114
Senegal 112 3.70111113
Lebanon 113 3.68112103
Cape Verde 114 3.68113122
Côte d'Ivoire 115 3.67114126
Cameroon 116 3.66115115
Guyana 117 3.65116102
Ethiopia 118 3.60117127
Egypt 119 3.60118118
Paraguay 120 3.59119119
Tanzania 121 3.57120125
Uganda 122 3.56121129
Swaziland 123 3.55122124
Zimbabwe 124 3.54123131
Gambia, The 125 3.53124116
Libya 126 3.48125108
Nigeria 127 3.44126120
Mali 128 3.43127135
Pakistan 129 3.42128133
Madagascar 130 3.41129132
Venezuela 131 3.32130134
Malawi 132 3.25131136
Mozambique 133 3.24132137
Myanmar 134 3.24133139
Burkina Faso 135 3.21134140
Timor-Leste 136 3.17135138
Haiti 137 3.14136143
Sierra Leone 138 3.10137144
Burundi 139 3.09138146
Angola 140 3.04139142
Mauritania 141 3.00140141
Yemen 142 2.96141145
Chad 143 2.85142148
Guinea 144 2.79143147
* This column ranks all those economies for 2014–2015 that have been covered both in the 2013–2014 and 2014–2015 editions, hence a constant sample of 143 economies. Tajikistan was not
included in the analysis last year, and therefore appears as n/a.
† The 2013–2014 edition of the Global Competitiveness Report covered 148 economies.
© 2014 World Economic Forum
- 2. 1.1: The Global Competitiveness Index 2014–2015
14 | The Global Competitiveness Report 2014–2015
SUBINDEX
OVERALL INDEX Basic requirements Efficiency enhancers Innovation and sophistication factors
Country/Economy Rank Score Rank Score Rank Score Rank Score
Switzerland 1 5.70 4 6.17 5 5.49 1 5.74
Singapore 2 5.65 1 6.34 2 5.68 11 5.13
United States 3 5.54 33 5.15 1 5.71 5 5.54
Finland 4 5.50 8 5.97 10 5.27 3 5.57
Germany 5 5.49 11 5.91 9 5.28 4 5.56
Japan 6 5.47 25 5.47 7 5.35 2 5.68
Hong Kong SAR 7 5.46 3 6.19 3 5.58 23 4.75
Netherlands 8 5.45 10 5.95 8 5.28 6 5.41
United Kingdom 9 5.41 24 5.49 4 5.51 8 5.21
Sweden 10 5.41 12 5.86 12 5.25 7 5.38
Norway 11 5.35 6 6.05 13 5.24 16 5.08
United Arab Emirates 12 5.33 2 6.20 14 5.24 21 4.83
Denmark 13 5.29 13 5.85 17 5.11 9 5.19
Taiwan, China 14 5.25 14 5.75 16 5.14 13 5.11
Canada 15 5.24 18 5.70 6 5.37 24 4.72
Qatar 16 5.24 5 6.12 20 4.98 15 5.09
New Zealand 17 5.20 9 5.96 11 5.26 25 4.61
Belgium 18 5.18 22 5.53 18 5.07 12 5.11
Luxembourg 19 5.17 7 6.02 22 4.97 18 4.93
Malaysia 20 5.16 23 5.53 24 4.95 17 4.95
Austria 21 5.16 16 5.71 23 4.96 14 5.11
Australia 22 5.08 17 5.71 15 5.16 26 4.55
France 23 5.08 26 5.42 19 5.07 19 4.86
Saudi Arabia 24 5.06 15 5.72 33 4.64 32 4.19
Ireland 25 4.98 31 5.19 21 4.97 20 4.85
Korea, Rep. 26 4.96 20 5.55 25 4.83 22 4.78
Israel 27 4.95 36 5.12 26 4.75 10 5.16
China 28 4.89 28 5.34 30 4.68 33 4.14
Estonia 29 4.71 21 5.54 27 4.73 34 4.14
Iceland 30 4.71 27 5.39 35 4.60 28 4.43
Thailand 31 4.66 40 5.01 39 4.53 54 3.84
Puerto Rico 32 4.64 68 4.62 28 4.72 27 4.52
Chile 33 4.60 30 5.25 29 4.68 49 3.88
Indonesia 34 4.57 46 4.91 46 4.38 30 4.20
Spain 35 4.55 42 4.98 31 4.67 39 4.06
Portugal 36 4.54 41 5.00 37 4.57 31 4.19
Czech Republic 37 4.53 39 5.02 34 4.62 36 4.07
Azerbaijan 38 4.53 45 4.93 71 4.08 72 3.59
Mauritius 39 4.52 38 5.04 59 4.24 53 3.85
Kuwait 40 4.51 32 5.16 83 3.89 95 3.38
Lithuania 41 4.51 37 5.08 38 4.54 44 3.97
Latvia 42 4.50 34 5.14 36 4.60 61 3.68
Poland 43 4.48 55 4.80 32 4.64 63 3.66
Bahrain 44 4.48 29 5.31 40 4.51 55 3.83
Turkey 45 4.46 56 4.76 45 4.43 51 3.86
Oman 46 4.46 19 5.66 49 4.32 58 3.76
Malta 47 4.45 35 5.13 44 4.43 41 4.03
Panama 48 4.43 53 4.82 55 4.29 46 3.95
Italy 49 4.42 54 4.82 47 4.35 29 4.26
Kazakhstan 50 4.42 51 4.85 48 4.33 89 3.45
Costa Rica 51 4.42 62 4.70 56 4.28 35 4.13
Philippines 52 4.40 66 4.63 58 4.27 48 3.90
Russian Federation 53 4.37 44 4.94 41 4.49 75 3.54
Bulgaria 54 4.37 59 4.71 52 4.31 106 3.27
Barbados 55 4.36 43 4.96 54 4.30 47 3.92
South Africa 56 4.35 89 4.30 43 4.45 37 4.07
Brazil 57 4.34 83 4.40 42 4.46 56 3.82
Cyprus 58 4.31 58 4.73 57 4.28 38 4.06
Romania 59 4.30 77 4.48 50 4.32 78 3.53
Hungary 60 4.28 60 4.71 53 4.30 67 3.62
Mexico 61 4.27 69 4.59 60 4.20 59 3.73
Rwanda 62 4.27 67 4.62 91 3.77 66 3.64
Macedonia, FYR 63 4.26 64 4.64 69 4.09 76 3.53
Jordan 64 4.25 73 4.53 70 4.08 42 4.02
Peru 65 4.24 74 4.52 62 4.19 99 3.34
Colombia 66 4.23 78 4.45 63 4.17 64 3.65
Montenegro 67 4.23 61 4.71 73 3.99 77 3.53
Vietnam 68 4.23 79 4.44 74 3.99 98 3.35
Georgia 69 4.22 48 4.88 79 3.92 118 3.10
Slovenia 70 4.22 49 4.86 64 4.17 50 3.88
India 71 4.21 92 4.25 61 4.19 52 3.86
Morocco 72 4.21 57 4.74 78 3.92 82 3.50
Table 4: The Global Competitiveness Index 2014–2015
(Cont’d.)
© 2014 World Economic Forum
- 3. The Global Competitiveness Report 2014–2015 | 15
1.1: The Global Competitiveness Index 2014–2015
Table 4: The Global Competitiveness Index 2014–2015 (cont’d.)
SUBINDEX
OVERALL INDEX Basic requirements Efficiency enhancers Innovation and sophistication factors
Country/Economy Rank Score Rank Score Rank Score Rank Score
Sri Lanka 73 4.19 75 4.51 75 3.97 43 4.00
Botswana 74 4.15 72 4.53 84 3.87 110 3.22
Slovak Republic 75 4.15 70 4.58 51 4.31 73 3.59
Ukraine 76 4.14 87 4.36 67 4.11 92 3.41
Croatia 77 4.13 63 4.66 68 4.11 87 3.47
Guatemala 78 4.10 84 4.39 76 3.95 62 3.68
Algeria 79 4.08 65 4.64 125 3.34 133 2.91
Uruguay 80 4.04 47 4.90 72 4.01 85 3.47
Greece 81 4.04 76 4.50 65 4.15 74 3.55
Moldova 82 4.03 90 4.30 88 3.82 129 2.94
Iran, Islamic Rep. 83 4.03 71 4.57 98 3.70 102 3.33
El Salvador 84 4.01 80 4.41 96 3.71 45 3.96
Armenia 85 4.01 82 4.40 87 3.82 100 3.34
Jamaica 86 3.98 99 4.11 77 3.95 71 3.60
Tunisia 87 3.96 85 4.38 94 3.74 93 3.40
Namibia 88 3.96 81 4.40 97 3.71 91 3.41
Trinidad and Tobago 89 3.95 52 4.83 81 3.90 88 3.47
Kenya 90 3.93 115 3.82 66 4.12 40 4.03
Tajikistan 91 3.93 94 4.20 111 3.53 81 3.50
Seychelles 92 3.91 50 4.85 105 3.58 69 3.62
Lao PDR 93 3.91 98 4.13 107 3.58 80 3.51
Serbia 94 3.90 101 4.10 80 3.90 121 3.05
Cambodia 95 3.89 103 4.09 100 3.65 116 3.15
Zambia 96 3.86 109 3.88 86 3.85 57 3.76
Albania 97 3.84 97 4.14 95 3.72 114 3.17
Mongolia 98 3.83 105 3.99 92 3.76 112 3.20
Nicaragua 99 3.82 96 4.15 118 3.38 125 2.98
Honduras 100 3.82 107 3.97 99 3.65 70 3.61
Dominican Republic 101 3.82 106 3.98 90 3.77 90 3.44
Nepal 102 3.81 100 4.11 115 3.43 124 2.98
Bhutan 103 3.80 88 4.33 123 3.35 111 3.22
Argentina 104 3.79 104 4.08 93 3.75 96 3.37
Bolivia 105 3.77 93 4.21 116 3.40 94 3.38
Gabon 106 3.74 95 4.15 119 3.37 131 2.93
Lesotho 107 3.73 102 4.09 130 3.21 117 3.12
Kyrgyz Republic 108 3.73 110 3.87 104 3.59 126 2.96
Bangladesh 109 3.72 113 3.84 103 3.60 122 3.02
Suriname 110 3.71 86 4.36 121 3.35 123 3.00
Ghana 111 3.71 123 3.68 89 3.78 68 3.62
Senegal 112 3.70 120 3.75 102 3.62 65 3.65
Lebanon 113 3.68 127 3.55 85 3.86 101 3.33
Cape Verde 114 3.68 91 4.27 127 3.29 109 3.23
Côte d'Ivoire 115 3.67 119 3.75 108 3.58 86 3.47
Cameroon 116 3.66 116 3.79 113 3.48 84 3.47
Guyana 117 3.65 118 3.76 109 3.55 60 3.69
Ethiopia 118 3.60 117 3.78 120 3.37 119 3.09
Egypt 119 3.60 121 3.73 106 3.58 113 3.18
Paraguay 120 3.59 112 3.85 112 3.53 132 2.92
Tanzania 121 3.57 124 3.67 114 3.43 107 3.26
Uganda 122 3.56 126 3.59 110 3.53 104 3.30
Swaziland 123 3.55 108 3.92 126 3.32 108 3.25
Zimbabwe 124 3.54 114 3.83 133 3.12 127 2.95
Gambia, The 125 3.53 125 3.60 117 3.40 79 3.52
Libya 126 3.48 111 3.86 137 3.03 143 2.49
Nigeria 127 3.44 140 3.18 82 3.89 103 3.30
Mali 128 3.43 128 3.54 129 3.25 97 3.36
Pakistan 129 3.42 134 3.28 101 3.64 83 3.48
Madagascar 130 3.41 129 3.52 128 3.25 105 3.27
Venezuela 131 3.32 131 3.36 124 3.35 135 2.71
Malawi 132 3.25 139 3.20 122 3.35 115 3.17
Mozambique 133 3.24 133 3.29 131 3.19 120 3.05
Myanmar 134 3.24 132 3.36 134 3.11 139 2.62
Burkina Faso 135 3.21 135 3.25 132 3.16 128 2.95
Timor-Leste 136 3.17 122 3.71 141 2.84 136 2.69
Haiti 137 3.14 136 3.23 135 3.08 140 2.61
Sierra Leone 138 3.10 141 3.14 136 3.06 130 2.93
Burundi 139 3.09 130 3.40 144 2.62 137 2.68
Angola 140 3.04 137 3.21 140 2.84 144 2.36
Mauritania 141 3.00 138 3.21 143 2.69 138 2.63
Yemen 142 2.96 142 3.03 139 2.86 134 2.77
Chad 143 2.85 143 2.93 142 2.74 141 2.55
Guinea 144 2.79 144 2.76 138 2.88 142 2.55
Note: Ranks out of 144 economies and scores measured on a 1-to-7 scale.
© 2014 World Economic Forum
- 4. 1.1: The Global Competitiveness Index 2014–2015
16 | The Global Competitiveness Report 2014–2015
Table 5: The Global Competitiveness Index 2014–2015: Basic requirements
PILLAR
BASIC REQUIREMENTS 1. Institutions 2. Infrastructure3. Macroeconomic environment4. Health and primary education
Country/Economy Rank ScoreRankScoreRankScoreRankScoreRankScore
Albania 97 4.141033.38 90 3.521223.82 62 5.85
Algeria 65 4.641013.411063.12 11 6.41 81 5.61
Angola 137 3.211432.611392.01 71 4.701363.54
Argentina 104 4.081372.79 89 3.541024.22 67 5.78
Armenia 82 4.40 72 3.82 78 3.83 77 4.62 99 5.33
Australia 17 5.71 19 5.14 20 5.60 30 5.61 17 6.46
Austria 16 5.71 22 5.09 13 5.80 33 5.51 19 6.44
Azerbaijan 45 4.93 60 3.96 70 4.12 9 6.411045.24
Bahrain 29 5.31 29 4.70 31 5.19 47 5.19 40 6.16
Bangladesh 113 3.841312.961272.45 72 4.691025.29
Barbados 43 4.96 33 4.64 28 5.321323.42 16 6.47
Belgium 22 5.53 23 5.08 18 5.61 70 4.70 2 6.75
Bhutan 88 4.33 38 4.47 92 3.491193.90 89 5.47
Bolivia 93 4.21 90 3.531093.00 35 5.471094.85
Botswana 72 4.53 39 4.471013.19 13 6.301274.14
Brazil 83 4.40 94 3.47 76 3.98 85 4.49 77 5.65
Bulgaria 59 4.711123.32 74 4.06 36 5.45 51 6.03
Burkina Faso 135 3.251173.281412.01 83 4.551413.18
Burundi 130 3.401322.921402.011124.021144.64
Cambodia 103 4.091193.251073.05 80 4.60 91 5.44
Cameroon 116 3.79 91 3.531262.47 90 4.451124.70
Canada 18 5.70 14 5.43 15 5.74 51 5.06 7 6.58
Cape Verde 91 4.27 66 3.891043.141064.11 57 5.96
Chad 143 2.931402.661441.67 73 4.681442.72
Chile 30 5.25 28 4.82 49 4.56 22 5.88 70 5.75
China 28 5.34 47 4.22 46 4.66 10 6.41 46 6.08
Colombia 78 4.451113.32 84 3.66 29 5.651055.19
Costa Rica 62 4.70 46 4.26 73 4.08 93 4.40 48 6.06
Côte d'Ivoire 119 3.75 86 3.64 93 3.41 68 4.701403.25
Croatia 63 4.66 87 3.59 44 4.72 91 4.44 60 5.91
Cyprus 58 4.73 42 4.39 45 4.701343.32 9 6.53
Czech Republic 39 5.02 76 3.77 41 4.75 40 5.37 37 6.20
Denmark 13 5.85 16 5.35 21 5.59 16 6.11 25 6.37
Dominican Republic 106 3.981163.29 98 3.26 94 4.391074.98
Egypt 121 3.731003.411003.201412.96 97 5.37
El Salvador 80 4.41 99 3.44 57 4.341004.23 80 5.61
Estonia 21 5.54 26 4.96 38 4.85 20 6.00 26 6.33
Ethiopia 117 3.78 96 3.461252.49 95 4.361104.82
Finland 8 5.97 2 6.08 19 5.60 43 5.32 1 6.89
France 26 5.42 32 4.68 8 6.03 82 4.55 18 6.44
Gabon 95 4.15 79 3.72 1142.86 18 6.031304.01
Gambia, The 125 3.60 44 4.29 95 3.271422.961333.88
Georgia 48 4.88 48 4.21 59 4.31 48 5.14 63 5.84
Germany 11 5.91 17 5.23 7 6.09 24 5.83 14 6.48
Ghana 123 3.68 69 3.851083.031333.381214.46
Greece 76 4.50 85 3.64 36 4.881353.31 41 6.15
Guatemala 84 4.391093.34 67 4.17 64 4.741005.30
Guinea 144 2.761342.811431.781383.201393.25
Guyana 118 3.76 89 3.541102.941183.911134.66
Haiti 136 3.231352.811382.031203.871264.20
Honduras 107 3.971053.371023.181233.82 85 5.52
Hong Kong SAR 3 6.19 8 5.63 1 6.69 14 6.17 32 6.28
Hungary 60 4.71 83 3.67 50 4.56 61 4.78 64 5.84
Iceland 27 5.39 21 5.11 23 5.54 92 4.41 10 6.52
India 92 4.25 70 3.84 87 3.581014.22 98 5.35
Indonesia 46 4.91 53 4.11 56 4.37 34 5.48 74 5.67
Iran, Islamic Rep. 71 4.571083.36 69 4.15 62 4.77 52 6.00
Ireland 31 5.19 15 5.40 27 5.321303.49 8 6.54
Israel 36 5.12 43 4.32 34 4.99 50 5.07 44 6.10
Italy 54 4.821063.37 26 5.431084.09 22 6.40
Jamaica 99 4.11 80 3.71 80 3.751363.29 72 5.69
Japan 25 5.47 11 5.47 6 6.131273.64 6 6.62
Jordan 73 4.53 37 4.48 71 4.111313.45 47 6.07
Kazakhstan 51 4.85 57 4.02 62 4.25 27 5.74 96 5.37
Kenya 115 3.82 78 3.73 96 3.271263.731204.55
Korea, Rep. 20 5.55 82 3.70 14 5.74 7 6.44 27 6.31
Kuwait 32 5.16 55 4.02 61 4.28 3 6.73 82 5.59
Kyrgyz Republic 110 3.871243.211152.801044.161015.29
Lao PDR 98 4.13 63 3.92 94 3.381243.78 90 5.44
Latvia 34 5.14 51 4.13 47 4.61 32 5.52 31 6.28
Lebanon 127 3.551392.711222.621432.56 30 6.29
Lesotho 102 4.09 68 3.861162.77 28 5.691284.03
(Cont’d.)
© 2014 World Economic Forum
- 5. The Global Competitiveness Report 2014–2015 | 17
1.1: The Global Competitiveness Index 2014–2015
Table 5: The Global Competitiveness Index 2014–2015: Basic requirements (cont’d.)
PILLAR
BASIC REQUIREMENTS 1. Institutions 2. Infrastructure3. Macroeconomic environment4. Health and primary education
Country/Economy Rank ScoreRankScoreRankScoreRankScoreRankScore
Libya 111 3.861422.621132.88 41 5.361194.55
Lithuania 37 5.08 58 4.01 43 4.73 42 5.35 35 6.24
Luxembourg 7 6.02 6 5.69 16 5.73 8 6.43 36 6.21
Macedonia, FYR 64 4.64 45 4.26 82 3.73 55 4.93 78 5.64
Madagascar 129 3.521283.131352.10 81 4.601254.26
Malawi 139 3.20 77 3.741312.211442.421234.42
Malaysia 23 5.53 20 5.11 25 5.46 44 5.26 33 6.28
Mali 128 3.541263.181033.15 86 4.481383.33
Malta 35 5.13 40 4.46 37 4.88 65 4.73 20 6.43
Mauritania 138 3.211382.761232.591154.001373.48
Mauritius 38 5.04 35 4.60 42 4.74 74 4.66 42 6.14
Mexico 69 4.591023.40 65 4.19 53 5.04 71 5.73
Moldova 90 4.301213.22 83 3.68 56 4.91 93 5.40
Mongolia 105 3.99 98 3.441122.921253.77 65 5.81
Montenegro 61 4.71 59 3.96 72 4.10 88 4.46 29 6.31
Morocco 57 4.74 49 4.21 55 4.38 66 4.72 76 5.66
Mozambique 133 3.291273.161282.361104.061353.58
Myanmar 132 3.361362.801372.051164.001174.59
Namibia 81 4.40 50 4.19 66 4.17 78 4.621154.63
Nepal 100 4.111203.221322.15 37 5.40 75 5.66
Netherlands 10 5.95 10 5.53 4 6.25 39 5.38 5 6.64
New Zealand 9 5.96 1 6.09 29 5.30 25 5.79 4 6.66
Nicaragua 96 4.151143.31 99 3.20 67 4.71 95 5.37
Nigeria 140 3.181293.011342.13 76 4.621432.97
Norway 6 6.05 5 5.74 32 5.16 1 6.83 15 6.47
Oman 19 5.66 24 5.06 33 5.01 6 6.56 54 5.99
Pakistan 134 3.281233.211192.661373.241294.02
Panama 53 4.82 71 3.83 40 4.77 52 5.05 79 5.63
Paraguay 112 3.851332.901172.70 54 5.011114.76
Peru 74 4.521183.26 88 3.54 21 5.89 94 5.39
Philippines 66 4.63 67 3.86 91 3.49 26 5.76 92 5.41
Poland 55 4.80 56 4.02 63 4.24 63 4.77 39 6.17
Portugal 41 5.00 41 4.43 17 5.661283.52 24 6.39
Puerto Rico 68 4.62 34 4.62 58 4.34 99 4.241035.27
Qatar 5 6.12 4 5.90 24 5.51 2 6.74 28 6.31
Romania 77 4.48 88 3.56 85 3.65 46 5.20 88 5.51
Russian Federation 44 4.94 97 3.45 39 4.82 31 5.54 56 5.97
Rwanda 67 4.62 18 5.211053.14 79 4.62 86 5.52
Saudi Arabia 15 5.72 25 4.97 30 5.19 4 6.67 50 6.03
Seychelles 50 4.85 54 4.04 53 4.50 57 4.89 55 5.98
Senegal 120 3.75 74 3.811112.93 97 4.291313.96
Serbia 101 4.101223.21 77 3.931293.51 68 5.76
Sierra Leone 141 3.141073.371362.071173.941423.18
Singapore 1 6.34 3 5.98 2 6.54 15 6.13 3 6.73
Slovak Republic 70 4.581103.33 64 4.21 45 5.23 84 5.55
Slovenia 49 4.86 75 3.81 35 4.88 98 4.27 12 6.50
South Africa 89 4.30 36 4.50 60 4.29 89 4.451323.96
Spain 42 4.98 73 3.82 9 6.011213.83 34 6.25
Sri Lanka 75 4.51 62 3.93 75 4.021144.01 45 6.09
Suriname 86 4.361043.37 86 3.61 59 4.80 73 5.67
Swaziland 108 3.92 61 3.94 97 3.26 60 4.791343.69
Sweden 12 5.86 13 5.43 22 5.55 17 6.06 23 6.39
Switzerland 4 6.17 9 5.60 5 6.18 12 6.40 11 6.52
Taiwan, China 14 5.75 27 4.84 11 5.82 23 5.83 13 6.49
Tajikistan 94 4.20 65 3.901202.65 69 4.70 83 5.56
Tanzania 124 3.67 93 3.491302.261094.061084.86
Thailand 40 5.01 84 3.66 48 4.58 19 6.01 66 5.80
Timor-Leste 122 3.711253.211332.14 49 5.121244.38
Trinidad and Tobago 52 4.83 95 3.46 52 4.51 38 5.39 59 5.94
Tunisia 85 4.38 81 3.70 79 3.801114.03 53 6.00
Turkey 56 4.76 64 3.90 51 4.55 58 4.83 69 5.75
Uganda 126 3.591153.291292.28 96 4.361224.45
Ukraine 87 4.361302.98 68 4.161054.14 43 6.14
United Arab Emirates 2 6.20 7 5.69 3 6.30 5 6.63 38 6.17
United Kingdom 24 5.49 12 5.44 10 6.011074.10 21 6.43
United States 33 5.15 30 4.69 12 5.821134.01 49 6.06
Uruguay 47 4.90 31 4.68 54 4.47 84 4.52 58 5.94
Venezuela 131 3.361442.151212.651393.13 87 5.51
Vietnam 79 4.44 92 3.51 81 3.74 75 4.66 61 5.86
Yemen 142 3.031412.651421.901402.981164.59
Zambia 109 3.88 52 4.121182.671034.161184.56
Zimbabwe 114 3.83 1133.311242.54 87 4.481064.99
Note: Ranks out of 144 economies and scores measured on a 1-to-7 scale.
© 2014 World Economic Forum
- 6. 1.1: The Global Competitiveness Index 2014–2015
18 | The Global Competitiveness Report 2014–2015
Table 6: The Global Competitiveness Index 2014–2015: Efficiency enhancers
PILLAR
EFFICIENCY
ENHANCERS
5. Higher education
and training
6. Goods market
efficiency
7. Labor market
efficiency
8. Financial market
development
9. Technological
readiness 10. Market size
Country/Economy Rank ScoreRankScoreRankScoreRankScoreRankScoreRankScoreRankScore
Albania 95 3.72604.53934.15934.021143.39913.301052.94
Algeria 125 3.34983.691363.481393.151372.721292.59474.39
Angola 140 2.841441.941432.921283.521402.501402.34653.84
Argentina 93 3.75454.831413.141432.971293.04823.54244.97
Armenia 87 3.82754.20644.37744.20973.71713.721182.75
Australia 15 5.16115.67294.76564.3065.41195.64185.14
Austria 23 4.96155.56224.96434.45434.45185.74374.61
Azerbaijan 71 4.08903.90724.31334.59893.77564.26723.66
Bahrain 40 4.51554.66214.98264.67314.65345.01993.08
Bangladesh 103 3.601252.86844.201243.67883.771262.66444.46
Barbados 54 4.30305.22744.28314.60324.63354.981382.07
Belgium 18 5.0755.93145.14604.27384.53145.78284.80
Bhutan 123 3.351083.451153.99244.691113.451242.691401.83
Bolivia 116 3.40973.731323.601273.581213.331182.79843.38
Botswana 84 3.871013.59974.12364.56574.22763.58973.12
Brazil 42 4.46414.921233.851093.83534.30584.2195.66
Bulgaria 52 4.31634.49634.37674.24604.17414.73633.87
Burkina Faso 132 3.161362.421273.81704.221273.141322.491112.87
Burundi 144 2.621422.141353.491033.891422.371422.101411.74
Cambodia 100 3.651232.92904.17294.63843.801023.02873.31
Cameroon 113 3.481173.221133.99814.111083.511202.76913.30
Canada 6 5.37185.50155.1375.2085.35225.57135.48
Cape Verde 127 3.29893.911104.011263.591153.36803.541441.30
Chad 142 2.741432.051422.941203.721362.741432.091062.92
Chile 29 4.68325.09344.68504.36194.88 42 4.59414.50
China 30 4.68654.42564.42374.55544.30833.5326.86
Colombia 63 4.17694.371094.03844.08704.01683.84324.71
Costa Rica 56 4.28375.00524.47574.29923.74404.77823.43
Côte d'Ivoire 108 3.581213.12824.23734.21783.861172.81943.23
Croatia 68 4.11 53 4.671054.051063.86743.91444.56793.58
Cyprus 57 4.28335.06274.86304.61833.81434.561152.77
Czech Republic 34 4.62355.02504.53624.26444.45364.96424.49
Denmark 17 5.11105.68234.96124.99274.7266.10544.23
Dominican Republic 90 3.77993.69944.151073.85993.70843.51683.72
Egypt 106 3.581113.271183.951403.081253.19953.21294.78
El Salvador 96 3.71943.85554.451253.64863.78933.24903.30
Estonia 27 4.73205.49264.89115.02294.67295.261003.07
Ethiopia 120 3.371312.631243.84784.151203.331332.46663.81
Finland 10 5.2716.22185.03234.6955.55115.97554.18
France 19 5.07285.26464.57614.27234.79175.7785.74
Gabon 119 3.371262.781263.81694.231053.571082.951092.89
Gambia, The 117 3.401073.451114.00384.54943.741033.021421.65
Georgia 79 3.92923.89604.40414.49763.90673.851032.98
Germany 9 5.28165.55194.99354.57254.76135.8155.99
Ghana 89 3.781063.46674.34983.94624.151003.11693.71
Greece 65 4.15444.84854.201183.741302.97394.79494.34
Guatemala 76 3.951033.56454.58854.07454.44883.47783.59
Guinea 138 2.881402.191373.40894.051342.851392.351272.44
Guyana 109 3.55824.12834.211013.90823.811013.101352.15
Haiti 135 3.081093.431403.21774.151352.811342.411292.43
Honduras 99 3.651003.63914.171303.51594.17973.18933.24
Hong Kong SAR 3 5.58225.442 5.59 35.5715.9156.10274.89
Hungary 53 4.30 52 4.68654.36754.17733.93504.43534.26
Iceland 35 4.60135.62494.54144.94684.0386.021282.44
India 61 4.19933.86954.131123.81514.341212.7536.26
Indonesia 46 4.38614.53484.541103.81424.45773.58155.34
Iran, Islamic Rep. 98 3.70784.171203.931423.011283.051072.95215.09
Ireland 21 4.97175.54105.29184.82614.15125.89574.15
Israel 26 4.75365.00794.24594.27204.87155.78484.36
Italy 47 4.35474.78734.301363.291193.35384.82125.57
Jamaica 77 3.95764.19764.28584.28484.40753.611072.92
Japan 7 5.35215.44125.20224.73164.98205.6146.14
Jordan 70 4.08484.78404.63944.02664.06733.71883.30
Kazakhstan 48 4.33624.51544.46154.90983.70614.16524.26
Kenya 66 4.12953.77624.40254.68244.77873.48743.62
Korea, Rep. 25 4.83235.38334.70864.07803.81255.42115.60
Kuwait 83 3.89814.151064.041163.78773.88743.69673.80
Kyrgyz Republic 104 3.59913.89774.25924.02953.731112.901172.76
Lao PDR 107 3.581103.28594.41344.591013.691152.831212.67
Latvia 36 4.60315.13364.67174.82334.63325.12953.20
Lebanon 85 3.86674.39714.311233.681023.65863.50763.61
Lesotho 130 3.211163.23804.24764.161233.271372.371392.01
(Cont’d.)
© 2014 World Economic Forum
- 7. The Global Competitiveness Report 2014–2015 | 19
1.1: The Global Competitiveness Index 2014–2015
Table 6: The Global Competitiveness Index 2014–2015: Efficiency enhancers (cont’d.)
PILLAR
EFFICIENCY
ENHANCERS
5. Higher education
and training
6. Goods market
efficiency
7. Labor market
efficiency
8. Financial market
development
9. Technological
readiness 10. Market size
Country/Economy Rank ScoreRankScoreRankScoreRankScoreRankScoreRankScoreRankScore
Libya 137 3.031023.591393.321333.411441.951302.56853.33
Lithuania 38 4.54265.30474.57534.33654.09285.37773.60
Luxembourg 22 4.97434.8855.48164.87145.1016.36963.13
Macedonia, FYR 69 4.09714.32384.64714.21414.49623.991082.91
Madagascar 128 3.251302.641024.08394.531322.851272.631142.77
Malawi 122 3.351322.571084.03284.63793.821352.411232.63
Malaysia 24 4.95464.8075.42194.8045.60604.18264.90
Mali 129 3.251282.701044.071023.891223.321122.861222.66
Malta 44 4.43424.92314.72544.32364.56215.581262.48
Mauritania 143 2.691412.161383.351413.071412.501232.711312.33
Mauritius 59 4.24544.66254.92524.33264.74633.971132.83
Mexico 60 4.20873.99864.191213.71634.14793.55105.61
Moldova 88 3.82844.081034.07824.111003.70514.381242.60
Mongolia 92 3.76684.37814.23424.481243.22813.541202.73
Montenegro 73 3.99514.68694.34654.24564.26544.281342.16
Morocco 78 3.921043.56584.411113.81694.02783.57564.17
Mozambique 131 3.191382.391163.991043.881263.141222.711013.07
Myanmar 134 3.111352.441303.68724.211392.581442.07703.70
Namibia 97 3.711153.23964.13554.31464.43893.421192.74
Nepal 115 3.431133.251213.911143.80753.901282.61983.10
Netherlands 8 5.2835.9995.34214.73374.5596.00235.07
New Zealand 11 5.2695.7265.4365.2435.73235.55623.89
Nicaragua 118 3.381143.231253.811083.841063.561132.841022.98
Nigeria 82 3.891242.88874.19404.53674.061043.02334.70
Norway 13 5.2485.75244.93134.97105.34 4 6.12504.34
Oman 49 4.32794.17284.81484.39284.69574.24733.65
Pakistan 101 3.641272.761004.081323.43723.991142.83304.75
Panama 55 4.29664.40414.62874.06224.83534.34803.50
Paraguay 112 3.53 1123.27924.161153.79933.741102.93923.29
Peru 62 4.19834.08534.47514.33404.49923.30434.47
Philippines 58 4.27644.45704.32914.03494.37693.78354.68
Poland 32 4.64345.04514.49794.14354.60484.47195.12
Portugal 37 4.57245.37444.58834.091043.65265.42514.32
Puerto Rico 28 4.72275.27204.99464.40214.85374.87603.95
Qatar 20 4.98384.9945.51105.05135.18315.17593.99
Romania 50 4.32584.63894.18904.04644.12474.49454.44
Russian Federation 41 4.49394.96994.09454.421103.50594.1975.77
Rwanda 91 3.771222.98424.6295.08554.26983.141252.52
Saudi Arabia 33 4.64574.64354.68644.25304.66454.54205.10
Seychelles 105 3.58854.04884.18444.441033.65703.731431.46
Senegal 102 3.621193.18684.34684.23853.80963.211042.96
Serbia 80 3.90744.251283.781193.731093.50494.45713.68
Sierra Leone 136 3.061372.391173.98954.011163.361382.361332.27
Singapore 2 5.6826.0915.6425.6925.8476.09314.71
Slovak Republic 51 4.31564.65664.36973.95394.50524.37584.03
Slovenia 64 4.17255.33614.40993.931332.85335.05813.45
South Africa 43 4.45864.04324.711133.8075.37663.86254.91
Spain 31 4.67295.23754.281003.92913.76275.40145.42
Sri Lanka 75 3.97724.30394.631353.29474.41943.24613.94
Suriname 121 3.351053.501293.741173.741183.35723.711372.08
Swaziland 126 3.321203.18984.091053.86714.001252.661362.09
Sweden 12 5.25145.5917 5.04 204.79125.2536.19364.62
Switzerland 5 5.4945.9885.3915.75115.29105.97394.57
Taiwan, China 16 5.14 125.63115.23324.59184.91305.24175.23
Tajikistan 111 3.53883.971143.99634.251133.401162.831162.76
Tanzania 114 3.431342.451223.90474.39963.721312.51753.61
Thailand 39 4.53594.58304.74664.24344.61653.94225.09
Timor-Leste 141 2.841332.521343.561223.681382.691412.171302.40
Trinidad and Tobago 81 3.90774.191014.08963.97524.33643.961122.87
Tunisia 94 3.74734.281074.031293.511173.35903.38643.87
Turkey 45 4.43504.69434.601313.48584.21554.27165.31
Uganda 110 3.531292.681193.95274.66813.811192.78863.32
Ukraine 67 4.11404.931123.99804.121073.54853.50384.58
United Arab Emirates 14 5.2465.9035.5885.14174.94245.48464.41
United Kingdom 4 5.51195.50135.1655.26155.0726.2865.78
United States 1 5.7175.82165.0545.3095.35165.7816.94
Uruguay 72 4.01494.71574.411343.37873.78464.50893.30
Venezuela 124 3.35704.341442.781442.551312.911062.96404.55
Vietnam 74 3.99963.74784.24494.37903.77993.12344.69
Yemen 139 2.861392.291313.641383.231432.171362.40833.42
Zambia 86 3.85804.16374.65884.06504.371052.991102.88
Zimbabwe 133 3.121183.181333.581373.251123.441092.951322.31
Note: Ranks out of 144 economies and scores measured on a 1-to-7 scale.
© 2014 World Economic Forum
- 8. 1.1: The Global Competitiveness Index 2014–2015
20 | The Global Competitiveness Report 2014–2015
PILLAR
INNOVATION AND SOPHISTICATION
FACTORS
11. Business
sophistication 12. Innovation
Country/Economy Rank ScoreRankScoreRankScore
Albania 114 3.171043.611202.73
Algeria 133 2.911313.221282.60
Angola 144 2.361442.611422.12
Argentina 96 3.37963.69973.04
Armenia 100 3.34933.731042.95
Australia 26 4.55284.70254.41
Austria 14 5.1175.41184.82
Azerbaijan 72 3.59803.86593.33
Bahrain 55 3.83454.35603.32
Bangladesh 122 3.021183.451292.58
Barbados 47 3.92534.28473.56
Belgium 12 5.11105.34134.89
Bhutan 111 3.221073.581132.85
Bolivia 94 3.381033.61833.15
Botswana 110 3.221163.471022.97
Brazil 56 3.82474.32623.31
Bulgaria 106 3.271053.611052.94
Burkina Faso 128 2.951363.001072.89
Burundi 137 2.681392.911332.46
Cambodia 116 3.151113.521162.79
Cameroon 84 3.47983.68713.27
Canada 24 4.72234.90224.54
Cape Verde 109 3.231143.481012.98
Chad 141 2.551432.771392.34
Chile 49 3.88554.23483.54
China 33 4.14434.38323.91
Colombia 64 3.65624.08773.21
Costa Rica 35 4.13324.49343.78
Côte d'Ivoire 86 3.471003.66693.28
Croatia 87 3.47833.83933.10
Cyprus 38 4.06404.41363.72
Czech Republic 36 4.07354.46393.67
Denmark 9 5.19115.33115.06
Dominican Republic 90 3.44733.921032.96
Egypt 113 3.18953.701242.65
El Salvador 45 3.96374.43513.50
Estonia 34 4.14484.32303.95
Ethiopia 119 3.091273.321092.87
Finland 3 5.5795.3615.78
France 19 4.86224.98194.74
Gabon 131 2.931333.181222.68
Gambia, The 79 3.52713.93893.11
Georgia 118 3.101133.491212.71
Germany 4 5.5635.6565.47
Ghana 68 3.62703.94633.31
Greece 74 3.55743.91793.18
Guatemala 62 3.68524.29953.07
Guinea 142 2.551412.851412.25
Guyana 60 3.69683.97553.42
Haiti 140 2.611382.941402.28
Honduras 70 3.61644.00743.23
Hong Kong SAR 23 4.75165.13264.38
Hungary 67 3.62923.75503.50
Iceland 28 4.43294.67274.19
India 52 3.86574.18493.53
Indonesia 30 4.20344.47313.93
Iran, Islamic Rep. 102 3.33 110 3.52863.13
Ireland 20 4.85205.02204.68
Israel 10 5.16264.7635.56
Italy 29 4.26254.79353.73
Jamaica 71 3.60673.98753.22
Japan 2 5.6815.8245.54
Jordan 42 4.02424.40413.64
Kazakhstan 89 3.45913.77853.14
Kenya 40 4.03444.38383.69
Korea, Rep. 22 4.78274.73174.83
Kuwait 95 3.38763.901112.86
Kyrgyz Republic 126 2.961193.441322.48
Lao PDR 80 3.51793.87843.14
Latvia 61 3.68614.09703.27
Lebanon 101 3.33753.911192.75
Lesotho 117 3.121233.371102.87
Table 7: The Global Competitiveness Index 2014–2015: Innovation and sophistication factors
PILLAR
INNOVATION AND SOPHISTICATION
FACTORS
11. Business
sophistication 12. Innovation
Country/Economy Rank ScoreRankScoreRankScore
Libya 143 2.491353.011441.98
Lithuania 44 3.97494.31443.62
Luxembourg 18 4.93215.00164.85
Macedonia, FYR 76 3.53893.78683.28
Madagascar 105 3.271173.46943.09
Malawi 115 3.171083.541152.80
Malaysia 17 4.95155.24214.67
Mali 97 3.361023.62923.10
Malta 41 4.03364.45453.60
Mauritania 138 2.631422.851362.41
Mauritius 53 3.85334.48763.22
Mexico 59 3.73584.14613.31
Moldova 129 2.941243.351312.53
Mongolia 112 3.201153.471062.94
Montenegro 77 3.53973.69583.37
Morocco 82 3.50783.88903.11
Mozambique 120 3.051253.341182.76
Myanmar 139 2.621402.901382.34
Namibia 91 3.41943.72913.10
Nepal 124 2.981263.341262.62
Netherlands 6 5.4155.5785.25
New Zealand 25 4.61244.80234.42
Nicaragua 125 2.981293.281232.68
Nigeria 103 3.30873.781142.82
Norway 16 5.08135.30154.85
Oman 58 3.76564.23643.29
Pakistan 83 3.48813.85883.12
Panama 46 3.95544.24403.65
Paraguay 132 2.921213.391342.44
Peru 99 3.34723.931172.76
Philippines 48 3.90464.33523.48
Poland 63 3.66634.06723.26
Portugal 31 4.19514.29284.08
Puerto Rico 27 4.52185.08293.96
Qatar 15 5.09125.31144.88
Romania 78 3.53903.77663.28
Russian Federation 75 3.54863.79653.29
Rwanda 66 3.64843.83533.46
Saudi Arabia 32 4.19304.57333.80
Seychelles 69 3.62663.99733.25
Senegal 65 3.65773.90573.39
Serbia 121 3.051323.211082.89
Sierra Leone 130 2.931283.281302.58
Singapore 11 5.13195.0795.18
Slovak Republic 73 3.59654.00783.18
Slovenia 50 3.88594.11423.64
South Africa 37 4.07314.49433.64
Spain 39 4.06384.42373.69
Sri Lanka 43 4.00394.42463.57
Suriname 123 3.001223.391272.60
Swaziland 108 3.251013.631122.86
Sweden 7 5.3885.3875.37
Switzerland 1 5.7425.7925.70
Taiwan, China 13 5.11175.12105.10
Tajikistan 81 3.50823.83803.17
Tanzania 107 3.261123.49983.03
Thailand 54 3.84414.40673.28
Timor-Leste 136 2.69 1372.971352.41
Trinidad and Tobago 88 3.47693.941002.99
Tunisia 93 3.40883.78993.01
Turkey 51 3.86504.31563.42
Uganda 104 3.301093.53963.06
Ukraine 92 3.41993.66813.16
United Arab Emirates 21 4.83145.25244.41
United Kingdom 8 5.2165.45124.96
United States 5 5.5445.5855.49
Uruguay 85 3.47853.79823.15
Venezuela 135 2.711343.041372.39
Vietnam 98 3.351063.58873.12
Yemen 134 2.771203.431432.11
Zambia 57 3.76604.10543.42
Zimbabwe 127 2.951303.281252.63
Note: Ranks out of 144 economies and scores measured on a 1-to-7 scale.
© 2014 World Economic Forum