More Related Content
Similar to Table 1 demographics and economic indicators
Similar to Table 1 demographics and economic indicators (20)
More from Bread for the World
More from Bread for the World (20)
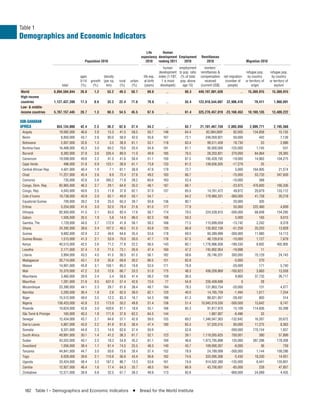
Table 1 demographics and economic indicators
- 1. Table 1
Demographics and Economic Indicators
Life Human
expectancy development Employment Remittances
Population 2010 2010 ranking 2011 2010 2010 Migration 2010
human employment workers'
development to pop. ratio remittances & refugee pop. refugee pop.
ages density life exp. index (1-187, (% of total compensation net migration by country by country
0-14 growth (per sq. rural urban at birth 1 is most pop. above received (number of or territory of or territory of
total (%) (%) km) (%) (%) (years) developed) age 15) (current US$) people) origin asylum
World 6,894,594,844 26.8 1.2 53.2 49.3 50.7 69.6 .. 60.3 449,197,001,626 .. 15,369,915 15,369,915
High-income
countries 1,127,437,399 17.3 0.6 33.2 22.4 77.6 79.8 .. 55.4 123,918,544,607 22,906,410 79,411 1,960,691
Low- & middle-
income countries 5,767,157,445 28.7 1.3 60.3 54.5 45.5 67.6 .. 61.4 325,278,457,019 -23,160,453 10,169,135 13,409,222
SUB-SAHARAN
AFRICA 854,134,000 42.4 2.5 36.2 62.6 37.4 54.2 .. 63.7 21,101,467,159 -2,005,850 2,809,771 2,195,568
Angola 19,082,000 46.6 2.8 15.3 41.5 58.5 50.7 148 64.4 82,084,000c 82,005 134,858 15,155
Benin 8,850,000 43.7 2.8 80.0 58.0 42.0 55.6 167 72.1 248,059,921 50,000 442 7,139
Botswana 2,007,000 32.6 1.3 3.5 38.9 61.1 53.1 118 63.4 99,511,459 18,730 53 2,986
Burkina Faso 16,468,000 45.3 3.0 60.2 79.6 20.4 54.9 181 81.1 95,000,000 -125,000 1,145 531
Burundi 8,382,000 37.9 2.6 326.4 89.0 11.0 49.9 185 76.5 28,203,821 370,000 84,064 29,365
Cameroon 19,599,000 40.6 2.2 41.5 41.6 58.4 51.1 150 67.5 195,428,192 -19,000 14,963 104,275
Cape Verde 496,000 31.8 0.9 123.1 38.9 61.1 73.8 133 61.2 138,636,505 -17,279 25 ..
Central African Rep. 4,401,000 40.4 1.9 7.1 61.1 38.9 47.6 179 72.7 .. 5,000 164,905 21,574
Chad 11,227,000 45.4 2.6 8.9 72.4 27.6 49.2 183 66.7 .. -75,000 53,733 347,939
Comoros 735,000 42.6 2.6 395.2 71.8 28.2 60.6 163 53.4 .. -10,000 368 ..
Congo, Dem. Rep. 65,965,000 46.3 2.7 29.1 64.8 35.2 48.1 187 66.1 .. -23,975 476,693 166,336
Congo, Rep. 4,043,000 40.6 2.5 11.8 37.9 62.1 57.0 137 65.5 14,761,472 49,872 20,679 133,112
Cote d’Ivoire 19,738,000 40.9 2.0 62.1 49.9 50.1 54.7 .. 64.2 178,980,331 -360,000 41,758 26,218
Equatorial Guinea 700,000 39.2 2.8 25.0 60.3 39.7 50.8 136 80.1 .. 20,000 305 ..
Eritrea 5,254,000 41.6 3.0 52.0 78.4 21.6 61.0 177 77.9 .. 55,000 222,460 4,809
Ethiopia 82,950,000 41.5 2.1 83.0 82.4 17.6 58.7 174 79.5 224,528,915 -300,000 68,848 154,295
Gabon 1,505,000 35.5 1.9 5.8 14.0 86.0 62.3 106 50.3 .. 5,000 165 9,015
Gambia, The 1,729,000 44.0 2.7 172.9 41.9 58.1 58.2 168 71.5 115,699,059 -13,742 2,242 8,378
Ghana 24,392,000 38.6 2.4 107.2 48.5 51.5 63.8 135 66.8 135,852,158 -51,258 20,203 13,828
Guinea 9,982,000 42.9 2.2 40.6 64.6 35.4 53.6 178 69.5 60,389,999 -300,000 11,985 14,113
Guinea-Bissau 1,515,000 41.3 2.1 53.9 70.0 30.0 47.7 176 67.5 48,129,616 -10,000 1,127 7,679
Kenya 40,513,000 42.5 2.6 71.2 77.8 22.2 56.5 143 60.1 1,776,986,938 -189,330 8,602 402,905
Lesotho 2,171,000 37.4 1.0 71.5 73.1 26.9 47.4 160 47.2 745,902,954 -19,998 11 ..
Liberia 3,994,000 43.5 4.0 41.5 38.5 61.5 56.1 182 58.6 26,746,201 300,000 70,129 24,743
Madagascar 20,714,000 43.1 2.9 35.6 69.8 30.2 66.5 151 83.9 .. -5,000 270 ..
Malawi 14,901,000 45.8 3.1 158.1 80.2 19.8 53.5 171 76.8 .. -20,000 171 5,740
Mali 15,370,000 47.2 3.0 12.6 66.7 33.3 51.0 175 48.3 436,209,869 -100,823 3,663 13,558
Mauritania 3,460,000 39.9 2.4 3.4 58.6 41.4 58.2 159 36.0 .. 9,900 37,733 26,717
Mauritius 1,281,000 21.9 0.5 631.0 57.4 42.6 73.0 77 54.9 226,409,699 0 28 ..
Mozambique 23,390,000 44.1 2.3 29.7 61.6 38.4 49.7 184 78.3 131,863,754 -20,000 131 4,077
Namibia 2,283,000 36.4 1.8 2.8 62.0 38.0 62.1 120 40.0 14,765,759 -1,494 1,017 7,254
Niger 15,512,000 49.0 3.5 12.2 83.3 16.7 54.3 186 61.3 88,021,957 -28,497 803 314
Nigeria 158,423,000 42.8 2.5 173.9 50.2 49.8 51.4 156 51.4 10,045,019,530 -300,000 15,642 8,747
Rwanda 10,624,000 42.6 3.0 430.6 81.1 18.9 55.1 166 85.3 91,817,970 15,109 114,836 55,398
São Tomé & Principe 165,000 40.3 1.8 171.9 37.8 62.2 64.3 144 .. 1,987,907 -6,496 33 ..
Senegal 12,434,000 43.7 2.7 64.6 57.1 42.9 59.0 155 69.2 1,346,047,363 -132,842 16,267 20,672
Sierra Leone 5,867,000 43.0 2.2 81.9 61.6 38.4 47.4 180 65.3 57,520,515 60,000 11,275 8,363
Somalia 9,331,000 44.9 2.3 14.9 62.6 37.4 50.9 .. 52.6 .. -300,000 770,154 1,937
South Africa 49,991,000 30.1 1.4 41.2 38.3 61.7 52.1 123 39.1 1,119,265,625 700,001 380 57,899
Sudan 43,552,000 40.1 2.5 18.3 54.8 45.2 61.1 169 48.6 1,973,795,898 135,000 387,288 178,308
Swaziland 1,056,000 38.4 1.1 61.4 74.5 25.5 48.3 140 43.7 109,000,267 -6,000 36 759
Tanzania 44,841,000 44.7 3.0 50.6 73.6 26.4 57.4 152 78.9 24,789,099 -300,000 1,144 109,286
Togo 6,028,000 39.6 2.1 110.8 56.6 43.4 56.6 162 74.6 333,095,306 -5,430 18,330 14,051
Uganda 33,424,000 48.4 3.2 167.3 86.7 13.3 53.6 161 74.6 914,502,380 -135,000 6,441 135,801
Zambia 12,927,000 46.4 1.6 17.4 64.3 35.7 48.5 164 66.9 43,700,001 -85,000 228 47,857
Zimbabwe 12,571,000 38.9 0.8 32.5 61.7 38.3 49.9 173 82.6 .. -900,000 24,089 4,435
182 Table 1 – Demographics and Economic Indicators I Bread for the World Institute
- 2. Table 1
Demographics and Economic Indicators
Military spending Debt & inflation Exports & imports of goods Exports & imports Income inequality
Gross domestic product (GDP) 2009-2010 2007-2010 2010 and services 2007-2010 of food 2007-2010 2007-2010
value of exports imports GINI index (0 is
per capita per capita external debt inflation, exports imports (% of (% of perfect equality
GDP (current growth (current PPP (current % of gov't (current consumer (current (current merchan- merchan- & 100 is perfect
million US$) (%) US$) int'l $) spending million US$) prices (%) million US$) million US$) dise) dise) inequality)
World 63,256,970 4.2 9,175 11,125 2.6 .. .. 18,822,217 18,383,131 8.2 7.4 ..
High-income
countries 43,239,947 3.1 38,352 37,292 2.9 .. .. 13,041,358 12,936,685 7.5 7.4 ..
Low- & middle-
income countries 20,085,491 7.6 3,483 6,024 2.0 3,689,003 .. 5,824,448 5,488,130 10.6 7.7 ..
SUB-SAHARAN
AFRICA 1,123,626 5.1 1,316 2,285 1.6 178,864 .. 370,486 379,668 15.2 10.5 ..
Angola 84,937 5.9 4,451 6,186 4.4 15,787 14.5 48,275 36,814 .. .. ..
Benin 6,633 3.0 749 1,587 1.0 852 2.3 937 1,839 .. .. ..
Botswana 14,859 7.2 7,403 13,893 2.7 1,141 6.9 4,850 5,904 5.1 12.4 ..
Burkina Faso 8,820 9.2 536 1,256 1.5 1,538 -0.8 .. .. 33.3 15.1 39.8
Burundi 1,611 3.9 192 409 3.8 194 6.4 .. .. 81.4 13.7 ..
Cameroon 22,480 3.2 1,147 2,294 1.6 1,194 1.3 6,502 7,200 24.4 17.7 38.9
Cape Verde 1,648 5.4 3,323 3,875 0.5 455 2.1 647 1,109 81.6 27.7 ..
Central African Rep. 2,013 3.3 457 789 2.6 246 1.5 290 449 3.6 39.3 56.3
Chad 7,588 4.3 676 1,370 3.0 1,845 10.0 3,331 5,213 .. .. ..
Comoros 541 2.1 736 1,096 .. 163 -0.1 79 258 13.8 19.5 ..
Congo, Dem. Rep. 13,145 7.2 199 347 1.4 2,972 17.3 3,412 5,096 .. .. ..
Congo, Rep. 12,008 8.8 2,970 4,245 1.1 1,577 5.0 10,221 6,568 .. .. ..
Cote d’Ivoire 22,780 3.0 1,154 1,899 1.6 10,597 1.7 9,316 8,270 49.5 19.2 41.5
Equatorial Guinea 14,006 0.9 20,009 34,753 .. .. 6.6 8,549 7,063 .. .. ..
Eritrea 2,117 2.2 403 546 .. 597 .. 84 379 .. .. ..
Ethiopia 29,717 10.1 358 1,041 1.1 3,924 8.1 3,392 9,653 78.5 11.0 ..
Gabon 13,137 5.7 8,729 15,054 1.0 2,126 1.5 8,094 4,754 0.8 17.1 ..
Gambia, The 807 5.0 466 1,410 0.7 217 5.0 236 393 77.9 36.1 ..
Ghana 32,309 7.7 1,325 1,644 0.4 4,956 10.7 9,461 13,265 60.7 15.3 ..
Guinea 4,511 1.9 452 1,091 .. 2,007 15.5 1,577 1,778 2.5 13.2 39.4
Guinea-Bissau 879 3.5 580 1,186 .. 124 2.5 .. .. .. .. ..
Kenya 32,198 5.6 795 1,651 1.9 5,912 4.0 8,861 12,192 47.9 12.0 ..
Lesotho 2,179 5.6 1,004 1,601 2.7 396 3.6 955 2,482 13.5 20.2 ..
Liberia 986 5.5 247 419 0.8 86 7.4 262 1,454 .. .. 38.2
Madagascar 8,721 1.6 421 969 0.7 1,832 9.2 2,447 4,484 26.7 13.6 44.1
Malawi 5,054 7.1 339 882 1.2 717 7.4 1,547 2,387 76.4 13.6 ..
Mali 9,251 4.5 602 1,065 1.9 1,425 1.1 1,871 2,542 29.8 11.6 33.0
Mauritania 3,614 5.2 1,044 2,456 3.8 2,364 6.3 2,241 2,661 57.8 19.4 40.5
Mauritius 9,724 4.2 7,591 13,697 0.2 803 2.9 5,098 6,202 37.2 21.1 ..
Mozambique 9,586 7.2 410 942 0.9 1,980 12.7 2,421 4,144 15.7 11.6 45.7
Namibia 12,170 4.8 5,331 6,475 3.3 .. 4.5 4,738 4,603 22.5 13.9 ..
Niger 5,549 8.8 358 728 0.9 561 0.8 .. .. 21.1 15.1 34.6
Nigeria 202,523 8.7 1,278 2,399 1.0 5,582 13.7 74,610 61,486 3.3 10.2 48.8
Rwanda 5,628 7.5 530 1,163 1.4 595 2.3 610 1,524 52.4 13.2 50.8
São Tomé & Principe 197 4.5 1,193 1,899 .. 49 12.9 .. .. 94.6 29.8 ..
Senegal 12,855 4.1 1,034 1,935 1.6 2,591 1.3 3,186 5,530 28.6 22.4 ..
Sierra Leone 1,905 4.9 325 827 2.3 432 16.6 326 563 .. .. ..
Somalia .. .. .. .. .. 3,656 .. .. .. .. .. ..
South Africa 363,910 2.8 7,280 10,565 1.2 44,196 4.3 99,399 100,119 8.7 5.8 63.1
Sudan 62,046 4.5 1,425 2,256 .. 37,205 13.0 12,264 11,729 5.6 14.9 35.3
Swaziland 3,698 2.0 3,502 5,952 3.4 592 4.5 2,027 2,522 21.1 20.5 51.5
Tanzania 22,915 7.0 524 1,434 1.0 4,947 6.2 5,975 8,653 31.9 10.0 37.6
Togo 3,153 3.4 523 998 1.8 392 1.8 1,048 1,561 15.0 15.7 ..
Uganda 17,011 5.2 509 1,272 1.7 1,100 4.0 4,087 5,833 66.8 12.4 44.3
Zambia 16,193 7.6 1,253 1,562 1.7 1,561 8.5 7,142 5,672 5.9 4.7 ..
Zimbabwe 7,476 9.0 595 .. 1.3 6,001 24,411.0 3,608 5,831 20.1 18.8 ..
www.bread.org/institute I 2013 Hunger Report 183
- 3. Table 1
Demographics and Economic Indicators
Life Human
expectancy development Employment Remittances
Population 2010 2010 ranking 2011 2010 2010 Migration 2010
human employment workers'
development to pop. ratio remittances & refugee pop. refugee pop.
ages density life exp. index (1-187, (% of total compensation net migration by country by country
0-14 growth (per sq. rural urban at birth 1 is most pop. above received (number of or territory of or territory of
total (%) (%) km) (%) (%) (years) developed) age 15) (current US$) people) origin asylum
MIDDLE EAST &
NORTH AFRICA 382,803,000 30.5 2.0 34.1 38.4 61.6 72.5 .. 43.1 36,434,090,437 -1,628,351 1,908,927 7,829,105
Algeria 35,468,000 27.0 1.5 14.9 33.5 66.5 72.9 96 38.6 2,044,433,960 -140,000 6,689 94,144
Bahrain 1,262,000 20.0 7.6 1,660.5 11.4 88.6 75.0 42 64.9 .. 447,856 87 165
Djibouti 889,000 35.8 1.9 38.4 11.9 88.1 57.5 165 .. 32,693,661 0 566 15,104
Egypt, Arab Rep. 81,121,000 31.5 1.7 81.5 57.2 42.8 73.0 113 44.2 7,725,175,781 -346,922 6,913 95,056
Iran, Islamic Rep. 73,973,000 22.9 1.1 45.4 30.5 69.5 72.8 88 39.8 1,181,087,280 -185,650 68,791 1,073,366
Iraq 32,031,000 43.2 3.0 73.7 33.6 66.4 68.5 132 33.5 71,000,000 -150,021 1,683,579 34,655
Israel 7,624,000 27.2 1.8 352.3 8.3 91.7 81.5 17 53.5 1,411,300,049 273,635 1,301 25,471
Jordan 6,047,000 37.5 2.2 68.1 21.5 78.5 73.3 95 36.0 3,640,563,477 202,919 2,254 2,455,710
Kuwait 2,736,000 26.7 3.4 153.5 1.6 98.4 74.6 63 66.2 .. 277,629 988 184
Lebanon 4,227,000 24.8 0.7 413.2 12.8 87.2 72.4 71 41.7 7,558,138,672 -12,500 15,869 435,120
Libya 6,355,000 30.4 1.5 3.6 22.1 77.9 74.8 64 49.2 17,336,779 -20,300 2,309 7,923
Morocco 31,951,000 28.0 1.0 71.6 43.3 56.7 71.9 130 45.0 6,422,542,480 -675,000 2,284 792
Oman 2,783,000 27.2 2.6 9.0 28.3 71.7 73.1 89 54.9 39,011,703 153,003 63 78
Qatar 1,759,000 13.5 9.6 151.8 4.2 95.8 78.1 37 85.8 .. 857,090 112 51
Saudi Arabia 27,448,000 30.3 2.4 12.8 16.4 83.6 73.9 56 47.3 236,479,996 1,055,517 667 582
Syrian Arab
Republic 20,447,000 36.9 2.0 111.3 45.1 54.9 75.7 119 38.8 1,645,645,874 -55,877 18,452 1,483,172
Tunisia 10,549,000 23.5 1.0 67.9 32.7 67.3 74.6 94 40.7 1,970,210,693 -20,000 2,174 89
United Arab Emirates 7,512,000 17.0 7.9 89.9 22.0 78.0 76.6 30 75.9 .. 3,076,634 424 538
West Bank & Gaza 4,152,000 42.5 2.7 689.7 27.9 72.1 72.6 .. 30.7 1,151,141,602 -90,000 93,323 1,910,677
Yemen, Rep. 24,053,000 44.2 3.1 45.6 68.2 31.8 65.0 154 41.5 1,239,756,958 -135,000 2,076 190,092
SOUTH ASIA 1,633,146,000 31.5 1.4 342.3 69.9 30.1 65.3 .. 54.9 82,209,207,709 -8,622,263 3,344,561 2,411,160
Afghanistan 34,385,000 46.4 2.8 52.7 75.2 24.8 48.3 172 45.1 .. -381,030 3,054,709 6,434
Bangladesh 148,692,000 31.3 1.1 1,142.3 71.9 28.1 68.6 146 67.9 10,851,938,480 -2,908,015 10,049 229,253
Bhutan 726,000 29.4 1.7 18.9 63.2 36.8 66.9 141 68.4 4,800,000 16,829 75,070 ..
India 1,224,615,000 30.6 1.4 411.9 69.9 30.1 65.1 134 53.6 54,034,710,940 -2,999,998 17,769 184,821
Maldives 316,000 26.6 1.3 1,053.3 59.5 40.5 76.6 109 57.2 4,086,170 -53 19 ..
Nepal 29,959,000 36.2 1.8 209.0 81.8 18.2 68.4 157 82.2 3,468,471,924 -100,000 5,889 89,808
Pakistan 173,593,000 35.4 1.8 225.2 63.0 37.0 65.2 145 50.5 9,690,000,000 -1,999,998 39,982 1,900,621
Sri Lanka 20,860,000 24.9 0.9 332.6 84.9 15.1 74.7 97 52.2 4,155,200,195 -249,998 141,074 223
EAST ASIA & PACIFIC 2,201,536,674 21.3 0.7 90.5 51.2 48.8 73.3 .. 68.6 112,839,259,861 -5,221,061 1,003,148 519,221
Australia 22,299,000 19.0 1.6 2.9 10.9 89.1 81.7 2 62.1 4,840,000,000 1,124,639 37 21,805
Brunei Darussalam 399,000 26.2 1.8 75.7 24.3 75.7 77.9 33 63.3 .. 3,500 1 ..
Cambodia 14,139,000 31.9 1.1 80.1 77.2 22.8 62.5 139 81.4 369,458,008 -254,942 16,314 129
China 1,338,300,000 19.5 0.5 143.5 55.1 44.9 73.3 101 71.1 53,038,459,056 -1,884,102 199,684 300,986
Fiji 860,000 29.0 1.0 47.1 46.6 53.4 69.2 100 57.0 183,337,280 -28,754 1,851 1
Hong Kong SAR,
China 7,068,000 11.5 0.9 6,783.1 .. 100.0 82.9 13 56.5 347,013,001 176,125 17 154
Indonesia 239,870,000 27.0 1.0 132.4 46.3 53.7 68.9 124 62.6 6,916,051,270 -1,293,089 16,892 811
Japan 127,451,000 13.4 -0.1 349.7 33.2 66.8 82.9 12 57.3 1,802,311,523 270,000 152 2,586
Kiribati 100,000 .. 1.5 123.5 56.0 44.0 .. 122 .. .. .. 33 ..
Korea, Dem. Rep. 24,346,000 22.9 0.4 202.2 36.6 63.4 68.5 .. 74.0 .. 0 917 ..
Korea, Rep. 48,875,000 16.4 0.3 503.3 18.1 81.9 80.8 15 58.0 8,707,900,391 -30,000 585 358
Lao PDR 6,201,000 34.5 1.4 26.9 66.8 33.2 67.1 138 77.0 40,854,836 -74,998 8,414 ..
Macao SAR, China 544,000 13.1 2.3 19,428.6 .. 100.0 80.8 .. 69.4 835,145,813 50,625 10 6d
Malaysia 28,401,000 30.3 1.6 86.4 27.8 72.2 74.0 61 58.5 1,300,503,174 84,494 552 81,516
Mongolia 2,756,000 27.6 1.6 1.8 42.5 57.5 68.2 110 56.9 276,518,585 -15,001 1,724 12
Myanmar 47,963,000 25.6 0.8 73.4 66.1 33.9 64.7 149 75.7 132,994,507 -500,000 415,670 ..
New Zealand 4,368,000 20.5 1.2 16.6 13.2 86.8 80.7 5 63.2 842,555,725 65,004 15 2,307
184 Table 1 – Demographics and Economic Indicators I Bread for the World Institute
- 4. Table 1
Demographics and Economic Indicators
Military spending Debt & inflation Exports & imports of goods Exports & imports Income inequality
Gross domestic product (GDP) 2009-2010 2007-2010 2010 and services 2007-2010 of food 2007-2010 2007-2010
value of exports imports GINI index (0 is
per capita per capita external debt inflation, exports imports (% of (% of perfect equality
GDP (current growth (current PPP (current % of gov't (current consumer (current (current merchan- merchan- & 100 is perfect
million US$) (%) US$) int'l $) spending million US$) prices (%) million US$) million US$) dise) dise) inequality)
MIDDLE EAST &
NORTH AFRICA 2,476,140 3.8 6,468 10,562 5.9 123,417 .. 1,167,428 921,446 2.6 12.9 ..
Algeria 161,979 3.3 4,567 8,433 3.5 4,687 3.9 49,939 34,820 0.6 16.3 ..
Bahrain 20,595 6.3c 17,609 25,799c 3.7 .. 2.0 21,213 16,277 7.2 11.9 ..
Djibouti 1,049 5.0 1,203 2,308 3.7 500 4.0 484 654 0.4 29.3 ..
Egypt, Arab Rep. 218,894 5.1 2,698 6,180 2.0 28,793 11.3 46,732 57,200 17.2 19.1 30.8
Iran, Islamic Rep. 331,015 1.8 4,526 11,570 1.9 10,954 10.1 92,050 61,612 6.2 15.4 ..
Iraq 82,150 0.8 2,565 3,562 6.0 .. 2.9 .. .. 0.0 .. 30.9
Israel 217,333 4.7 28,506 28,573 6.5 .. 2.7 80,334 75,897 3.0 7.3 ..
Jordan 27,574 3.1 4,560 5,749 5.2 6,672 5.0 12,279 18,175 16.6 16.2 35.4
Kuwait 109,463 4.4b 41,365 52,657b 4.0 .. 4.0 61,699 30,681 0.3 14.7 ..
Lebanon 39,006 7.0 9,228 14,069 4.2 23,420 4.0 8,170 17,079 14.9 16.3 ..
Libya 62,360 2.1 9,957 16,987 1.2 .. 2.5 62,780 25,589 .. .. ..
Morocco 90,805 3.7 2,796 4,712 3.5 20,820 1.0 29,966 38,970 19.0 11.4 40.9
Oman 46,866 1.1 17,280 26,791 9.6 .. 3.2 24,671 19,443 3.0 12.3 ..
Qatar 98,313 8.6 61,532 80,944 2.3 .. -2.4 45,958 30,692 0.0 8.2 41.1
Saudi Arabia 434,666 3.8 15,836 22,713 10.4 .. 5.3 246,867 154,027 1.2 15.7 ..
Syrian Arab
Republic 59,147 3.2 2,893 5,285 3.9 4,294 4.4 20,895 21,148 22.0 14.0 ..
Tunisia 44,291 3.7 4,199 9,550 1.2 19,307 4.4 21,575 23,928 7.7 9.3 ..
United Arab Emirates 297,648 1.4 39,623 47,213 5.4 .. .. 231,978 204,663 0.8 6.6 ..
West Bank & Gaza .. .. .. .. .. .. 2.8 .. .. .. .. 35.5
Yemen, Rep. 31,270 8.0 1,300 2,653 4.4 3,971 11.2 9,462 10,737 5.7 27.8 ..
SOUTH ASIA 2,090,279 8.1 1,280 3,123 2.4 331,209 .. 426,927 509,973 11.7 6.9 ..
Afghanistan 17,243 8.2 501 1,207 1.8 721 0.9 2,670 9,236 40.0 13.7 27.8
Bangladesh 100,357 6.1 675 1,659 1.2 15,886 8.1 18,472 25,106 6.5 22.5 32.1
Bhutan 1,516 7.4 2,088 5,328 .. 714 2.0 819 910 7.2 11.5 38.1
India 1,727,111 8.8 1,410 3,425 2.4 252,804 12.0 371,979 427,997 8.3 4.0 ..
Maldives 1,908 9.9 6,039 8,519 .. 1,020 4.7 949 1,284 96.2 22.4 ..
Nepal 15,722 4.6 525 1,199 1.5 2,752 10.0 1,533 5,825 19.1 13.6 32.8
Pakistan 176,870 4.1 1,019 2,688 3.2 41,425 13.9 23,971 33,189 16.8 13.1 30.0
Sri Lanka 49,552 8.0 2,375 5,078 2.8 15,887 5.9 10,747 15,273 26.9 15.4 40.3
EAST ASIA & PACIFIC 16,253,227 6.6 7,383 9,674 1.7 932,277 .. 5,498,536 5,001,758 4.8 6.2 ..
Australia 1,131,623 2.3 50,748 38,160 2.0 .. 2.8 223,838 227,341 11.3 5.4 ..
Brunei Darussalam 10,732 -1.8 27,390 49,935 3.1 .. 0.4 11,270 3,975 .. .. ..
Cambodia 11,242 6.0 795 2,194 1.8 3,652 4.0 6,080 6,692 1.4 7.3 37.9
China 5,926,612 10.4 4,428 7,599 2.0 522,861 3.3 1,752,600 1,520,500 2.8 4.6 ..
Fiji 3,189 0.3 3,708 4,658 1.7 403 5.5 1,676 2,055 63.0 18.4 42.8
Hong Kong SAR,
China 224,458 7.0 31,757 46,502 .. .. 2.3 500,452 487,857 6.8 4.2 ..
Indonesia 706,558 6.1 2,946 4,325 1.0 159,754 5.1 173,899 162,350 16.4 8.5 ..
Japan 5,458,837 4.0 42,831 33,733 1.0 .. -0.7 830,620 768,048 0.6 9.2 ..
Kiribati 151 1.8 1,512 2,457 .. .. .. .. .. .. 42.3 ..
Korea, Dem. Rep. .. .. .. .. .. .. .. .. .. .. .. ..
Korea, Rep. 1,014,483 6.2 20,757 29,101 2.7 .. 2.9 531,504 503,206 1.1 4.5 ..
Lao PDR 7,296 8.5 1,177 2,551 0.3 3,959 6.0 2,651 2,984 .. .. 36.7
Macao SAR, China 27,960 26.4 51,397 63,681 .. .. 2.8 29,895 13,928 0.2 17.1 ..
Malaysia 237,797 7.2 8,373 14,731 1.5 75,406 1.7 231,385 189,031 11.9 7.9 46.2
Mongolia 6,200 6.4 2,250 4,036 0.9 1,697 10.1 3,392 3,866 1.7 11.8 36.5
Myanmar .. 10.4 .. 1,950 .. 4,206 7.7 .. .. .. .. ..
New Zealand 126,679 -0.5 29,352 29,535 1.1 .. 2.9 35,362 33,518 55.7 10.6 ..
www.bread.org/institute I 2013 Hunger Report 185
- 5. Table 1
Demographics and Economic Indicators
Life Human
expectancy development Employment Remittances
Population 2010 2010 ranking 2011 2010 2010 Migration 2010
human employment workers'
development to pop. ratio remittances & refugee pop. refugee pop.
ages density life exp. index (1-187, (% of total compensation net migration by country by country
0-14 growth (per sq. rural urban at birth 1 is most pop. above received (number of or territory of or territory of
total (%) (%) km) (%) (%) (years) developed) age 15) (current US$) people) origin asylum
CONTINUED: EAST ASIA & PACIFIC
Papua New Guinea 6,858,000 39.1 2.3 15.1 87.5 12.5 62.4 153 70.5 14,952,318 0 89 9,698
Philippines 93,261,000 35.4 1.7 312.8 33.6 66.4 68.5 112 59.6 21,423,000,000 -1,233,365 970 243
Samoa 184,000 37.8 0.4 65.0 76.6 23.4 72.3 99 .. 143,446,518 -15,738 1 ..
Singapore 5,077,000 17.4 1.8 7,252.9 .. 100.0 81.6 26 63.1 .. 721,738 76 7
Solomon Islands 538,000 39.7 2.6 19.2 81.4 18.6 67.5 142 64.4 2,906,775 0 75 ..
Thailand 69,122,000 20.5 0.6 135.3 66.0 34.0 73.9 103 71.0 1,763,508,789 492,252 356 96,675
Timor-Leste 1,124,000 46.2 2.2 75.6 71.9 28.1 62.0 147 54.4 .. -49,930 8 1
Tuvalu 9,827 .. 0.2 327.6 49.6 50.4 .. .. .. .. .. .. ..
Vanuatu 240,000 38.2 2.5 19.7 74.4 25.6 70.8 125 .. 6,427,849 0 1 4
Vietnam 86,928,000 23.6 1.0 280.3 71.2 28.8 74.8 128 75.2 8,260,000,000 -430,692 338,698 1,928
EUROPE &
CENTRAL ASIA 890,424,544 17.4 0.4 32.5 30.0 70.0 75.7 .. 52.9 132,457,502,167 -595,318 708,333 1,610,871
Albania 3,205,000 22.7 0.4 117.0 52.0 48.0 76.9 70 51.8 1,156,021,729 -47,889 14,772 76
Armenia 3,092,000 20.2 0.2 108.6 36.3 63.7 73.8 86 41.2 995,770,020 -75,000 17,547 3,296
Austria 8,390,000 14.7 0.3 101.8 32.4 67.6 80.4 19 57.9 3,219,852,295 160,000 10 42,630
Azerbaijan 9,054,000 20.9 1.2 109.6 47.8 52.2 70.5 91 60.3 1,432,385,986 53,264 16,753 1,891
Belarus 9,490,000 15.0 -0.2 46.8 25.7 74.3 70.4 65 50.1 376,100,006 -50,010 5,743 589
Belgium 10,896,000 16.9 0.9 359.8 2.6 97.4 79.9 18 49.5 10,178,155,270 200,000 83 17,892
Bosnia & Herzegovina 3,760,000 15.0 -0.2 73.7 51.4 48.6 75.4 74 35.1 1,905,236,450 -10,000 63,004 7,016
Bulgaria 7,534,000 13.7 -0.7 69.4 28.3 71.7 73.5 55 48.5 1,387,347,412 -50,000 2,559 5,530
Croatia 4,418,000 15.0 -0.3 78.9 42.2 57.8 76.5 46 46.3 1,314,627,808 10,000 65,861 936
Cyprus 1,103,000 17.8 1.2 119.4 29.7 70.3 79.4 31 60.4 145,741,470 44,166 13 3,394
Czech Republic 10,520,000 14.0 0.3 136.2 26.5 73.5 77.4 27 54.2 1,122,078,491 240,466 817 2,449
Denmark 5,547,000 18.0 0.4 130.7 12.8 87.2 79.1 16 59.8 633,061,462 90,316 9 17,922
Estonia 1,340,000 15.3 0.0 31.6 30.5 69.5 75.4 34 51.1 322,176,605 0 240 39
Finland 5,364,000 16.5 0.5 17.7 36.1 63.9 79.9 22 55.2 825,921,448 72,634 6 8,724
France 64,895,000 18.4 0.5 118.5 22.2 77.8 81.4 20 51.2 15,629,349,610 500,001 92 200,687
Georgia 4,452,000 16.6 0.9 77.9 47.1 52.9 73.3 75 53.5 806,076,233 -150,000 10,640 639
Germany 81,777,000 13.5 -0.2 234.6 26.2 73.8 80.0 9 55.4 11,337,656,250 550,001 164 594,269
Greece 11,316,000 14.6 0.3 87.8 38.6 61.4 80.4 29 47.7 1,499,203,125 154,004 51 1,444
Hungary 10,000,000 14.7 -0.2 110.5 31.7 68.3 74.2 38 45.0 2,265,384,766 75,000 1,438 5,414
Iceland 318,000 20.8 -0.1 3.2 7.7 92.3 81.5 14 68.8 24,871,115 10,417 4 83
Ireland 4,475,000 21.2 0.3 65.0 38.1 61.9 80.3 7 52.2 600,524,719 100,000 8 9,107
Italy 60,483,000 14.1 0.5 205.6 31.6 68.4 81.7 24 44.3 6,803,214,844 1,998,926 50 56,397
Kazakhstan 16,323,000 24.5 1.4 6.0 41.5 58.5 68.3 68 67.2 290,637,909 6,990 3,632 4,406
Kosovo 1,815,000 .. 0.6 166.7 .. .. 69.9 .. .. 931,575,989 .. .. ..
Kyrgyz Republic 5,448,000 30.0 1.2 28.4 63.4 36.6 69.4 126 60.5 1,275,425,171 -131,593 2,744 2,458
Latvia 2,239,000 13.8 -0.7 36.0 31.8 68.2 73.5 43 48.7 613,500,000 -10,000 713 68
Lithuania 3,287,000 14.9 -1.6 52.4 32.8 67.2 73.3 40 47.9 1,574,935,669 -35,495 515 803
Luxembourg 507,000 17.7 1.8 195.8 17.8 82.2 80.1 25 54.6 1,586,062,500 42,469 2b 3,254
Macedonia, FYR 2,060,000 17.6 0.2 81.7 32.1 67.9 74.6 78 37.9 387,898,712 2,000 7,889 1,398
Malta 416,000 15.0 0.5 1,300.0 5.3 94.7 80.9 36 47.7 47,571,472 5,000 6 6,136
Moldova 3,562,000 16.7 -0.1 124.0 58.8 41.2 68.9 111 38.0 1,369,910,034 -171,748 6,200 148
Montenegro 632,000 19.2 0.2 47.0 40.5 59.5 74.3 54 .. 300,786,011 -2,508 3,246 16,364
Netherlands 16,616,000 17.7 0.5 492.6 17.1 82.9 80.7 3 61.9 3,834,185,547 50,006 53 74,961
Norway 4,889,000 18.7 1.2 16.0 22.4 77.6 81.0 1 63.5 679,971,558 171,232 7 40,260
Poland 38,184,000 14.8 0.1 125.5 38.8 61.2 76.2 39 50.5 7,614,000,000 55,644 1,764 15,555
Portugal 10,638,000 15.1 0.0 116.3 39.3 60.7 79.0 41 55.3 3,539,504,395 150,002 30 384
Romania 21,438,000 15.2 -0.2 93.2 45.4 54.6 73.5 50 51.9 3,883,000,000 -100,000 3,934 1,021
Russian Federation 141,750,000 15.0 -0.1 8.7 27.2 72.8 68.8 66 58.0 5,263,660,156 1,135,737 111,948 4,922
186 Table 1 – Demographics and Economic Indicators I Bread for the World Institute
- 6. Table 1
Demographics and Economic Indicators
Military spending Debt & inflation Exports & imports of goods Exports & imports Income inequality
Gross domestic product (GDP) 2009-2010 2007-2010 2010 and services 2007-2010 of food 2007-2010 2007-2010
value of exports imports GINI index (0 is
per capita per capita external debt inflation, exports imports (% of (% of perfect equality
GDP (current growth (current PPP (current % of gov't (current consumer (current (current merchan- merchan- & 100 is perfect
million US$) (%) US$) int'l $) spending million US$) prices (%) million US$) million US$) dise) dise) inequality)
CONTINUED: EAST ASIA & PACIFIC
Papua New Guinea 9,480 8.0 1,382 2,472 0.5 4,580 6.0 5,295 5,032 .. .. ..
Philippines 199,589 7.6 2,140 3,969 0.8 62,514 3.8 69,464 73,082 7.4 11.1 43.0
Samoa 574 1.7 3,117 4,374 .. 174 0.8 183 337 21.0 24.5 ..
Singapore 208,765 14.5 41,120 57,932 3.8 .. 2.8 440,628 382,051 2.0 3.2 ..
Solomon Islands 679 7.0 1,261 2,710 .. 148 1.1 211 418 .. .. ..
Thailand 318,522 7.8 4,608 8,554 1.5 66,153 3.3 226,949 203,499 13.2 5.0 40.0
Timor-Leste 701 7.4 624 928 2.8 .. 6.8 .. .. .. .. 31.9
Tuvalu 31 -1.9 3,190 .. .. .. .. .. .. .. 21.5 ..
Vanuatu 699 3.0 2,911 4,443 .. 113 2.8 331 375 61.5 21.3 ..
Vietnam 106,427 6.8 1,224 3,205 2.2 26,565 8.9 82,513 93,449 21.0 7.9 35.6
EUROPE &
CENTRAL ASIA 20,076,254 2.4 22,547 24,437 1.9 1,135,629 .. 7,926,140 7,591,370 8.4 8.8 ..
Albania 11,786 3.5 3,677 8,592 1.6 3,616 3.6 3,509 6,100 4.5 17.9 34.5
Armenia 9,371 2.1 3,031 5,463 4.5 4,687 8.2 1,929 4,197 16.7 18.0 30.9
Austria 379,069 2.3 45,181 40,006 0.9 .. 1.8 204,589 188,257 6.9 7.3 ..
Azerbaijan 51,774 5.0 5,718 9,936 2.9 3,894 5.7 28,541 10,543 2.8 18.5 33.7
Belarus 54,713 7.6 5,765 13,929 1.3 23,088 7.7 29,886 37,385 12.6 7.9 27.2
Belgium 469,374 2.3 43,078 37,631 1.1 .. 2.2 375,540 362,862 8.8 8.5 ..
Bosnia & Herzegovina 16,578 0.8 4,409 8,690 1.4 6,716 2.2 5,955 9,407 7.3 18.1 36.2
Bulgaria 47,714 0.2 6,333 13,931 1.4 44,915 2.4 27,578 28,486 16.1 9.6 28.2
Croatia 60,852 -1.2 13,774 19,330 1.7 .. 1.0 23,320 23,630 11.3 10.4 33.7
Cyprus 23,132 1.0 28,779 31,706 2.2 .. 2.4 9,279 10,770 34.3 14.8 ..
Czech Republic 192,032 2.3 18,254 24,518 1.3 .. 1.4 152,308 143,151 3.9 5.4 ..
Denmark 311,989 1.3 56,245 40,163 1.4 .. 2.3 157,011 140,584 18.4 13.5 ..
Estonia 19,217 3.1 14,341 20,663 1.7 .. 3.0 15,040 13,756 9.8 11.3 ..
Finland 238,041 3.7 44,378 36,473 1.5 .. 1.2 96,216 93,110 2.6 7.1 ..
France 2,560,002 1.5 39,448 34,123 2.3 .. 1.5 651,858 711,918 12.0 8.5 ..
Georgia 11,667 6.4 2,621 5,074 3.9 7,536 7.1 4,060 6,101 21.9 18.2 41.3
Germany 3,280,530 3.7 40,116 37,402 1.4 .. 1.1 1,536,159 1,356,755 5.2 7.1 ..
Greece 301,083 -3.5 26,607 28,408 3.1 .. 4.7 64,742 91,469 24.3 12.4 ..
Hungary 128,632 1.3 12,863 20,545 1.0 .. 4.9 111,324 102,962 7.5 4.8 31.2
Iceland 12,574 -4.0 39,542 35,642 0.1 .. 5.4 7,046 5,784 41.4 10.9 ..
Ireland 206,612 -0.4 46,170 40,464 0.6 .. -0.9 208,838 169,405 9.2 12.3 ..
Italy 2,060,965 1.5 34,075 31,954 1.8 .. 1.5 549,396 588,751 7.9 9.2 ..
Kazakhstan 149,059 7.3 9,132 12,169 0.9 101,695 7.1 65,519 43,547 3.8 8.5 29.0
Kosovo 5,552 4.0 3,059 .. .. 241 3.5 1,074 3,450 .. .. ..
Kyrgyz Republic 4,616 -1.4 847 2,239 3.6 1,750 8.0 2,666 4,116 30.0 16.9 36.2
Latvia 24,010 -0.3 10,723 16,276 1.1 36,684 -1.1 12,814 13,014 16.8 14.7 36.6
Lithuania 36,306 1.3 11,045 18,148 1.3 27,225 1.3 24,768 25,273 17.3 12.4 37.6
Luxembourg 53,334 2.7 105,195 86,124 0.6 .. 2.3 87,994 71,360 8.3 11.2 ..
Macedonia, FYR 9,189 1.8 4,461 11,311 1.5 5,289 1.6 4,348 6,060 18.2 13.2 43.2
Malta 8,256 3.1 19,845 26,618 0.7 .. 1.5 7,030 6,886 8.3 13.3 ..
Moldova 5,809 6.9 1,631 3,110 0.3 4,076 7.4 2,300 4,544 72.0 14.9 33.0
Montenegro 4,111 2.5 6,505 12,861 1.3 1,331 0.7 1,462 2,615 .. .. 30.0
Netherlands 779,356 1.7 46,904 42,165 1.4 .. 1.3 608,273 550,087 13.5 10.0 ..
Norway 417,465 0.7 85,389 57,231 1.6 .. 2.4 171,764 120,046 7.2 7.9 ..
Poland 469,440 3.9 12,294 19,885 1.9 .. 2.7 198,463 204,134 10.8 7.6 34.1
Portugal 228,571 1.4 21,486 25,416 2.2 .. 1.4 70,934 87,329 11.4 13.4 ..
Romania 161,624 0.9 7,539 14,524 1.4 101,112 6.1 37,960 48,095 8.1 7.7 30.0
Russian Federation 1,479,819 4.0 10,440 19,891 4.0 347,210 6.9 444,609 321,183 2.0 13.1 40.1
www.bread.org/institute I 2013 Hunger Report 187
- 7. Table 1
Demographics and Economic Indicators
Life Human
expectancy development Employment Remittances
Population 2010 2010 ranking 2011 2010 2010 Migration 2010
human employment workers'
development to pop. ratio remittances & refugee pop. refugee pop.
ages density life exp. index (1-187, (% of total compensation net migration by country by country
0-14 growth (per sq. rural urban at birth 1 is most pop. above received (number of or territory of or territory of
total (%) (%) km) (%) (%) (years) developed) age 15) (current US$) people) origin asylum
CONTINUED: EUROPE & CENTRAL ASIA
Serbia 7,291,000 17.6 -0.4 83.4 47.6 52.4 73.9 59 37.9 3,350,849,121 0 183,289 73,608
Slovak Republic 5,430,000 15.1 0.2 112.9 43.2 56.8 75.1 35 50.6 1,591,283,813 36,684 158 461
Slovenia 2,049,000 13.9 0.4 101.7 52.0 48.0 79.4 21 54.7 308,659,241 22,000 38 314
Spain 46,071,000 15.0 0.4 92.4 22.6 77.4 81.6 23 47.4 10,506,896,480 2,250,005 42 3,820
Sweden 9,378,000 16.5 0.9 22.9 15.3 84.7 81.5 10 58.4 687,751,282 265,649 25 82,629
Switzerland 7,826,000 15.2 1.1 195.7 26.4 73.6 82.2 11 64.9 2,619,164,307 182,803 19 48,813
Tajikistan 6,879,000 37.0 1.4 49.1 73.5 26.5 67.3 127 58.1 2,254,454,346 -296,075 577 3,131
Turkey 72,752,000 26.4 1.3 94.5 30.4 69.6 73.7 92 43.6 874,000,000 -50,000 146,794 10,032
Turkmenistan 5,042,000 29.2 1.2 10.7 50.5 49.5 64.9 102 54.0 .. -54,499 738 62
Ukraine 45,871,000 14.2 -0.4 79.2 31.9 68.1 70.3 76 54.1 5,607,000,000 -40,006 25,111 3,022
United Kingdom 62,232,000 17.4 0.7 257.2 9.9 90.1 80.4 28 57.1 7,531,632,813 1,020,211 153 238,150
Uzbekistan 28,228,000 29.4 1.6 66.4 63.1 36.9 68.0 115 54.0 .. -518,486 8,840 311
LATIN AMERICA
& CARIBBEAN 589,011,026 27.9 1.1 29.2 20.7 79.3 74.1 .. 61.5 57,533,017,261 -5,087,610 470,690 373,865
Argentina 40,412,000 24.9 0.9 14.8 7.6 92.4 75.6 45 56.1 641,068,909 -199,997 557 3,276
Bahamas, The 343,000 22.5 1.3 34.3 15.9 84.1 75.2 53 64.2 .. 6,440 17 28
Belize 345,000 35.0 3.4 15.1 47.3 52.7 75.8 93 59.3 79,530,121 -972 23 134
Bolivia 9,929,000 36.1 1.6 9.2 33.5 66.5 66.3 108 68.5 1,087,993,286 -165,177 590 695
Brazil 194,946,000 25.5 0.9 23.0 13.5 86.5 73.1 84 64.8 3,999,748,291 -499,999 994 4,357
Chile 17,113,688 22.1 0.9 23.0 11.0 89.0 78.9 44 55.4 3,200,000 30,000 1,170 1,621
Colombia 46,295,000 28.7 1.4 41.7 24.9 75.1 73.4 87 59.2 4,057,982,666 -120,000 395,577 212
Costa Rica 4,659,000 24.9 1.5 91.2 35.7 64.3 79.2 69 59.7 551,821,838 75,600 352 19,505
Cuba 11,258,000 17.3 0.0 105.8 24.3 75.7 79.0 51 55.7 .. -190,123 7,477 411
Dominican Republic 9,927,000 31.0 1.3 205.4 29.5 70.5 73.2 98 55.5 3,368,619,629 -140,000 246 599
Ecuador 14,465,000 30.3 1.4 58.2 33.1 66.9 75.5 83 63.8 2,568,698,486 -120,000 852 121,249
El Salvador 6,193,000 32.0 0.5 298.9 38.7 61.3 71.7 105 57.4 3,449,360,107 -291,710 4,976 38
Guatemala 14,389,000 41.5 2.5 134.3 50.5 49.5 70.8 131 65.3 4,229,200,195 -200,000 5,679 138
Guyana 755,000 33.6 0.2 3.8 71.5 28.5 69.5 117 53.4 308,397,217 -40,000 749 7
Haiti 9,993,000 35.9 1.3 362.6 50.4 49.6 61.8 158 59.7 1,498,662,964 -239,997 25,892 3d
Honduras 7,600,000 36.8 2.0 67.9 51.2 48.8 72.8 121 60.3 2,649,150,146 -100,000 1,302 14
Jamaica 2,702,000 29.1 0.2 249.5 46.3 53.7 72.8 79 55.9 2,011,033,691 -100,000 1,057 21
Mexico 113,423,000 29.1 1.2 58.3 22.2 77.8 76.7 57 58.4 22,047,560,550 -1,805,238 6,816 1,395
Nicaragua 5,789,000 34.5 1.4 48.1 42.7 57.3 73.7 129 59.7 822,799,988 -200,000 1,431 64
Panama 3,517,000 29.0 1.6 47.3 25.2 74.8 76.0 58 61.7 231,199,997 11,000 100 17,073
Paraguay 6,454,000 33.5 1.8 16.2 38.5 61.5 72.3 107 68.5 672,984,985 -40,000 86 107
Peru 29,076,000 30.0 1.1 22.7 28.4 71.6 73.8 80 71.1 2,533,910,889 -724,999 5,834 1,146
Suriname 525,000 28.6 0.9 3.4 24.4 75.6 70.3 104 47.2 4,300,000 -4,998 25 1
Trinidad & Tobago 1,341,000 20.6 0.4 261.4 86.1 13.9 69.8 62 62.8 119,937,508 -19,806 255 29
Uruguay 3,357,000 22.5 0.3 19.2 7.5 92.5 76.2 48 61.1 102,876,999 -50,000 186 189
Venezuela, RB 28,834,000 29.5 1.6 32.7 6.0 94.0 74.1 73 61.0 143,000,000 40,000 6,701 201,547
NORTH AMERICA 343,539,600 19.7 0.9 18.8 17.9 82.1 78.5 .. 57.9 6,622,457,031 6,053,368 3,116 430,123
Canada 34,126,000 16.4 1.2 3.8 19.4 80.6 80.8 6 61.3 .. 1,098,444 90 165,549
United States 309,349,000 20.1 0.8 33.8 17.7 82.3 78.2 4 57.5 5,277,000,000 4,954,924 3,026 264,574
.. Data not availble.
0 Zero, or rounds to zero at the displayed number of decimal places.
a Data refers to 2006
b Data refers to 2007
c Data refers to 2008
d Data refers to 2009
e Data refers to 2010
f Data refers to 2011
Note: South Sudan is not included due to insufficient information.
Sources for tables on page 215.
188 Table 1 – Demographics and Economic Indicators I Bread for the World Institute
- 8. Table 1
Demographics and Economic Indicators
Military spending Debt & inflation Exports & imports of goods Exports & imports Income inequality
Gross domestic product (GDP) 2009-2010 2007-2010 2010 and services 2007-2010 of food 2007-2010 2007-2010
value of exports imports GINI index (0 is
per capita per capita external debt inflation, exports imports (% of (% of perfect equality
GDP (current growth (current PPP (current % of gov't (current consumer (current (current merchan- merchan- & 100 is perfect
million US$) (%) US$) int'l $) spending million US$) prices (%) million US$) million US$) dise) dise) inequality)
CONTINUED: EUROPE & CENTRAL ASIA
Serbia 38,423 1.0 5,270 11,349 2.2 28,351 6.1 13,407 19,747 18.6 5.8 27.8
Slovak Republic 87,268 4.2 16,071 23,303 1.1 .. 1.0 70,748 71,885 4.3 6.3 26.0
Slovenia 46,908 1.4 22,893 26,925 1.6 .. 1.8 30,690 30,425 4.1 8.0 ..
Spain 1,407,405 -0.1 30,549 32,230 1.1 .. 1.8 369,538 399,993 15.1 10.4 ..
Sweden 458,552 5.6 48,897 39,024 1.2 .. 1.2 229,301 201,579 4.7 8.7 ..
Switzerland 527,920 2.7 67,457 46,384 0.9 .. 0.7 282,724 222,841 3.8 5.8 ..
Tajikistan 5,640 3.8 820 2,163 .. 2,202 6.4 858 3,444 .. .. 30.8
Turkey 734,364 9.0 10,094 15,687 2.4 270,204 8.6 155,074 195,630 10.6 4.0 39.0
Turkmenistan 20,001 9.2 3,967 8,274 .. 380 .. 10,347 10,921 .. .. ..
Ukraine 137,929 4.2 3,007 6,721 2.7 107,452 9.4 69,224 73,069 19.2 9.2 26.4
United Kingdom 2,261,713 2.1 36,343 35,686 2.6 .. 3.3 681,233 737,999 6.3 9.7 ..
Uzbekistan 38,982 8.5 1,381 3,106 .. 5,972 .. 12,269 12,056 .. .. ..
LATIN AMERICA
& CARIBBEAN 5,123,243 6.0 8,698 11,431 1.4 987,607 .. 1,141,140 1,147,249 16.2 7.5 ..
Argentina 368,736 9.2 9,124 16,012 0.9 121,281 10.8 80,040 67,848 51.2 2.6 44.5
Bahamas, The 7,702 0.9 22,454 31,746 .. .. 1.3 3,236 3,946 25.1 17.5 ..
Belize 1,401 2.9 4,061 6,670 1.1 784 0.9 844 952 60.9 16.5 ..
Bolivia 19,650 4.1 1,979 4,849 1.6 2,999 2.5 8,093 6,745 15.0 7.9 56.3
Brazil 2,087,890 7.5 10,710 11,210 1.6 326,721 5.0 232,862 253,610 31.1 4.7 54.7
Chile 212,741 5.2 12,431 15,779 3.2 78,746 1.4 82,373 67,752 16.9 7.5 52.1
Colombia 288,886 4.0 6,240 9,453 3.7 92,182 2.3 45,400 51,791 11.9 9.7 55.9
Costa Rica 35,831 4.2 7,691 11,569 .. 8,090 5.7 13,641 14,750 34.7 9.0 50.7
Cuba 60,806c 2.1 5,397c .. 3.3 .. .. 12,506 14,806 .. .. ..
Dominican Republic 51,766 7.8 5,215 9,350 0.6 10,906 6.3 11,524 17,605 27.2 13.6 47.2
Ecuador 57,978 3.6 4,008 8,028 3.8 12,770 3.6 19,103 22,390 30.0 8.3 49.3
El Salvador 21,215 1.4 3,426 6,668 0.6 9,732 1.2 5,553 9,259 21.5 16.6 48.3
Guatemala 41,186 2.8 2,862 4,785 0.4 12,115 3.9 10,336 14,820 42.1 13.3 ..
Guyana 2,226 3.6 2,948 3,432 .. 762 2.1 .. .. 59.3 14.8 ..
Haiti 6,710 -5.1 671 1,111 .. 282 5.7 813 3,846 .. .. ..
Honduras 15,400 2.8 2,026 3,923 1.6 1,971 4.7 6,756 9,950 54.2 18.8 57.0
Jamaica 14,252 -0.6 5,275 7,673 0.8 13,246 12.6 3,642 6,166 24.6 17.7 ..
Mexico 1,035,871 5.5 9,133 14,564 0.5 178,631 4.2 313,742 328,741 6.1 6.5 48.3
Nicaragua 6,551 7.6 1,132 2,913 0.7 2,249 5.5 2,708 4,562 88.2 16.3 ..
Panama 26,689 4.8 7,589 13,608 .. 10,049 3.5 17,409 18,458 72.6 8.0 51.9
Paraguay 18,331 15.0 2,840 5,181 0.9 4,298 4.7 10,467 10,074 85.5 7.5 52.4
Peru 157,053 8.8 5,401 9,538 1.4 32,384 1.5 39,433 34,941 20.3 10.3 48.1
Suriname 3,251 3.1 6,254 7,664 .. .. 6.9 .. .. 2.4 15.2 ..
Trinidad & Tobago 20,604 0.1 15,365 25,739 .. .. 10.5 17,728 10,210 2.5 11.2 ..
Uruguay 39,051 8.5 11,633 14,108 1.5 10,234 6.7 10,493 10,200 64.3 10.1 45.3
Venezuela, RB 391,847 -1.5 13,590 12,233 0.9 55,591 29.1 112,424 67,300 0.2 15.5 ..
NORTH AMERICA 16,169,541 3.0 47,067 46,349 4.5 .. .. 2,303,992 2,851,722 10.0 5.4 ..
Canada 1,577,040 3.2 46,212 39,050 1.4 .. 1.8 464,132 493,760 10.5 7.4 ..
United States 14,586,736 3.0 47,153 47,153 4.8 .. 1.6 1,839,800 2,356,700 9.8 5.0 ..
.. Data not availble.
0 Zero, or rounds to zero at the displayed number of decimal places.
a Data refers to 2006
b Data refers to 2007
c Data refers to 2008
d Data refers to 2009
e Data refers to 2010
f Data refers to 2011
Note: South Sudan is not included due to insufficient information.
Sources for tables on page 215.
www.bread.org/institute I 2013 Hunger Report 189