Press Release Quarterly and annual revenues 2010
•
0 likes•433 views

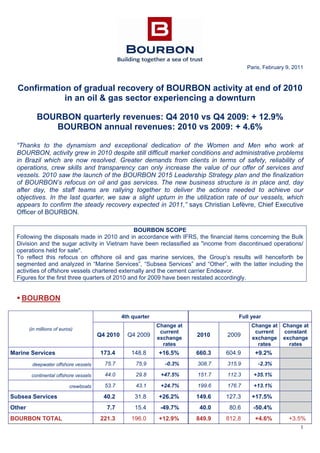
Confirmation of gradual recovery of BOURBON activity at end of 2010 in an oil & gas sector experiencing a downturn. Chiffre d’affaires 4ème trimestre BOURBON quarterly revenues: Q4 2010 vs Q4 2009: + 12.9% BOURBON annual revenues: 2010 vs 2009: + 4.6%

Recommended
Recommended
More Related Content
What's hot
What's hot (6)
Similar to Press Release Quarterly and annual revenues 2010
Similar to Press Release Quarterly and annual revenues 2010 (20)
More from BOURBON
More from BOURBON (20)
Recently uploaded
Recently uploaded (20)
Press Release Quarterly and annual revenues 2010
- 1. 1 Paris, February 9, 2011 Confirmation of gradual recovery of BOURBON activity at end of 2010 in an oil & gas sector experiencing a downturn BOURBON quarterly revenues: Q4 2010 vs Q4 2009: + 12.9% BOURBON annual revenues: 2010 vs 2009: + 4.6% “Thanks to the dynamism and exceptional dedication of the Women and Men who work at BOURBON, activity grew in 2010 despite still difficult market conditions and administrative problems in Brazil which are now resolved. Greater demands from clients in terms of safety, reliability of operations, crew skills and transparency can only increase the value of our offer of services and vessels. 2010 saw the launch of the BOURBON 2015 Leadership Strategy plan and the finalization of BOURBON’s refocus on oil and gas services. The new business structure is in place and, day after day, the staff teams are rallying together to deliver the actions needed to achieve our objectives. In the last quarter, we saw a slight upturn in the utilization rate of our vessels, which appears to confirm the steady recovery expected in 2011,” says Christian Lefèvre, Chief Executive Officer of BOURBON. BOURBON SCOPE Following the disposals made in 2010 and in accordance with IFRS, the financial items concerning the Bulk Division and the sugar activity in Vietnam have been reclassified as "income from discontinued operations/ operations held for sale". To reflect this refocus on offshore oil and gas marine services, the Group’s results will henceforth be segmented and analyzed in “Marine Services”, “Subsea Services” and “Other”, with the latter including the activities of offshore vessels chartered externally and the cement carrier Endeavor. Figures for the first three quarters of 2010 and for 2009 have been restated accordingly. BOURBON (in millions of euros) 4th quarter Full year Q4 2010 Q4 2009 Change at current exchange rates 2010 2009 Change at current exchange rates Change at constant exchange rates Marine Services 173.4 148.8 +16.5% 660.3 604.9 +9.2% deepwater offshore vessels 75.7 75.9 -0.3% 308.7 315.9 -2.3% continental offshore vessels 44.0 29.8 +47.5% 151.7 112.3 +35.1% crewboats 53.7 43.1 +24.7% 199.6 176.7 +13.1% Subsea Services 40.2 31.8 +26.2% 149.6 127.3 +17.5% Other 7.7 15.4 -49.7% 40.0 80.6 -50.4% BOURBON TOTAL 221.3 196.0 +12.9% 849.9 812.8 +4.6% +3.5%
- 2. 2 In the fourth quarter of 2010, BOURBON revenues totaled 221.3 million euros, up 12.9% compared with the same period in 2009. Compared with the same quarter of the previous year, “Marine Services” revenues were 16.5% higher at 173.4 million euros, despite a deterioration in market conditions. This growth is largely due to the full effect of the 58 new BOURBON vessels put in service in the last twelve months, in line with the Group's strategy of replacing old and obsolete continental offshore vessels. “Subsea Services” revenues were 26.2% higher at 40.2 million euros compared with the same quarter of the previous year, largely due to better performance from IMR vessels and expansion of the fleet (one new IMR vessel was put into service during the quarter). In full-year 2010, revenues were up 4.6% (3.5% at constant exchange rates) compared with the previous year. The allocations of vessel resources by segment confirm the value of BOURBON’s strategic choices. These choices permitted BOURBON to successfully withstand a difficult market. Key Indicators for BOURBON’s activity BOURBON fleet (owned vessels) BOURBON Q4 2010 Q3 2010 Change 2010 2009 Change Number of vessels at end of period 408 396 + 12 408 358 + 50 Utilization rates (in %) 81.1% 79.2% + 1.9 pts 79.9% 83.2% -3.3 pts Vessels continued to be delivered at a steady rate, albeit at a slightly lower pace than the average in the previous three quarters (12 deliveries in the fourth quarter, compared with an average of 16 previously). The average utilization rate of the fleet remained high at 81.1% in the fourth quarter of 2010, slightly higher than in the previous quarter. Geographic breakdown of BOURBON’s revenues 4th quarter Full year (in millions of euros) Q4 2010 Q4 2009 Change % 2010 2009 Change % Africa 142.7 126.5 +13% 550.1 533.6 +3% Europe & Mediterranean/Middle- East 34.2 33.9 +1% 129.7 137.2 -5% American Continent 30.0 16.0 +88% 99.0 57.1 +73% Asia 14.4 19.7 -27% 71.1 85.0 -16% Africa, which continues to be BOURBON’s principal geographic region, enjoyed a good fourth quarter, up 13%. At 12%, the contribution from the American continent in the Group’s revenues was markedly higher than in the previous year, posting growth of 88% in the 4th quarter of 2010, due to growth of the activity in Mexico and Brazil where, at the end of 2009, the Group took over the remaining 50% of Delba Maritima Navegaçao. Generally, the quarter saw a progressive upturn in activity, particularly in West Africa and Brazil. Replacement of old vessels by modern vessels is now clearly in evidence, however its effects were dampened by the arrival of new vessels coming out of the construction shipyards.
- 3. 3 MARINE SERVICES Marine Services Revenues 4th quarter Full year (in millions of euros) Q4 2010 Q4 2009 Change % 2010 2009 Change % Deepwater offshore vessels 75.7 75.9 -0.3% 308.7 315.9 -2.3% Continental offshore vessels 44.0 29.8 +47.5% 151.7 112.3 +35.1% Crewboats 53.7 43.1 +24.7% 199.9 176.7 +13.1% MARINE SERVICES TOTAL 173.4 148.8 +16.5% 660.3 604.9 +9.2% In the fourth quarter of 2010, “Marine Services” revenues came to 173.4 million euros, 16.5% higher than in the same quarter of the previous year despite a deterioration in market conditions. This growth is largely due to the very favorable reception from clients for the 58 new BOURBON vessels put into service in the last twelve months, confirming the value of the Group's strategy of replacing old and obsolete continental offshore vessels. Revenues generated by the deepwater offshore vessels totaling 75.7 million euros represented 44% of “Marine Services” revenues. This figure was slightly down compared with the 4th quarter of 2009 (-0.3%) due to the geographic relocation of 7 vessels and the decline in charter rates in the North Sea during the winter (2 vessels concerned). Revenues generated by continental offshore vessels were up 47.5% at 44.0 million euros. The contribution of the continental segment to “Marine Services” revenues rose from 20% to 25%, due to the success of the Bourbon Liberty fleet (26 new vessels added in the last twelve months) which led to a steady rise in revenues over the last four quarters. Revenues generated by crewboats were up nearly 25% at 53.7 million euros, thanks to the fleet’s expansion (30 new crewboats added in the last twelve months) producing a steady rise in revenues over the last four quarters. The administrative difficulties relating to the import of vessels into Brazil encountered in the previous quarter continued for most of the fourth quarter, but the 13 vessels concerned (8 of them continental offshore vessels) gradually began working at the end of December. Excluding the vessels in Brazil, the average utilization rate for the continental offshore fleet in the fourth quarter of 2010 was 4.6 points higher at 75.6% compared with the previous quarter. Over full-year 2010, “Marine Services” revenues were 9.2% higher at 660.3 million euros compared with full-year 2009, despite the deterioration in market conditions. This growth was due to the increase in the number of continental offshore vessels and crewboats. Compared with the third quarter of 2010, the expansion of the fleet and slight increase in the utilization rate were offset by the decrease of the dollar against the euro.
- 4. 4 Marine Services key indicators Q4 2010 Q3 2010 Change 2010 2009 Change Number of vessels at end of period 390 379 +11 390 343 +47 Deepwater offshore vessels 69 69 - 69 67 +2 Continental offshore vessels 78 74 +4 78 53 +25 Crewboats 243 236 +7 243 223 +20 Utilization rates (in %) 80.7% 78.7 % +2.0% 79.5% 83.0% -3.5% Deepwater offshore vessels 88.7% 90.4% -1.7 pts 90.3% 93.1% -2.8 pts Continental offshore vessels 74.2% 71.0% +3.2 pts 73.2% 84.2% -11 pts Crewboats 80.5% 77.4% +3.1 pts 78.2% 79.7% -1.5 pts In deepwater offshore, the annual and quarterly revenues reflect BOURBON’s strategic choice to avoid exposure to a segment (principally for AHTS) with excess capacity in 2010, which has seen a decline in the market’s utilization rates and average day rates. BOURBON thus only took delivery of 2 vessels in the year and the Group’s policy of long-term contracts enabled the utilization rate to be maintained at around 90% over the year. In the continental offshore segment, in line with BOURBON’s strategic positioning, 26 new vessels were deployed and under contract despite unfavorable market conditions. This demonstrates clients’ determination to boost the replacement market. In the crewboats segment, production maintenance activities and the revival of big offshore construction projects helped sustain utilization rates in the fourth quarter. SUBSEA SERVICES Subsea Services revenues 4th quarter Full year (in millions of euros) Q4 2010 Q4 2009 Change % 2010 2009 Change % SUBSEA SERVICES TOTAL 40.2 31.8 +26.2% 149.6 127.3 +17.5% In the fourth quarter of 2010, “Subsea Services” revenues were 26.2% higher at 40.2 million euros compared with the same quarter of the previous year, largely due to the expansion of the fleet (three new IMR vessels in the last twelve months). Over full-year 2010, “Subsea Services” revenues were 17.5% higher at 149.6 million euros compared with full-year 2009, thanks to the expansion of the fleet and integrated services. Compared with the third quarter of 2010, revenues were down 3.4% despite high utilization rates being maintained (over 91%). This is partly due to the unfavorable dollar exchange rate and to the geographical relocation of one vessel to Brazil.
- 5. 5 Subsea Services key indicators Q4 2010 Q3 2010 Change 2010 2009 Change Number of IMR vessels (at end of period) 17 16 +1 17 14 +3 Utilization rates (in %) 91.2% 91.5% -0.3 pts 88.5% 88.1% +0.4 pts The policy of long-term contractualization for BOURBON’s IMR vessels enabled a virtually constant utilization rate to be maintained. The fourth quarter saw the arrival of Southern Ocean, the biggest vessel in BOURBON’s fleet. OTHER “Other” revenues largely consisted of the activities of vessels chartered externally and the cement carrier Endeavor. In the fourth quarter of 2010, revenues of 7.7 million euros were down 49.7% compared with the same period of the previous year. This is largely due to the considerable decline in the external chartering of offshore vessels now unnecessary due to the expansion of the BOURBON fleet. Over the full-year 2010, revenues of 40.0 million euros were down 50.4%, for the reasons explained above. 2010 benefited from the full effect of the cement carrier’s contract. OUTLOOK The market is expecting oil prices to remain high, creating a favorable environment for investment in the sector. Analysts are forecasting growth of more than 11% in Exploration & Production investments in 2011. In this context, the demand for vessels will continue to grow, gradually absorbing the excess capacity. BOURBON has seen increasing demand from clients in terms of the safety and efficiency of offshore services vessels and operations, reinforcing their preference for more modern fleets over older vessels, especially in continental offshore. As a result, the average utilization rate for the BOURBON fleet is expected to continue to improve steadily which should lead to an increase in day rates. FINANCIAL CALENDAR Presentation of 2010 annual results March 16, 2011 1st quarter 2011 financial information May 11, 2011 Combined Annual and Special Shareholders' Meeting June 1, 2011 1st half 2011 financial information August 10, 2011 Presentation of 1st half 2011 results August 31, 2011
- 6. 6 APPENDICES – QUARTERLY INFORMATION Quarterly revenues BOURBON fleet Utilization Rate Quarterly commissioning of Offshore Vessels 2010 2009 (in millions of euros) Q4 Q3 Q2 Q1 Q4 Q3 Q2 Q1 Marine Services 173.4 171.7 166.5 148.7 148.8 156.9 152.2 147.0 Deepwater offshore vessels 75.7 79.3 79.8 73.8 75.9 80.3 80.3 79.4 Continental offshore vessels 44.0 41.1 35.9 30.8 29.8 30.4 28.0 24.0 Crewboats 53.7 51.3 50.7 44.1 43.1 46.2 43.9 43.5 Subsea Services IMR vessels 40.2 41.6 38.4 29.5 31.8 34.2 30.6 30.7 OTHER ACTIVITIES 7.7 9.0 11.2 12.1 15.4 17.8 23.0 24.4 GROUP TOTAL 221.3 222.2 216.1 190.2 196.0 208.9 205.9 202.1 2010 2009 In % Q4 Q3 Q2 Q1 Q4 Q3 Q2 Q1 Average utilization rate 81.1 79.2 81.0 78.1 78.3 82.7 84.7 88.3 Deepwater supply vessels 88.7 90.4 92.1 89.4 91.4 94.5 92.6 93.9 Continental supply vessels 74.2 71.0 75.4 72.4 80.6 79.6 86.6 92.4 Crewboats 80.5 77.4 78.6 75.9 73.2 79.6 81.7 86.0 IMR 91.2 91.5 89.8 80.9 90.4 88.9 88.6 84.5 2010 2009 (number of vessels) Q4 Q3 Q2 Q1 Q4 Q3 Q2 Q1 TOTAL FLEET 12 16 18 15 20 13 19 19 Marine Services 11 15 18 14 20 13 18 19 Deepwater Offshore Continental Offshore Crewboats - 4 7 1 6 8 1 8 9 - 8 6 3 6 11 2 4 7 1 6 11 1 4 14 Subsea Services / IMR 1 1 0 1 0 0 1 0
- 7. 7 Other key indicators The average euro/dollar exchange rate in 2010 was $1.33 compared with $1.39 in 2009. The average price of Brent crude in 2010 was $79 compared with $61 in 2009. About BOURBON BOURBON offers a broad range of deepwater and continental offshore oil and gas marine services. Under the new “BOURBON 2015 Leadership Strategy” plan, the company will invest US$ 2 billion to offer its most demanding oil and gas clients a large fleet of 600 innovative and high performance vessels. It will guarantee the highest standard of quality service worldwide, under completely safe conditions. BOURBON also protects the French coastline for the French Navy. Classified by ICB (Industry Classification Benchmark) in the "Oil Services" sector, BOURBON is listed for trading on Euronext Paris, Compartment A, and is included in the Deferred Settlement Service SRD and in the SBF 120 and Dow Jones Stoxx 600 indices. Contacts Publicis Consultants / Press Relations Jérôme Goaer +33 (0)1 44 82 46 24 jerome.goaer@consultants.publicis.fr Vilizara Lazarova +33 (0)1 44 82 46 34 vilizara.lazarova@consultants.publicis.fr BOURBON Investors - Analysts – Shareholders Relations Patrick Mangaud +33 (0)1 40 13 86 09 patrick.mangaud@bourbon-online.com Communications Department Christa Roqueblave +33 (0)1 40 13 86 06 christa.roqueblave@bourbon-online.com All information on www.bourbon-online.com 2010 2009 (in millions of euros) Q4 Q3 Q2 Q1 Q4 Q3 Q2 Q1 Average €/$ exchange rate for the quarter (in €) 1.33 1.29 1.27 1.38 1.48 1.43 1.36 1.30 Exchange rate at closing (in €) 1.34 1.36 1.23 1.35 1.44 1.46 1.41 1.33 Average Brent price for the quarter (in $/bl) 86 77 78 76 73 67 59 45