A monopoly market is characterized by:
· a single seller,
· no close substitutes, and
· effective barriers to entry.
Monopoly markets
Barriers to entry may exist for three reasons:
1. economies of scale,
2. actions by firms, and/or
3. actions by the government.
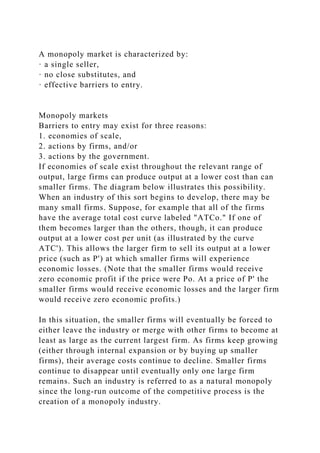
If economies of scale exist throughout the relevant range of output, large firms can produce output at a lower cost than can smaller firms. The diagram below illustrates this possibility. When an industry of this sort begins to develop, there may be many small firms. Suppose, for example that all of the firms have the average total cost curve labeled "ATCo." If one of them becomes larger than the others, though, it can produce output at a lower cost per unit (as illustrated by the curve ATC'). This allows the larger firm to sell its output at a lower price (such as P') at which smaller firms will experience economic losses. (Note that the smaller firms would receive zero economic profit if the price were Po. At a price of P' the smaller firms would receive economic losses and the larger firm would receive zero economic profits.)
In this situation, the smaller firms will eventually be forced to either leave the industry or merge with other firms to become at least as large as the current largest firm. As firms keep growing (either through internal expansion or by buying up smaller firms), their average costs continue to decline. Smaller firms continue to disappear until eventually only one large firm remains. Such an industry is referred to as a natural monopoly since the long-run outcome of the competitive process is the creation of a monopoly industry.
The concept of "natural monopoly" in the U.S. was first used to explain the early development of the telephone industry in the U.S. In the early years, most cities had several telephone companies competing to offer telephone service. To call all of the other people who had phones in a given city, people might have to subscribe to 3 or 4 telephone services (since they were not initially interconnected). By virtue of its patents and head start, though, the Bell Company was larger than most of its competitors. To see why this provided an advantage, note that once a company pays for the right-of-way and places telephone poles and wires on a given street, the cost of adding an additional customer (on that street) is fairly small. The company that acquires the most customers faces lower average costs. This is why AT&T was able to offer lower prices then its competitors. AT&T bought up these companies when they were no longer profitable. Since the government recognized that it would be more costly to have many small telephone companies, it chose to allow AT&T to operate as a regulated monopoly in which the government regulated the prices that could be charged for telephone services. (The government chose to break up AT&T in the latter part of the 20th century because the introduction of microwave and satellite transmissions of telephone sig ...
A monopoly market is characterized by· a single seller,· no clo.docx
1. A monopoly market is characterized by:
· a single seller,
· no close substitutes, and
· effective barriers to entry.
Monopoly markets
Barriers to entry may exist for three reasons:
1. economies of scale,
2. actions by firms, and/or
3. actions by the government.
If economies of scale exist throughout the relevant range of
output, large firms can produce output at a lower cost than can
smaller firms. The diagram below illustrates this possibility.
When an industry of this sort begins to develop, there may be
many small firms. Suppose, for example that all of the firms
have the average total cost curve labeled "ATCo." If one of
them becomes larger than the others, though, it can produce
output at a lower cost per unit (as illustrated by the curve
ATC'). This allows the larger firm to sell its output at a lower
price (such as P') at which smaller firms will experience
economic losses. (Note that the smaller firms would receive
zero economic profit if the price were Po. At a price of P' the
smaller firms would receive economic losses and the larger firm
would receive zero economic profits.)
In this situation, the smaller firms will eventually be forced to
either leave the industry or merge with other firms to become at
least as large as the current largest firm. As firms keep growing
(either through internal expansion or by buying up smaller
firms), their average costs continue to decline. Smaller firms
continue to disappear until eventually only one large firm
remains. Such an industry is referred to as a natural monopoly
since the long-run outcome of the competitive process is the
creation of a monopoly industry.
2. The concept of "natural monopoly" in the U.S. was first used to
explain the early development of the telephone industry in the
U.S. In the early years, most cities had several telephone
companies competing to offer telephone service. To call all of
the other people who had phones in a given city, people might
have to subscribe to 3 or 4 telephone services (since they were
not initially interconnected). By virtue of its patents and head
start, though, the Bell Company was larger than most of its
competitors. To see why this provided an advantage, note that
once a company pays for the right-of-way and places telephone
poles and wires on a given street, the cost of adding an
additional customer (on that street) is fairly small. The company
that acquires the most customers faces lower average costs. This
is why AT&T was able to offer lower prices then its
competitors. AT&T bought up these companies when they were
no longer profitable. Since the government recognized that it
would be more costly to have many small telephone companies,
it chose to allow AT&T to operate as a regulated monopoly in
which the government regulated the prices that could be charged
for telephone services. (The government chose to break up
AT&T in the latter part of the 20th century because the
introduction of microwave and satellite transmissions of
telephone signals and digital switching networks were believe
to have eliminated some of the economies of scale that were
present under the earlier technology.)
One way in which firms may acquire monopoly power is by
acquiring exclusive ownership of a raw material. As your text
notes, a single family in New Mexico controls most of the
known supply of desiccant clay. Firms can also raise the sunk
costs associated with entry into an industry to help discourage
entry by new firms. Sunk costs are costs that cannot be
recovered upon exit from an industry. These sunk costs include
things like the advertising expenditures needed to ensure brand-
name recognition. If a firm spends a large amount of money on
advertising, new firms in the industry will have to spend a
similar amount to counteract this advertising spending. While
3. investments in buildings can be (at least partly) recovered if a
firm leaves the industry, it cannot recover it's sunk costs. These
costs represent a cost of exit that must be taken into account by
firms considering entry into an industry. If all costs were
recoverable on exit, firms would be quite willing to enter to
receive even just temporary short-run profits. If they know that
they'd lose a large amount in the form of sunk costs, though,
they'd be much more cautious about entering an industry. Large
sunk costs are also difficult to finance. (A problem experienced
by John DeLorean when he attempted to enter the automotive
manufacturing industry.... His method of financing the high
sunk costs of this industry were not well received by the legal
authorities...)
Patents and licenses provide two types of barriers to entry that
are created by the government. While patent protection is
necessary to ensure that there are sufficient incentives for firms
to engage in research and development expenditures, it also
provides the patent holder with some degree of monopoly
power. This is how Polaroid has been able to maintain it's long-
term monopoly of the instant film business.
A local monopoly is a monopoly that exists in a specific
geographical area. In many regions, there is only a single
company providing local newspapers (at least on a daily basis).
In Syracuse, for example, the Syracuse Newspapers company is
the only local newspaper (note that this company publishes both
the Post-Standard, a morning newspaper, and the Herald
American, an afternoon paper).
Demand, AR, MR, TR, and elasticity
The demand curve facing a monopoly firm is the market demand
curve (since the firm is the only firm in the market). Since the
market demand curve is a downward sloping curve, marginal
revenue will be less than the price of the good (this relationship
was discussed in some detail in Chapter 9). As noted earlier,
marginal revenue is:
· positive when demand is elastic,
4. · equal to zero when demand is unit elastic, and
· negative when demand is inelastic.
These relationships are illustrated in the diagram below. As this
diagram illustrates, total revenue is maximized at the level of
output at which demand is unit elastic (and MR = 0). It might be
tempting to assume that this is the best output level for the firm
to produce. This would be the case, though, only if the firm's
goal is to maximize it's revenue. A profit- maximizing firm
must take its costs as well as its revenue into account in
determining how much output to produce.
As in all other market structures, average revenue (AR) is equal
to the price of the good. (To see this note that AR = TR/Q =
(PxQ)/Q = P.) Thus, the price given by the demand curve is the
average revenue that the firm receives at each level of output.
As discussed in Chapter 9, any firm maximizes its profits by
producing at the level of output at which marginal revenue
equals marginal cost (as long as P > AVC). For the monopoly
firm described by the diagram below, MR = MC at an output
level of Qo. The price that this firm will charge is Po (the price
that the firm can charge for this level of output given by the
demand curve). Since the price (Po) exceeds average total cost
(ATCo) at this level of output, the firm receives economic
profit. These monopoly profits, though, differ from those
received by a perfectly competitive firm in that these profits
will persist in the long run (due to the barriers to entry that
characterize a monopoly industry).
Of course, it is possible that a monopoly firm may experience
losses. The diagram below illustrates this possibility. In this
diagram, the firm receives economic losses equal to the shaded
area. Since price is above AVC, though, it will continue
operations in the short run, but will leave the industry in the
long run. Note that the ownership of a monopoly does not
guarantee the existence of economic profits. It is quite possible
to have a monopoly in the production of a good that few people
5. want....
A monopoly firm will shut down in the short run if the price
falls below AVC. This possibility is illustrated in the diagram
below.
Those who have not studied economics often believe that a
monopolist is able to choose any price that it wishes and that it
can always receive higher profits by raising its price. As in all
other market structures, though, the monopolist is constrained
by the demand for its product. If a monopoly firm wishes to
maximizes its profit, it must select the level of output at which
MR = MC. This determines a unique price that will be charged
in this industry. An increase in the price above this level would
reduce the profits received by the firm.
Price discrimination and dumping
Firms operating in markets other than those of perfect
competition are able to increase their profits by engaging in
price discrimination
, a practice in which higher prices are charged to those
customers who have the most inelastic demand for the product.
Necessary conditions for price discrimination include:
· the firm cannot be a price taker,
· the firm must be able to sort customers according the their
elasticity of demand, and
· resale of the product must not be feasible.
The diagram below illustrates how price discrimination may be
used in the market for airline travel. Those flying for vacation
purposes are likely to have a more elastic demand than those
who fly for business purposes. As the diagram below indicates,
the optimal price is higher in for business travelers than for
vacation travelers. Airlines engage in price discrimination by
offering low price "super saver" fares that require a weekend
stay and that tickets be purchased 2-4 weeks in advance. These
conditions are much more likely to be satisfied by individuals
6. traveling for vacation purposes. This helps to ensure that the
customers with the most elastic demand pay the lowest price for
this commodity.
Other examples of price discrimination includes daytime and
evening telephone rates, child and senior citizen discounts at
restaurants and movie theaters, and cents-off coupon in Sunday
newspapers. (Be sure to understand why each of these is an
example of price discrimination.)
When countries practice price discrimination by charging
different prices in different countries, they are often accused of
dumping in the low-price countries. Predatory dumping occurs
if a country charges a low price initially in an attempt to drive
out domestic competitors and then raises the price once the
domestic industry is destroyed. While it is often claimed that
predatory dumping occurs, the evidence on this is rather weak.
Comparison of perfect competition and monopoly
The left-hand side portion of the diagram below illustrates the
consumer and producer surplus that is received in a perfectly
competitive market. The right-hand side portion of the diagram
illustrates the loss in consumer and producer surplus that results
when a perfectly competitive industry is replaced by a
monopoly. As this diagram indicates, the introduction of a
monopoly firm causes the price to rise from P(pc) to P(m) while
the quantity of output falls from Q(pc) to Q(m). The higher
price and reduced quantity in the monopoly industry causes
consumer surplus to fall by the trapezoidal area ACBP(pc). This
does not all represent a cost to society, though, since the
rectangle P(m)CEP(pc) is transferred to the monopolist as
additional producer surplus. The net cost to society is equal to
the blue shaded triangle CBF. This net cost of a monopoly is
called
deadweight loss
. It is a measure of the loss of consumer and producer surplus
7. that results from the lower level of production that occurs in a
monopoly industry.
Some economists argue that the threat of potential competition
may encourage monopoly firms to produce more output at a
lower price than the model presented above suggests. This
argument suggests that the deadweight loss from a monopoly is
smaller when barriers to entry are less effective. Fear of
government intervention (in the form of price regulation or
antitrust action) may also keep prices lower in a monopoly
industry than would otherwise be expected.
A related point is that it is unreasonable to compare outcomes in
a perfectly competitive market with outcomes in monopoly
market that results from economies of scale. While competitive
firms may produce more output than a monopoly firm with the
same cost curves, a large monopoly firm produces output at a
lower cost than could smaller firms when economies of scale are
present. This reduces the amount of deadweight loss that might
be expected to occur as a result of the existence of a monopoly.
On the other hand, deadweight loss may understate the cost of
monopoly as a result of either X-inefficiency or rent-seeking
behavior on the part of monopolies. X-inefficiency occurs if
monopolies have less incentive to produce output in a least-cost
manner since they are not threatened with competitive
pressures. Rent-seeking behavior occurs when firms expend
resources to acquire monopoly power by hiring lawyers,
lobbyists, etc. in an attempt to receive governmentally granted
monopoly power. These rent-seeking activities do not benefit
society as a whole and divert resources away from productive
activity.
Regulation of natural monopoly
As noted above, a monopoly firm can produce at a lower cost
per unit of output than could any smaller firms in a natural
8. monopoly industry. In this case, the government generally
regulates the price that a monopoly firm can charge. The
diagram below illustrates alternative regulatory strategies in
such an industry. If the government leaves the monopolist
alone, it will maximize its profits by producing Q(m) units of
output and charging a price of P(m). Suppose, instead, though,
that the government attempts to emulate a perfectly competitive
market by setting the price equal to marginal cost. This would
occur at a price of P(mc) and a quantity of output of Q(mc).
Since this is a natural monopoly, though, the average cost curve
declines over the relevant range of output. If average costs are
declining, marginal costs must be less than average costs (this
relationship between marginal and average costs was discussed
in detail in Chapter 9). Thus, if the price equals marginal costs,
the price will be less than average total costs and the monopoly
firm will experience economic losses. This pricing strategy
could only exist in the long run if the government subsidized
the production of this good.
An alternative pricing strategy is to ensure that the owners of
the monopoly receive only a "fair rate of return" on their
investment rather than monopoly profits. This would occur if
the price were set at P(f). At this price, it would be optimal for
the firm to produce Q(f) units of output. As long as the owners
receive a fair rate of return, there would be no incentive for this
firm to leave the industry. Roughly speaking, this is the pricing
strategy that regulators use in establishing prices for utilities,
cable services, and the prices of other services produced in
regulated monopoly markets.