10. What is CLRN?
Online Course Reviews
Six subject areas
Standards Alignment
Common Core State Standards
California’s other standards
Next Generation Science Standards
iNACOL Standards for Quality Online
Courses
11. Why do reviews matter?
How do Colorado districts vet online
courses?
Colorado Graduation Pathways
Program Survey
149 of 179 districts (83%)
12. What steps does your school/district take
to validate that the rigor and quality of
online or blended learning courses meets
or exceeds that of “traditional” courses
taught in a brick and mortar classroom?
13. Answers and Questions
We examine the course outlines with
teachers and administration.
Matching up the state standards
with course, requiring minimums for
passing scores
None required
14. More Answers and Questions
Data supplied by curriculum
provider.
Student input on rigor compared to
last course or class taken.
Ensure alignment to state standards –
we need to be doing more
15. What factors did you consider
when selecting courseware?
Price
77%
Compared to content standards
60%
U.C. A-G list
60%
Examined course outlines
55%
Data supplied by provider
42%
Vendor demonstration
42%
Colleague recommendation
Selected CLRN Certified courses.
None
0
10
20
30
40
50
30. Course Publisher Distribution
2013
Apex Learning
Aventa (K12, Inc)
Cyber High
Odysseyware
ALEKS
K12.com
Pearson Digital Learning
Plato Learning
District Created
Education 2020
Compass Learning
BYU Independent Study
Accellus
Advanced Academics
Florida Virtual School
Middlebury Interactive Languages
Currium
A+ Learning
Class.com
Accelerate Education
Voyager Learning
National University Virtual High
Connections Learning
University of Nebraska, Lincoln
0
10
20
30
40
50
32. Why CLRN Reviews Online
Courses
Disrupting Class (2008)
Digital Textbook Initiative (2009/10)
Full courses of study
Authorization (2010)
33. Review Process
Literature review & initial criteria
SREB, iNACOL, TxVSN, QM, and WA Digital Learning
CLRN Advisory (Stakeholder) meetings
Initially review HS ELA & math courses to CCSS &
online course standards
Strength of TxVSN version
Criteria rewrite: California
Criteria rewrite: national
40. How CLRN Reviews
Utilized existing CLRN review sites
Six physical locations around CA
Subject specific
Established reviewer cohorts (20-30 educators)
Three-person review teams
Two-part review. Well, actually 8 parts
Edited & normed at CLRN Central
50. CLRN Review Sites
Six, subject-specific sites
County office based
Managed by COE content expert
20-25 active teachers
Meet monthly during school year
51. CLRN Review Sites
English-language arts
San Diego COE
History-social science
San Joaquin COE
Mathematics
Kings COE
Science
Humboldt COE
Visual and
Performing Arts
Orange DoE
World Languages
Orange DoE
66. A. Content
Content depth and breadth
Information literacy skills
Learning resources and materials
Communication process between
teachers, parents, and students
Content accuracy and bias
67. B. Instructional Design
Course design and organization
Meaningful and authentic learning
experiences
Multiple learning paths for students to master
the content
Higher-order thinking skills
Instructor-student and student-student
68. OCR Standards/Considerations
B3. The course
instruction includes
activities that
engage students in
active learning. ★
NOTE: Reading
and watching are
not active
The course provides multiple
opportunities for students to be
actively engaged in the content
that includes meaningful and
authentic learning experiences
such as collaborative learning
groups, student‐led review
sessions, games, analysis or
reactions to
videos, discussions, concept
mapping, analyzing case
studies, etc.
69. C. Student Assessment
Alignment between the course goals
and activities and its assessment
strategies
Insure that there are adequate and
appropriate methods to assess
students
Assure that students are constantly
71. E. Course Evaluation
and Support
Evaluating course effectiveness
Accreditation
Teacher and Student preparation and
support
72. CLRN Central Review
Validation & Norming
Work the course
Review/update all 52 course
standards
Standardize review comments
Notes inform reviewer retraining
73. CLRN Central Review
Editing & Proofreading
Review, modify, and standardize content standards rating
& comments
Publisher Feedback
Seven-day window
New evidence required for Re-Review
One Re-Review permitted per course.
Publishing
Reviews valid for three years
74. Texas H.B 4294
eTextbook publishers may submit
updated content for review
Districts/schools may select a
subscription-based electronic textbook
75. Supplemental Update Review
For Updated Courses
Updated, not new (New=>30% new content)
New content and/or course standards.
Strengthen alignment to the content standards
and/or the course standards.
Publishers provide specific evidence.
Once per year
76. CLRN Oversight
Stanislaus COE/CLRN Central
CDE/Curriculum, Frameworks and
Instructional Resources
CLRN Management Team Meetings
CLRN Advisory Team
98. Ed Code
Ed Code 49011 states that school
districts and schools shall not
establish a two-tier educational
system …through payment of a fee or
purchase of additional supplies that the
school district or school does not
provide; and
99. Analysis of the 398 published
53% certified
Up from 46&
27% teach < 80% content standards
Median: 63%
Range from 4% met to 78% met
12% only missing captions or transcripts
Most common problem
Content standards alignment
100. Certification by Subject
ELA:39%
(down from 54%)
History: 44%
Up from 27%
Math: 41%
Down from 47%
Science: 45%
Up from 28%
World Languages: 69%
Down from100%
106. The Need for Multiple Filters
• CLRN
• Self-review of content and course standards
• Customer feedback
107. Have you taken the course for a
test drive?
Would you buy a car sight unseen?
Would you sit in the passenger seat?
Then why rely solely on a provider
demonstration?
109. Play as a student
Participate in several units, spread
across the course
Be a great student
Be a struggling student
110. Be a teacher
Access the LMS
Can you add content / projects?
Check for student progress
Formative & summative assessments
111. Course Test Drive
Is the course engaging?
Does teach beyond Knowledge
and Comprehensive
Text based vs. multi-media
112. You don’t enter
the online revolution
with the courses you want.
You enter it with the courses you have.
113. What is not a great online
course
Class 1: Watch lecture. Complete worksheets. Take a
multiple choice test. Repeat
Class 2: Read. Take a multiple choice test. Repeat
Class 3: Read. Print and take quiz. Grade your quiz.
Take multiple choice test. Repeat
Class 4: Read a physical book. Take quiz from a
physical book. Take part in online discussion. Repeat
Moving a textbook online is not a foundation for a great
course.
114. What is not a great online lesson.
“Writing an introduction” slide show
Vocabulary exercises. Students then:
READ 12 textbook pages about verbs
READ 13 pages of textbook reading
about verb agreement
115. Not a great online
lesson, continued
READ 10 pages of textbook reading
about verb tense
READ 6 textbook pages about “verbs
made easy”
READ a one-page textbook page
about writing a first draft, and
READ two textbook pages about
simple narratives.
120. Make use of the medium
Rich media
Lecture clips, video demonstrations and
clips, variety of multi-media, simulations, …
Ease of use
LMS helps inform instruction. Students/teachers
always know where they are.
121. Make use of the medium
Multiple learning paths
Teacher is informed of problems. Students are
provided alternative lessons.
Engaging
Active learning, online discussions, writing &
analyzing, authentic activities
122. Inputs Matter
Proficiency can’t occur unless
courses are high quality
Teaching a critical mass of the standards
Actively engage students
Challenging students beyond knowledge and
comprehension
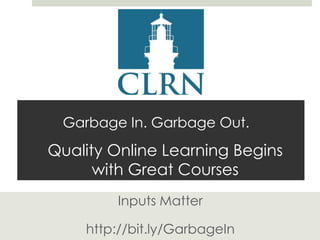
125. Garbage In. Garbage Out.
Quality Online Learning Begins
with Great Courses
Inputs Matter
Editor's Notes
Inputs matter. How can you tell if an online course is any good, whether it engages students in active learning, or challenges them with authentic, higher-level work? We’ll detail the California Learning Resource Network (CLRN) course review process, from publisher entry to publication, outlining criteria, including iNACOL’s course standards, for receiving our certification as part of our University of California partnership. We’ll also share data from the California eLearning Census.
There’s been a lot of talk in the eLearning community about competency based learning, that students should exit courses being proficient in that subject or course. These are known as “outputs.” If a course doesn’t result in student competency, then something went wrong. But what if a course indicates a student is proficient but the state assessment (PARCC or Smarter Balance) indicates they are not?This can easily be the case if a course teaches a low percentage of the content standards, if the course’s focus is on the wrong standards, or if students weren’t activity engaged and challenged with authentic work.This is where CLRN comes in. Our influence on course outcomes begins with the course itself. This session has several goals: 1) share with you how CLRN reviews courses, from soup to nuts. What do we expect of publishers? What is the review process and the criteria and how do we interpret them? 2) Why do reviews matter? What effect do our reviews have on the industry and on teaching and learning? We’ll have a couple stories about industry-wide and publisher-wide changes; 3) How should you read our reviews? 4) How should you buy an online course?
As the census drew to a close, we sent a supplemental survey to those districts that were purchasing courses, asking them about their selection process. When asked what factors they considered when selecting courseware, the top four choices were price, comparing courses to content standards, the U.C. A-G approved list, and examined course outlines. Sadly, few districts realize that by selecting from the UC A-G Approved courses, they’re also depending on CLRN’s certified course reviews.None10%Selected only CLRN Certified courses.3 6%Colleague recommendation17 32%Vendor demonstration2242%Data supplied by curriculum provider22 42%Examined course outlines2955%U.C. A-G list3260%Compared the course to the content standards32Price41 77%
The California Learning Resource Network (CLRN), a state-funded technology project that reviews online courses, conducts an annual eLearning Census to take the online and blended learning temperature of California’s public school districts and direct-funded charters. After building a database of more than 1000 school districts and 763 direct-funded charter schools, we began contacting them on March 1st, to report both online and blended student populations, courseware selection, and blended models in use. These results are from 516 district and charter schools, representing 29% of the overall population.California eLearning CensusMarch 1, 2013 – May 1, 20131777 K-12 districts & direct-funded charters1014 + 763 (43% charters)Results from 516 districts (29%)
While charters make up 43% of all school entities, just 28% of our responses came from direct-funded charters. For those of you unfamiliar with California’s charter schools, locally controlled charters enjoy charter privileges but are governed by a local school district. Census data from locally controlled charters in included in district data and was not separated out. Direct-funded charters, though, are independent entities controlled by their own governing board. In addition, we’ve disaggregated data from both elementary (K-8 or K-5) and unified school districts (K-12 or 9-12).
While we do not have a breakdown of the total elementary districts and charters in California, we can state that the 2012 census included 56% K-12/9-12 districts and charters, while in the 2013 census, both elementary and unified districts are split fairly evenly. Because of the inclusion of more elementary districts and charters, this year’s results may be lower than reality.263 K12 districts253 K-8 districts
So, how many districts are implementing online learning? We found that 46% of all districts and charters indicated they were using some form of online or blended learning. While last year’s data indicated that we may have passed online learning’s tipping point, this year’s census seems to indicate that online and blended learning is firmly entrenched in California’s schools and that we are in the period between the tipping point and critical mass.
Are online and blended learning being adopted at different rates and in different modes at elementary and unified districts? In 2012, 16% of elementary districts reported students were learning online. In 2013, the number of districts and charters involved increased to 19%. However, in unified and high school districts, 68% learned online in 2012, while 73% reported online and blended students in 2013. 253 K-8 districts; 48 areelearning (19%), up from 16% in 2012263 K-12/9-12 districts; 191 are elearning (72%)
eLearning adoption even varies between charter schools and school districts. While last year’s adoption was fairly consistent between the two, in 2013, 53% of charters and 44% of districts indicated they were supporting eLearning.77 of 144 Charters elearn162 of 372districts elearn
If Districts and charters weren’t involved in eLearning, we asked them if they were currently discussing or planning to implement online learning. 26% shared they were currently in the planning stages72 of 273
However, unified and high school districts and charters are more invested in investigating online learning than elementary districts. Just 20% of (40 of the 201) K-8 districts that are not elearning, say they are planning to implement it, while 44% of the unified and high school districts and charters(32 of 72) are planning to implement online and blended learning.
Desire to implement eLearning is fairly equal between districts and direct-funded charter schools with slightly more districts in the planning process. 24% of direct-funded charters plan to implement eLearning as compared with 27% of school districts.
We have not yet defined districts and charters by the grade levels they teach, so it’s possible that some of the grade levels show here are under represented. 83% of the districts reporting indicated their high school students are learning online. 47% of districts use eLearning in middle school. And 27% of elementary schools are learning online.
In 2013, 28% of districts indicated online or blended learning was taking place in grades K-5, 49% in grades 6-8, and 78% in grades 9-12.
However, when separating elementary and unified districts, we find that just 19% of elementary districts are implementing eLearning compared to 73% of unified and grade 9-12 districts.
Last year’s census indicated that most districts and charters are tiptoeing into online learning and the relative numbers of students involved in each district was low. That has begun to change, though, as districts and charters gain more experience. The 2013 census indicates that more students in each district are taking part in online and blended learning.Last year, 24% of all districts and charters had fewer than 20 students learning online, while this year that percentage has dropped to 13% indicating that districts are involving more students in online and blended learning. When totaling all eLearning students in the bottom 50 districts, we found just 542 students in 2012 while this year’s total is 887. 2012: 24% (41 districts) < 20 students online2013: 13% (26 districts) < 20 students online2012: Bottom 50 districts: 542 students2013: Bottom 50: 887students
Virtual: 19,820 (N: 60 (50% district, 50% charters)Blended: 86,675 N:172 (75% districts, 24% charters)2013 Virtual: 24,3832013 Blended: 100,882How many students are learning online?Currently, 19,820 student are learning online full-time in virtual schools. This is a finite number though as we know the names of all California virtual schools. To date, 14 full time schools have yet to report.Virtual: 19,820 (N: 60 (50% district, 50% charters)Blended: 86,675 N:172 (75% districts, 24% charters)2013 Virtual: 24,3832013 Blended: 100,882However, the number of blended learning students, with 30% of districts reporting, is 86 thousand.23 thousand students learned online during summer school last year.
Actual population numbers have increased too. In 2012, we counted 19,820 full-time online (virtual) students In 2013, those numbers increased to 24,383 virtual students. and 86,257 blended students.Last year, we counted just more than 86K blended students, but this year’s total is just under 100,882 blended students. This represents a 23% increase in the number of full-time virtual students and a 17% increase in blended learning.Virtual: 19,820 (N: 60 (50% district, 50% charters)Blended: 86,675 N:172 (75% districts, 24% charters)2013 Virtual: 24,3832013 Blended: 100,882
Average numbers of online students increased in all categories. Online and blended summer school attendance averaged 132 students, a 6j% increase; Virtual school averages rose from 98 to 139 students, a 42% increase; and the average number of blended students per district or direct-funded charter rose from 453 to 490, a 8% increase.
Median populations, though, are often more telling. The median, the point where half the districts have more than the number and half have less also increased in 2013.Last year, half of California’s districts and charters had more than 80 students blending their learning while this year the median rose to 100. Last year, the median number of virtual students was 56 full-time online students, but in 2013, the median blended population rose to 100 students. Both median populations increased 25% 2013. 2013: 69 districts reported full-time virtual students2013 Medians: Blended-100; Virtual -70
I
I
Of the 481 districts and charters learning participating, 216 of them are utilizing blended or virtual learning. One outlier floated to the top: Riverside Unified. While the average number of students per district was 504, the median number of students was 80, meaning that half the districts had more than 80 students participating while the other half had fewer than 80 students participating.
In 2012,the most popular blended model was Self Blend, which the Innosight Institute has just renamed the “Al la Carte” model, followed by the Enriched-Virtual, a model used by Independent Study schools in California. This seems to indicate that non-consumers, students who are using eLearning to supplement their transcript or schools that provide online courses not offered in the classroom, are a driving force.We also found that 31% of districts and direct-funded charters are utilizing more than one blended learning model.Self Blend: 60%Enriched-Virtual: 36%Rotation: 29%Flex: 17%
Of the four blended learning models, the most popular is the Self Blend, followed by Hybrid Virtual School, a model used by Independent Study schools in california. This seems to indicate that non-consumers, students who are using eLearning to supplement their transcript or schools that provide online courses not offered in the classroom, are a driving force.Census data reflects 31% of districts and direct-funded charters reported they are utilizing more than one blended learning model.Self Blend: 60%Enriched-Virtual: 36%Rotation: 29%Flex: 17%
In 2013, though, the Rotation method overtook the Self-Blend (46% to 40%) followed in third by Enriched Virtual.This year, 34% of districts and direct-funded charters reported they are utilizing more than one blended learning model.Self Blend: 60%Enriched-Virtual: 36%Rotation: 29%Flex: 17%
When
When separatingelementary and unified districts, though, we found that the predominate model in elementary districts was the Rotation method, followed by 80% of districts and charters. Just 15% of elementary districts indicated they were using more than one blended model.6 of 40 had two blended models in place.
In unified and high school districts last year, the predominate blended model was the Self-Blend followed by Enriched Virtual.
This year, though, the numbers flipped a little with 48% reporting using the Self-Blend, followed by the Rotation and Enriched Virtual models. 38% of these districts report using more than one blended model.
While California’s schools purchase online courses from a variety of publishers and providers, the top four players are nearly the same as 2012: Apex Learning, Aventa, Cyber High and Odysseyware. We found it interesting that a substantial number of districts are creating their own courses.However, while 23% of districts purchased courses from more than one vendor in 2012, 46% of districts and charters utilized multiple publishers in 2013. This seems to both confirm virtual and blended learning’s expansion and districts’ willingness to select courses that meet the needs of specific populations.
OER resources, digital materials available for free or a very low cost from sources including Khan Academy and the National Repository of Online Courses (NROC), are helping districts add a digital component without investing in developing or acquiring content. Districts and direct-funded charters also indicated they are utilizing supplemental software/Internet resources or open source materials for online and blended learning in addition to or instead of licensed courses; 14% indicated they utilize two or more OER providers.
Districts creating their own courses or blending their learning primarily utilized the Kahn Academy, dominating at 87%, unchanged from 2012.
What specific actions did districts and charters undertake before purchasing courses? While a few districts indicated they took no action at all, 23% asked for a demo account, 22% had the provider demonstrate the course to them and just 22% had their teachers sample courses?Demo Account 41Provider demonstration 39 Teachers sampled course 38Asked districts about experience 29Had students sample 18None 5
How wide did districts survey the landscape when investigating courseware? Nearly a quarter shared they investigated one or two publishers, while another 24% looked at three publishers. 52% of districts and charters investigated four or more publishers.
How many courses from each publisher did districts sample before purchasing? Sadly, 16% shared they looked at none or one online course before purchasing. 28% investigated two online courses, 17% looked at three, and 40% indicated they looked at four or more courses.
Who teaches online and blended courses at charters schools and districts? Nearly three quarters of all districts and charters (74%) shared that their own teachers conduct online and blended courses, while 14% utilized a provider’s teachers. 11% of districts and charters use a combination of provider and district teachers.
Given that teaching online requires a different skill-set than classroom teaching, we wanted to know if online and blended teachers had been provided professional development specific to how to teach online. Just 22% of districts and charters provide no teacher training to online and blended teachers.
Finally, we enquired about the learning management systems districts are using to host online or blended courses. While most publishers or providers provide their own LMS, we found a significant number of districts were using Edmodo, followed by Moodle or it’s variations and Haiku. Not far down the list, surprisingly, are district created learning management systems.
CLRN created the California eLearning Census to track both the growth and variety of online and blended learning in California. One of our motivations was Clayton Christensen’s and Michael Horn’s book, Disrupting Class, which predicted that online and blended learning would reach a tipping point in 2013 and that by 2019, 50% of all high school courses would be online. Our second annual census indicates a definite increase in both numbers and usage. Whether it’s the 25% increase in median populations or the 17% increase in total population; whether it’s knowing that nearly half the districts are selecting courseware from more than one publisher as compared with just 24% last year; or whether it’s the increase in average population or the distribution of blended models, online and blended learning are firmly entrenched in California’s schools. We’re now in the period between the tipping point and critical mass where eLearning will continue to grow, evolve, and mature. CLRN is here, helping to improve online and blending courses by reporting how they meet the Common Core State Standards, California’s other content standards, AND iNACOL’s national standards for quality online courses. Our partnership with the University of California ensures that no online course will receive approval for their A-G requirements unless CLRN has reviewed and certified it. CLRN”s reviews may be found at CLRN.org.
13 areas
Graphic should be clickable.
When you buy an online course, do you assume it’s high quality? Do you assume it teaches all the standards? Do you assume your students will be engaged and motivated to complete it?How would you feel if your Algebra I teacher covered 40 of the 50 CCSS standards?How about 30 of 50 or 60% or 25 or 50% of the course standards?So, how do you ensure that the Algebra I course you bought covers more than 50% or 80% of the standards?
Choosing a process to select quality courseware.
Three levels for each standard.Demonstrate, Practice, and AssessList MET, Partially MET, and NOT MET.If partially met, we list the components missing from each standard.
You don’t enter the online revolution with the courses you want. You enter it with the courses you have.
Short video clip of a boring teacher?If you walked into a f2f class and saw this type of teaching/learning, would you be impressed? Would you recommend this class to other students? Would you send a struggling student there? The lesson begins with “Writing an introduction” slide show, which would be stronger if narrated, followed by some vocabulary exercises. Students then read:12 textbook pages about verbs13 pages of textbook reading about verb agreement10 pages of textbook reading about verb tensesix textbook pages about “verbs made easy”a one-page textbook page about writing a first draft, andtwo textbook pages about simple narratives.
Image a great face to face courseStimulating lectures, just in time reading, active learning, activities that go beyond simple knowledge and comprehension. Individual and group activities that require you to create, evaluate, and analyze.Variety of assessment types that are aligned to what was being taught. Multiple choice tests are not the best choice always.
Inputs matter. How can you tell if an online course is any good, whether it engages students in active learning, or challenges them with authentic, higher-level work? We’ll detail the California Learning Resource Network (CLRN) course review process, from publisher entry to publication, outlining criteria, including iNACOL’s course standards, for receiving our certification as part of our University of California partnership. We’ll also share data from the California eLearning Census.