Report II week 4 individual
1
Report II week 4individual
4
Report II
MHA / 507
Report II
When it comes to outbreaks, it must be identified, and it needs to be given to the people that need it the most which included the population and the world. When it comes to the information required what is most necessary is the age groups that the virus is affecting and understanding the information that is provided. With proper documentation it will be able to identify the groups that needs the most help and it will be able to provide the necessary resources needed for the locations that involve the patients.
Age Groups Most Affected
According to the World Health Organization (WHO), children, pregnant women, and seniors are especially vulnerable and take a relatively high share of the disease burden (WHO, 2017). When it comes to reviewing the information that was provided the it will state that the highest rate that is going for diseases are higher for the age under 18, when it comes to 61 and over, the ages between 31 to 60, and between the ages of 19 to 30 which decides which one are the most vulnerable groups.
Age Groups Least Affected
When it comes to the age group that were not affected then it will be between 19 to 30 years old and the ages between 31 to 60. When it comes to this age group it is mostly because they tend to be healthier in general because there immune system. One of the reasons these age groups are least affected is because these tend to be the healthier ages in general, so their immune systems are likely more tolerant and vigilant (Vos et al., 2016).
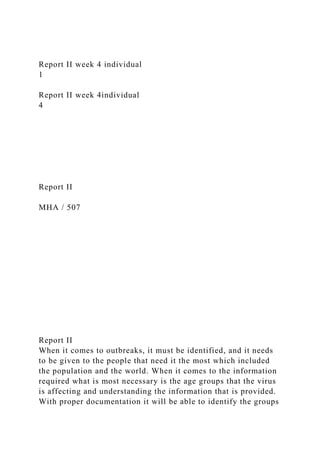
Chart Evaluation
The evaluation that is presented above is the age groups that are least affected which are 19 to 30 years old. Individual influences lead to virus occurrences that can be recognized in nearly all incidents (Morse, 1995). This does not just show the age group and location but shows what are the odds of something happening and what to look out for because this allows the population to know the risks of their locations.
Prevalence Rates
When it comes to the prevalence rate for disease than it varies among different ages among the cities. The population of the United States in 12/18/2017 is 325,365,189. (United States Census Bureau, 2017). But to be able to find the prevalence rate is per 100,000 for this disease, the by the number of infections by an age group which divides by the population, which then multiplies by 100,000. Presented below is the five cities affected by the disease by age group.
City
<18 Prevalence Rate
19-30 Prevalence Rate
31-60 Prevalence Rate
61+ Prevalence Rate
Jacksonville
0.02858
0.00584
0.01875
0.04579
Miami
0.05225
0.00553
0.00922
0.02490
Phoenix
0.04457
0.00615
0.00984
0.02828
Austin
0.04641
0.00369
0.01199
0.02428
Houston
0.03012
0.00492
0.01598
0.03258
Conclusion
Having the necessary information is needed to be able to help find resources or care for a cure for the diseases presented. When it comes to diseases it i ...
Kisan Call Centre - To harness potential of ICT in Agriculture by answer farm...
Report II week 4 individual 1Report II week 4individual4.docx
1. Report II week 4 individual
1
Report II week 4individual
4
Report II
MHA / 507
Report II
When it comes to outbreaks, it must be identified, and it needs
to be given to the people that need it the most which included
the population and the world. When it comes to the information
required what is most necessary is the age groups that the virus
is affecting and understanding the information that is provided.
With proper documentation it will be able to identify the groups
2. that needs the most help and it will be able to provide the
necessary resources needed for the locations that involve the
patients.
Age Groups Most Affected
According to the World Health Organization (WHO), children,
pregnant women, and seniors are especially vulnerable and take
a relatively high share of the disease burden (WHO, 2017).
When it comes to reviewing the information that was provided
the it will state that the highest rate that is going for diseases
are higher for the age under 18, when it comes to 61 and over,
the ages between 31 to 60, and between the ages of 19 to 30
which decides which one are the most vulnerable groups.
Age Groups Least Affected
When it comes to the age group that were not affected then it
will be between 19 to 30 years old and the ages between 31 to
60. When it comes to this age group it is mostly because they
tend to be healthier in general because there immune system.
One of the reasons these age groups are least affected is because
these tend to be the healthier ages in general, so their immune
systems are likely more tolerant and vigilant (Vos et al., 2016).
Chart Evaluation
The evaluation that is presented above is the age groups that are
least affected which are 19 to 30 years old. Individual
influences lead to virus occurrences that can be recognized in
nearly all incidents (Morse, 1995). This does not just show the
age group and location but shows what are the odds of
something happening and what to look out for because this
allows the population to know the risks of their locations.
Prevalence Rates
When it comes to the prevalence rate for disease than it
varies among different ages among the cities. The population of
the United States in 12/18/2017 is 325,365,189. (United States
Census Bureau, 2017). But to be able to find the prevalence
rate is per 100,000 for this disease, the by the number of
infections by an age group which divides by the population,
3. which then multiplies by 100,000. Presented below is the five
cities affected by the disease by age group.
City
<18 Prevalence Rate
19-30 Prevalence Rate
31-60 Prevalence Rate
61+ Prevalence Rate
Jacksonville
0.02858
0.00584
0.01875
0.04579
Miami
0.05225
0.00553
0.00922
0.02490
Phoenix
0.04457
0.00615
0.00984
0.02828
Austin
0.04641
0.00369
0.01199
0.02428
Houston
0.03012
0.00492
0.01598
0.03258
Conclusion
Having the necessary information is needed to be able to help
4. find resources or care for a cure for the diseases presented.
When it comes to diseases it is always recommended to have the
age group because it filters numbers and people to help discover
a cure. But to be able to have a healthier population then it is
needed to have data to better resources for the needed
population.
References
Morse, S. (January-March 1995). Factors in the emergence of
infectious disease. The
Rockefeller University, New York, NY. 1(1).
United States Census Bureau. (2017 December 18). U.S. &
world population clock. Retrieved
from https://www.census.gov/popclock/
Vos, T., Allen, C., Arora, M., Barber, R. M., Bhutta, Z. A.,
Brown, A., … Murray, C. J. L.
(2016). Global, regional, and national incidence, prevalence,
and years lived with disability for 310 diseases and injuries,
1990-2015: A systematic analysis for the global burden of
disease study 2015. The Lancet, 388(10053), 1545-1602.
doi:http://dx.doi.org/10.1016/S0140-6736(16)31678-6
World Health Organization (WHO). (2017). Vulnerable groups.
Retrieved from
http://www.who.int/environmental_health_emergencies/vulnera
ble_groups/en/
Ages Impacted
Jacksonville < 18 19-30 31-60 61+ 93 19 61
149 Miami < 18 19-30 31-60 61+ 170 18