Download as PDF, PPTX


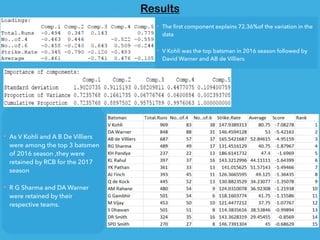


The document analyzes the Indian Premier League (IPL) from 2008 to 2016, focusing on player and team performance, including statistical models and rankings. It highlights key players, with Virat Kohli being a standout batsman in the 2016 season and Bhuvneshwar Kumar leading as a bowler. The analysis shows improvements in average runs for opening and middle-order batsmen in recent seasons, suggesting a trend in player performance.