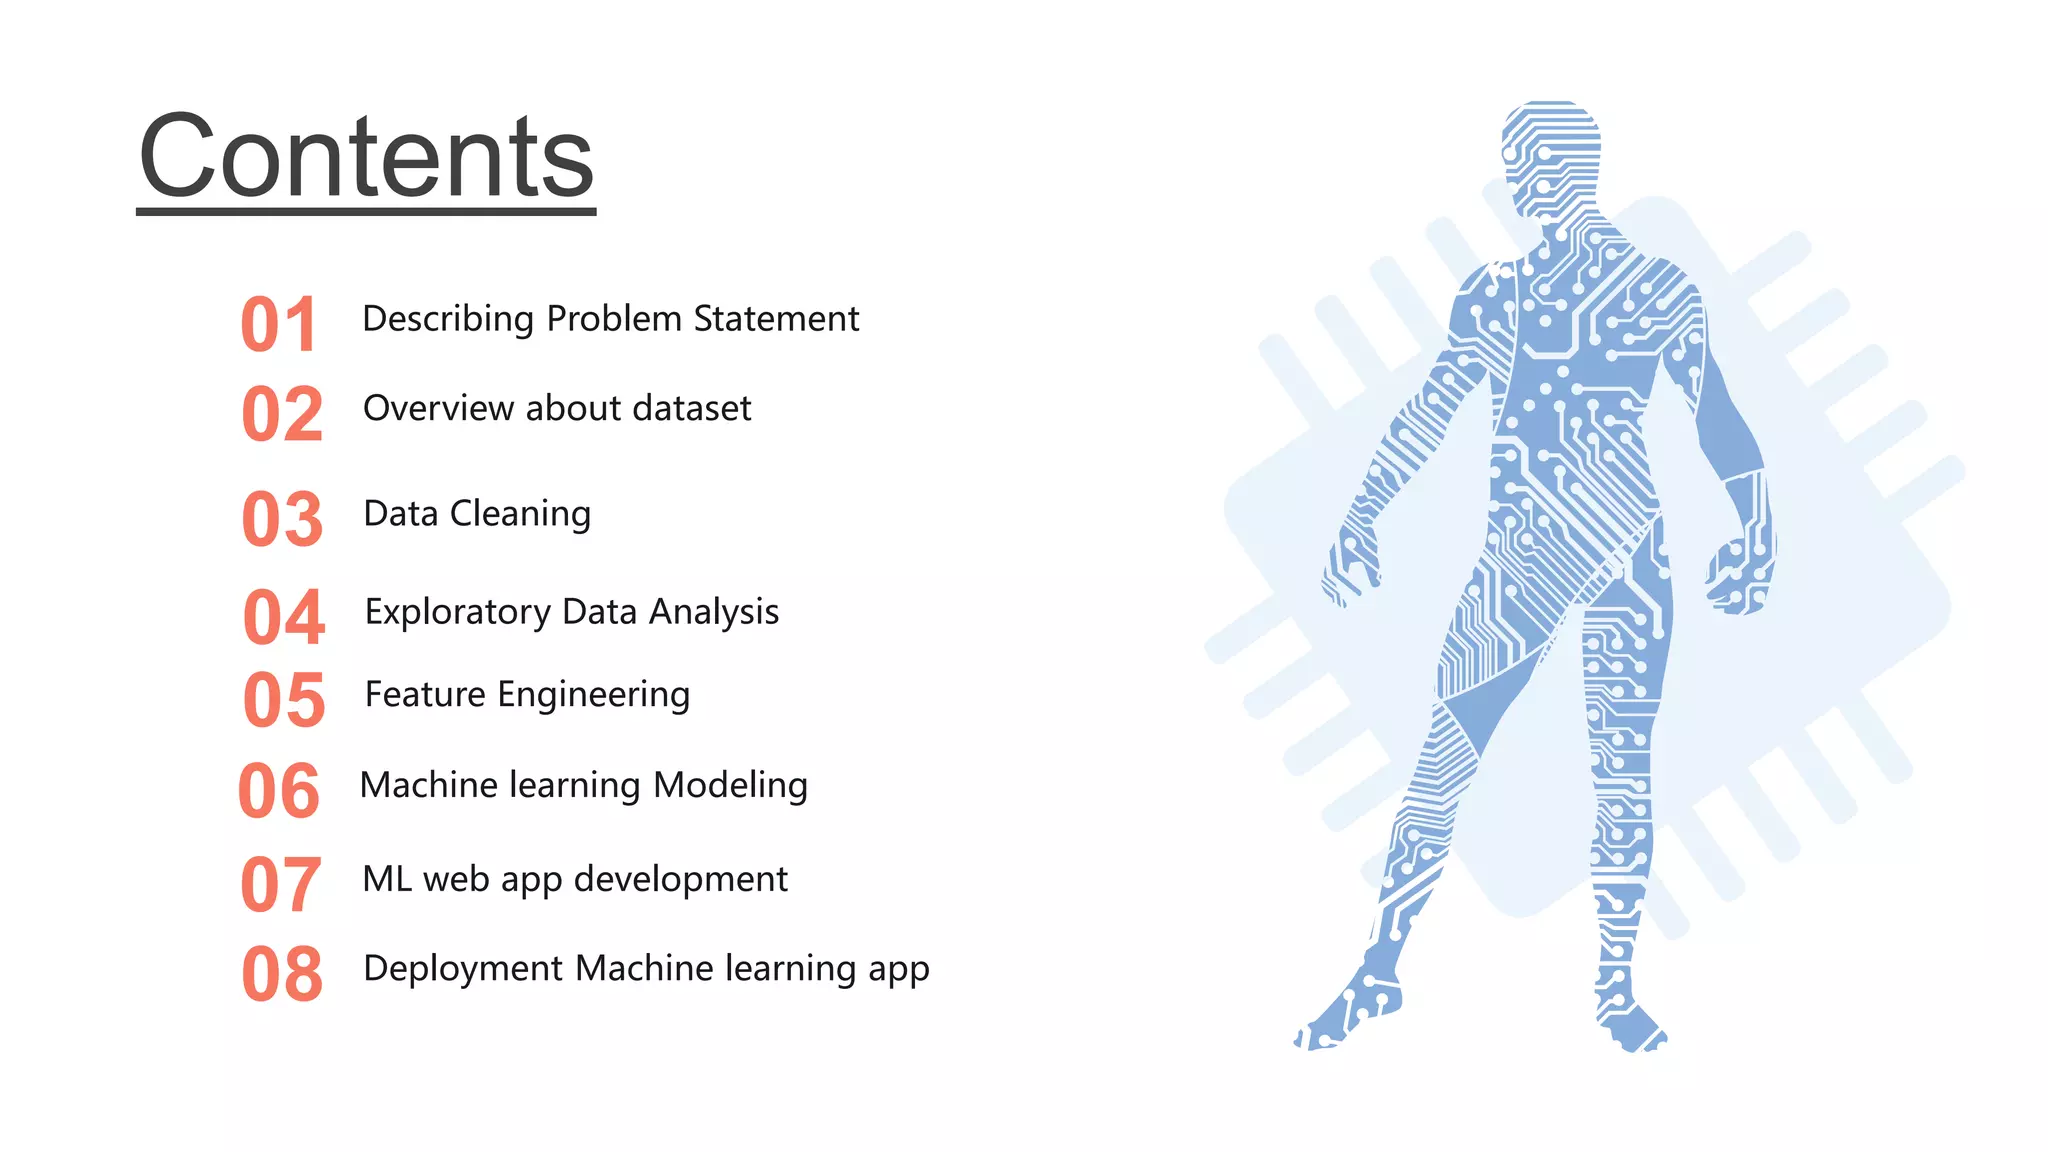
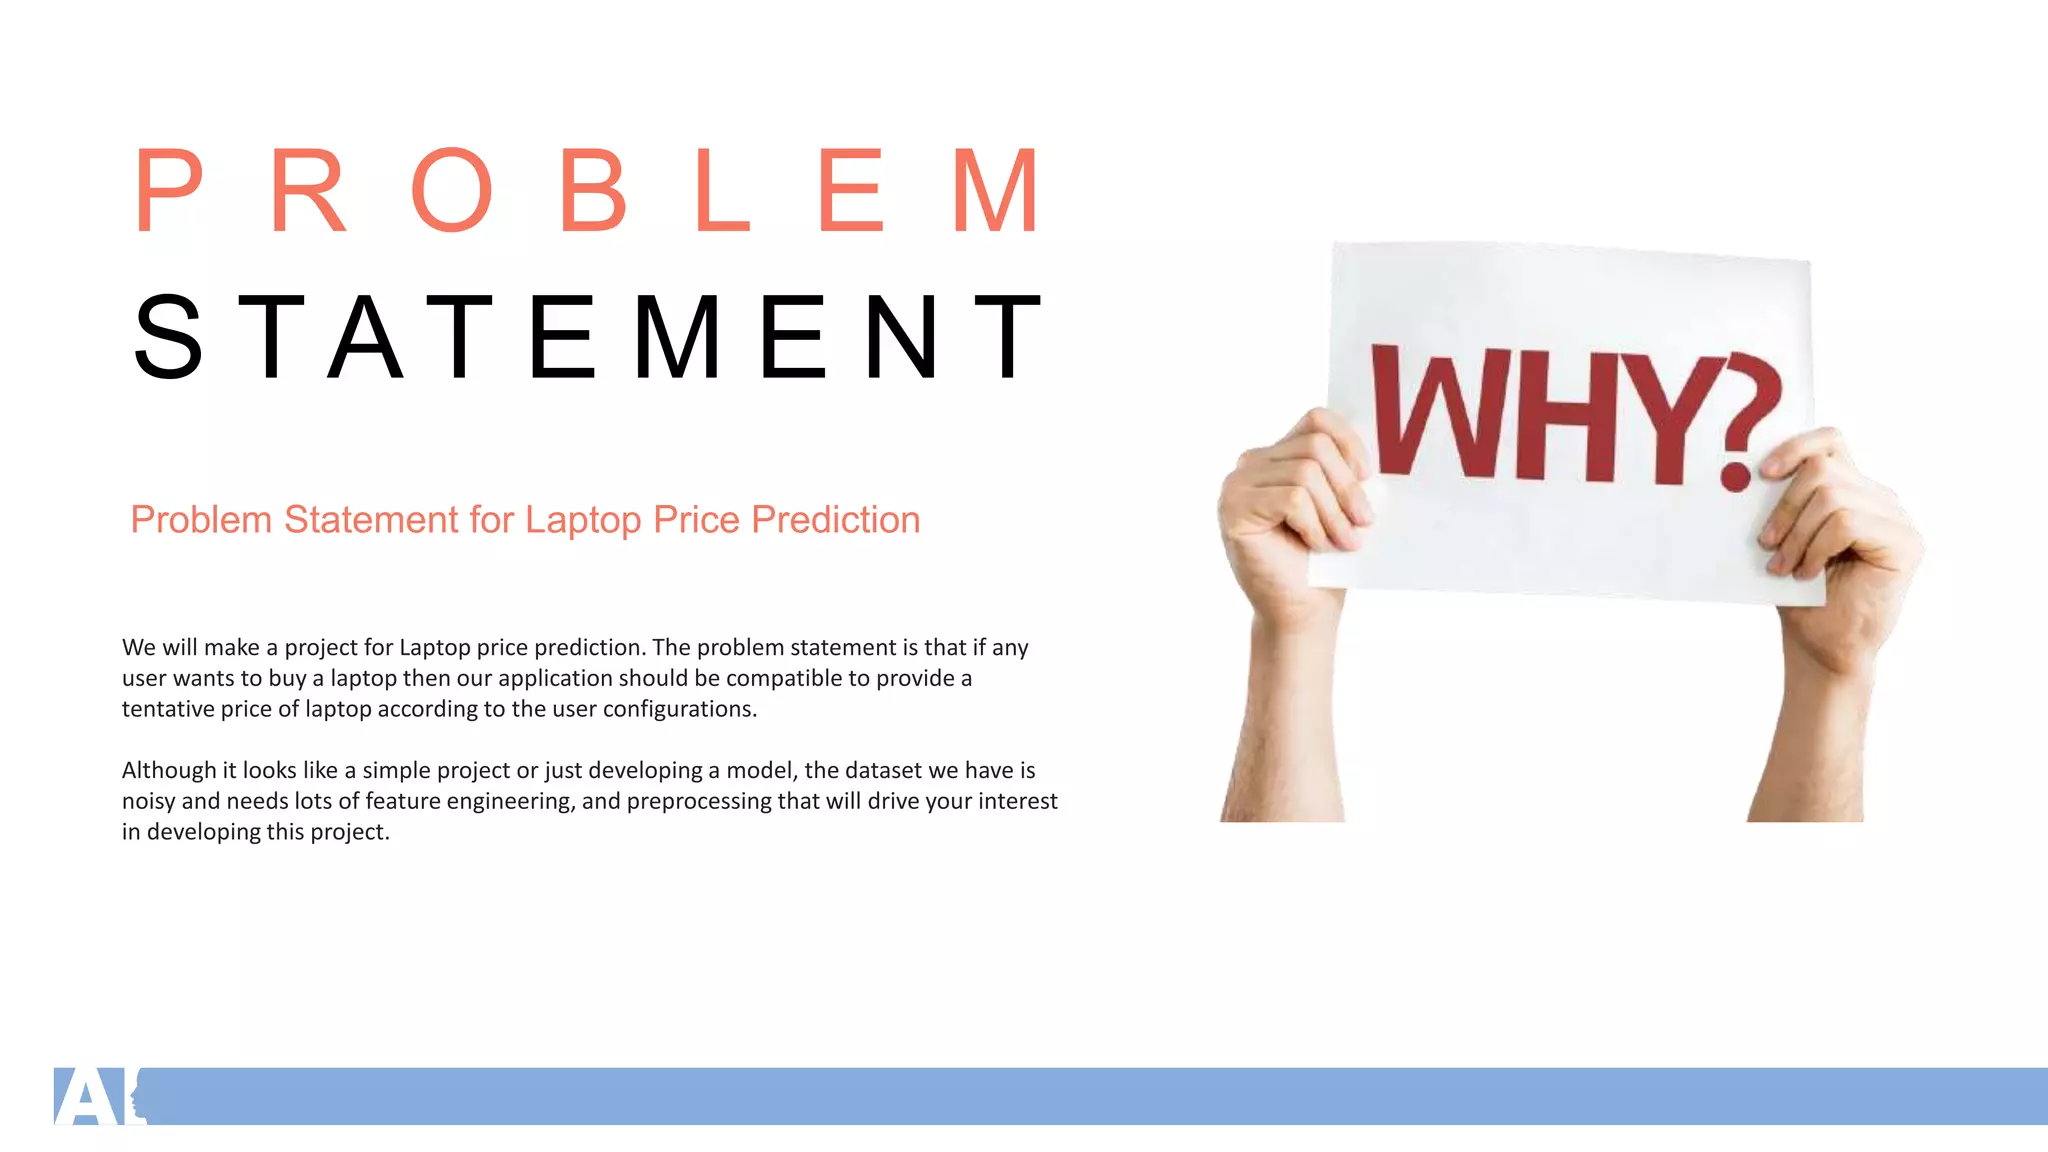
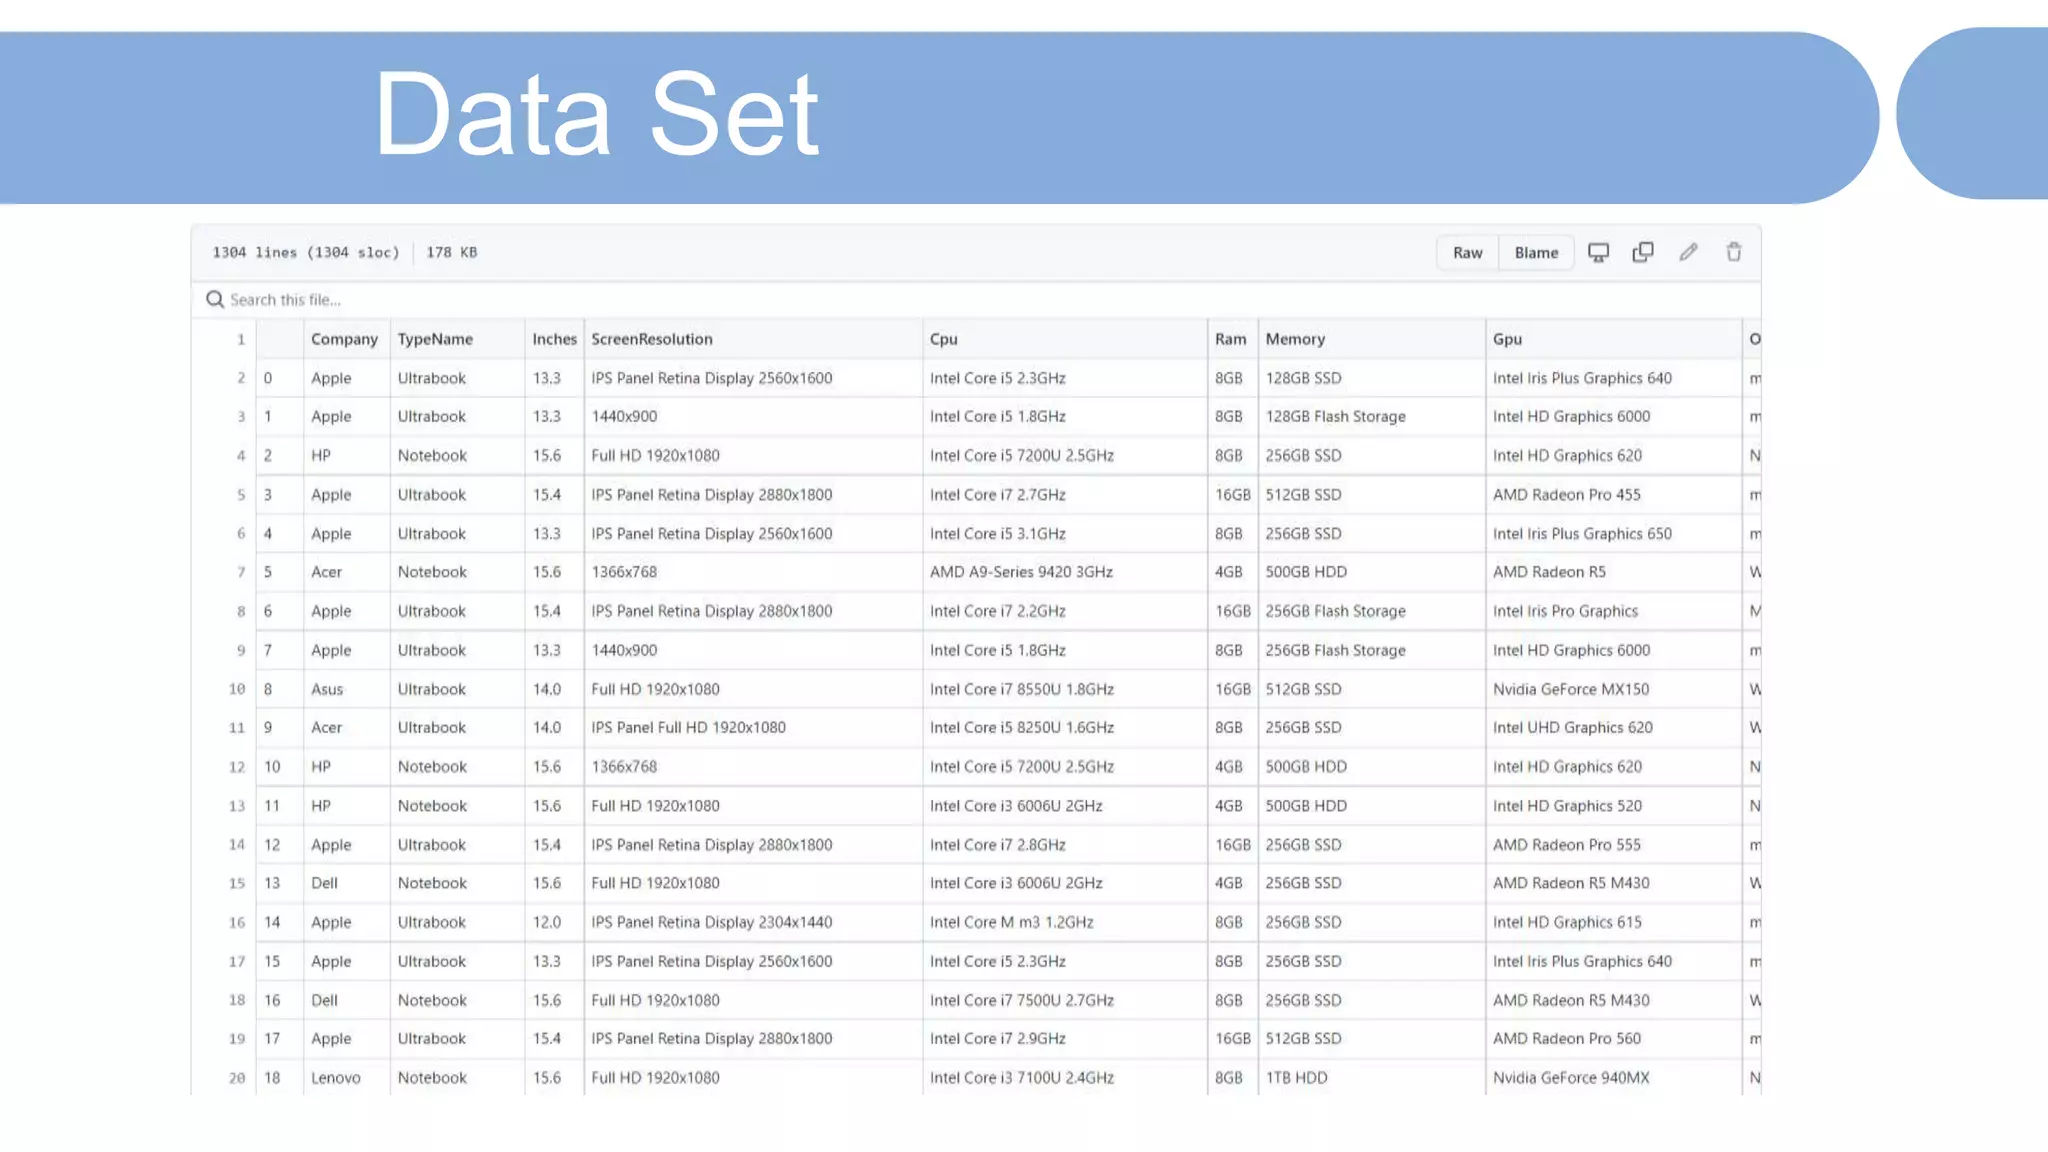
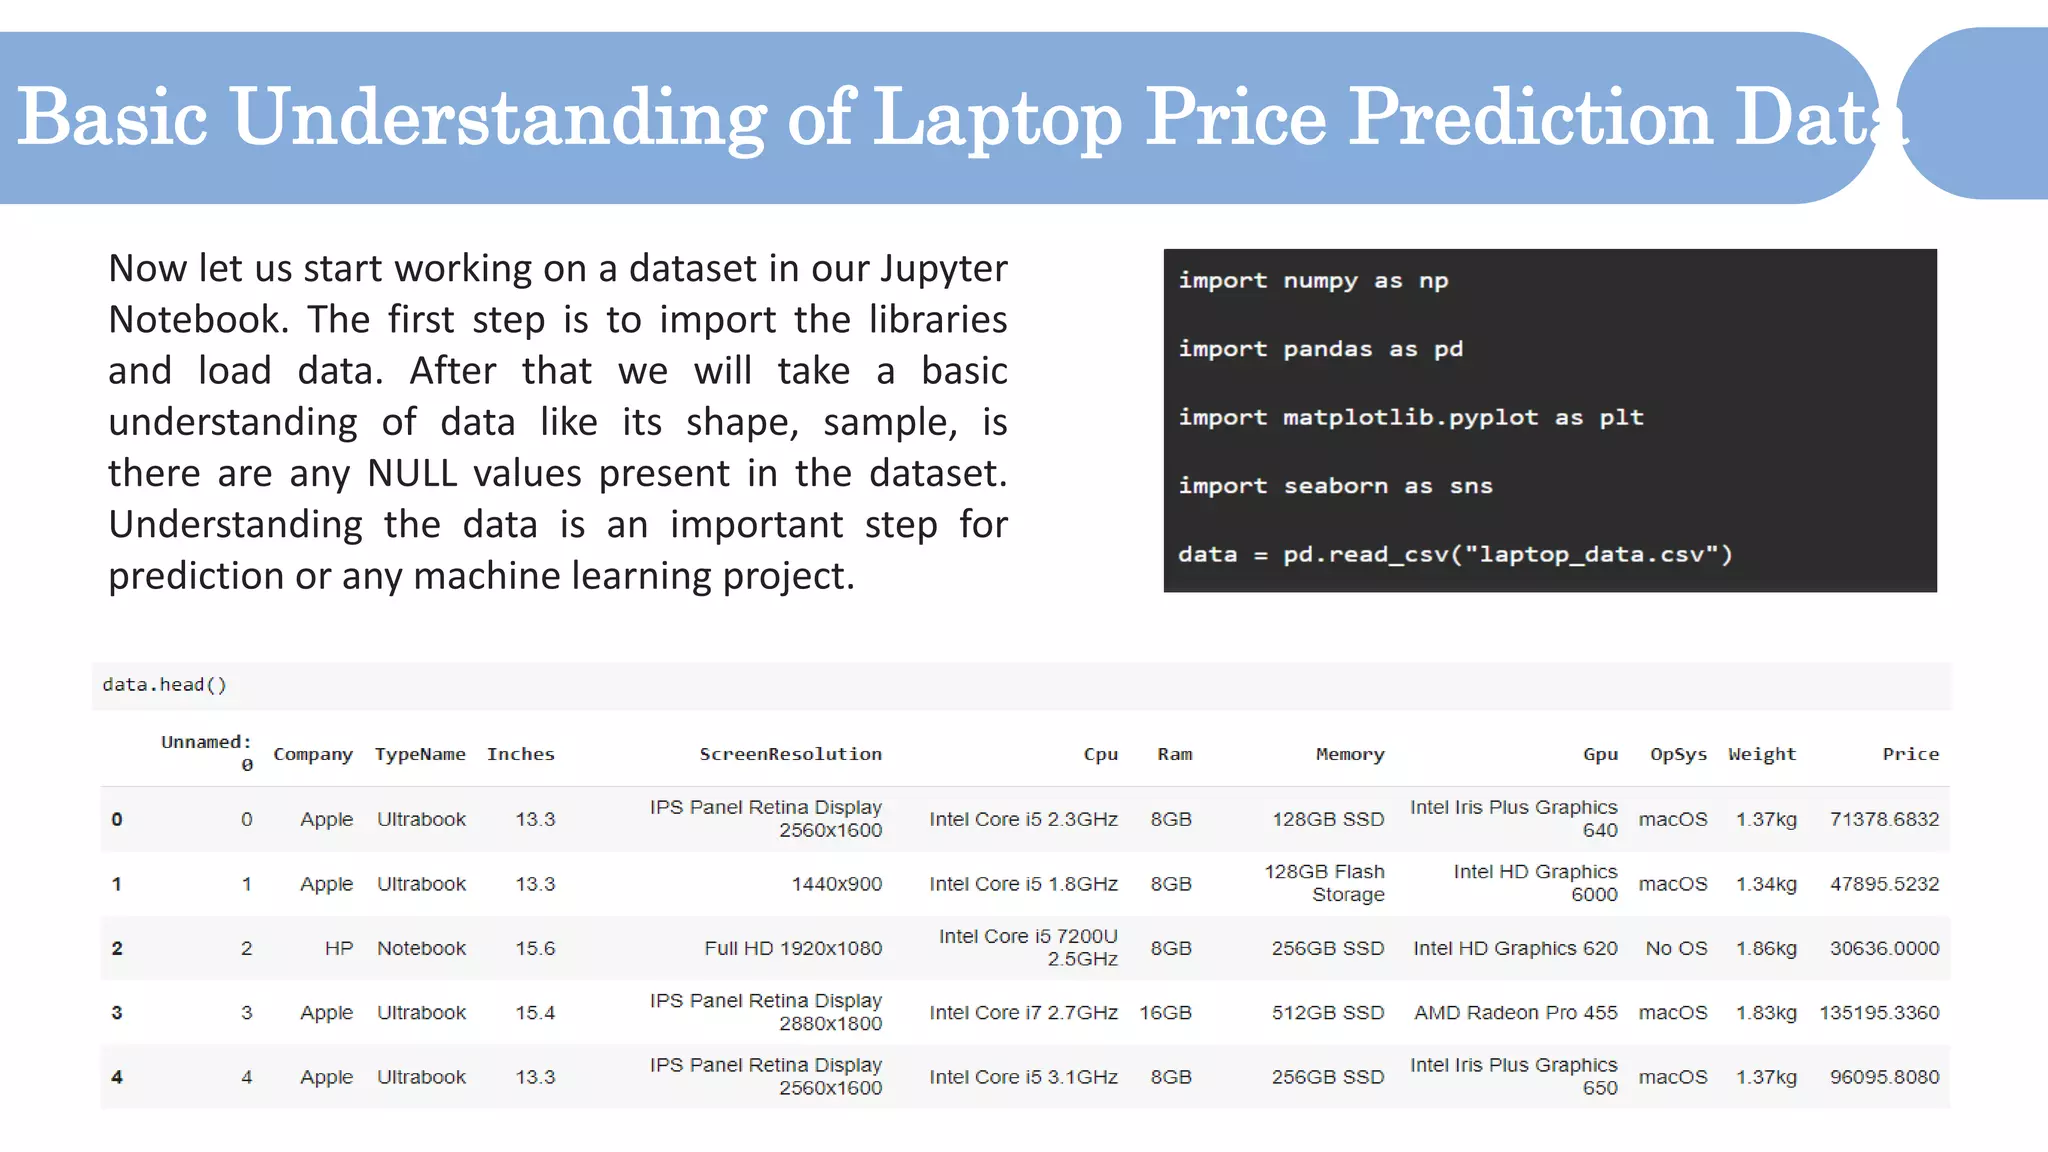
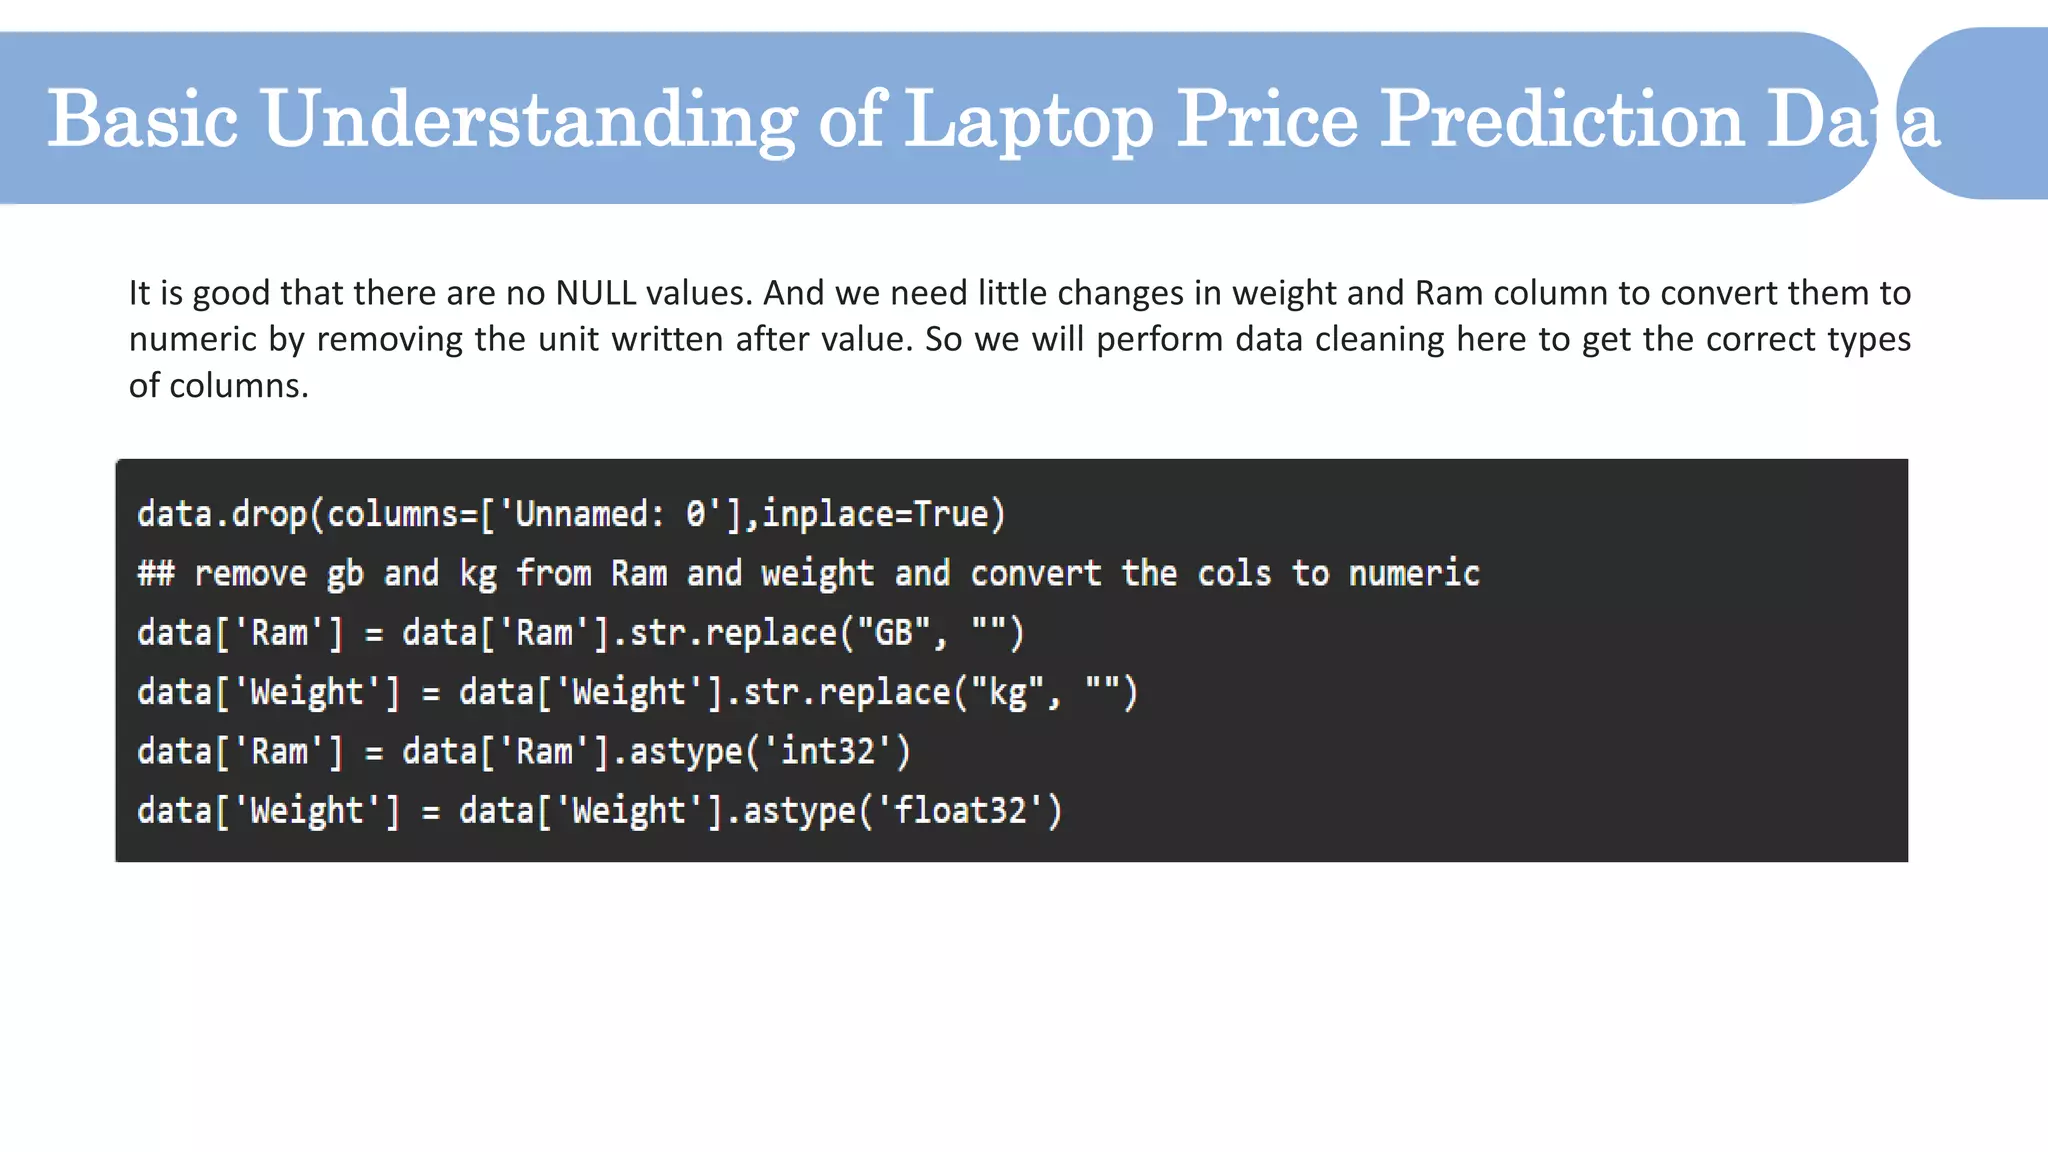
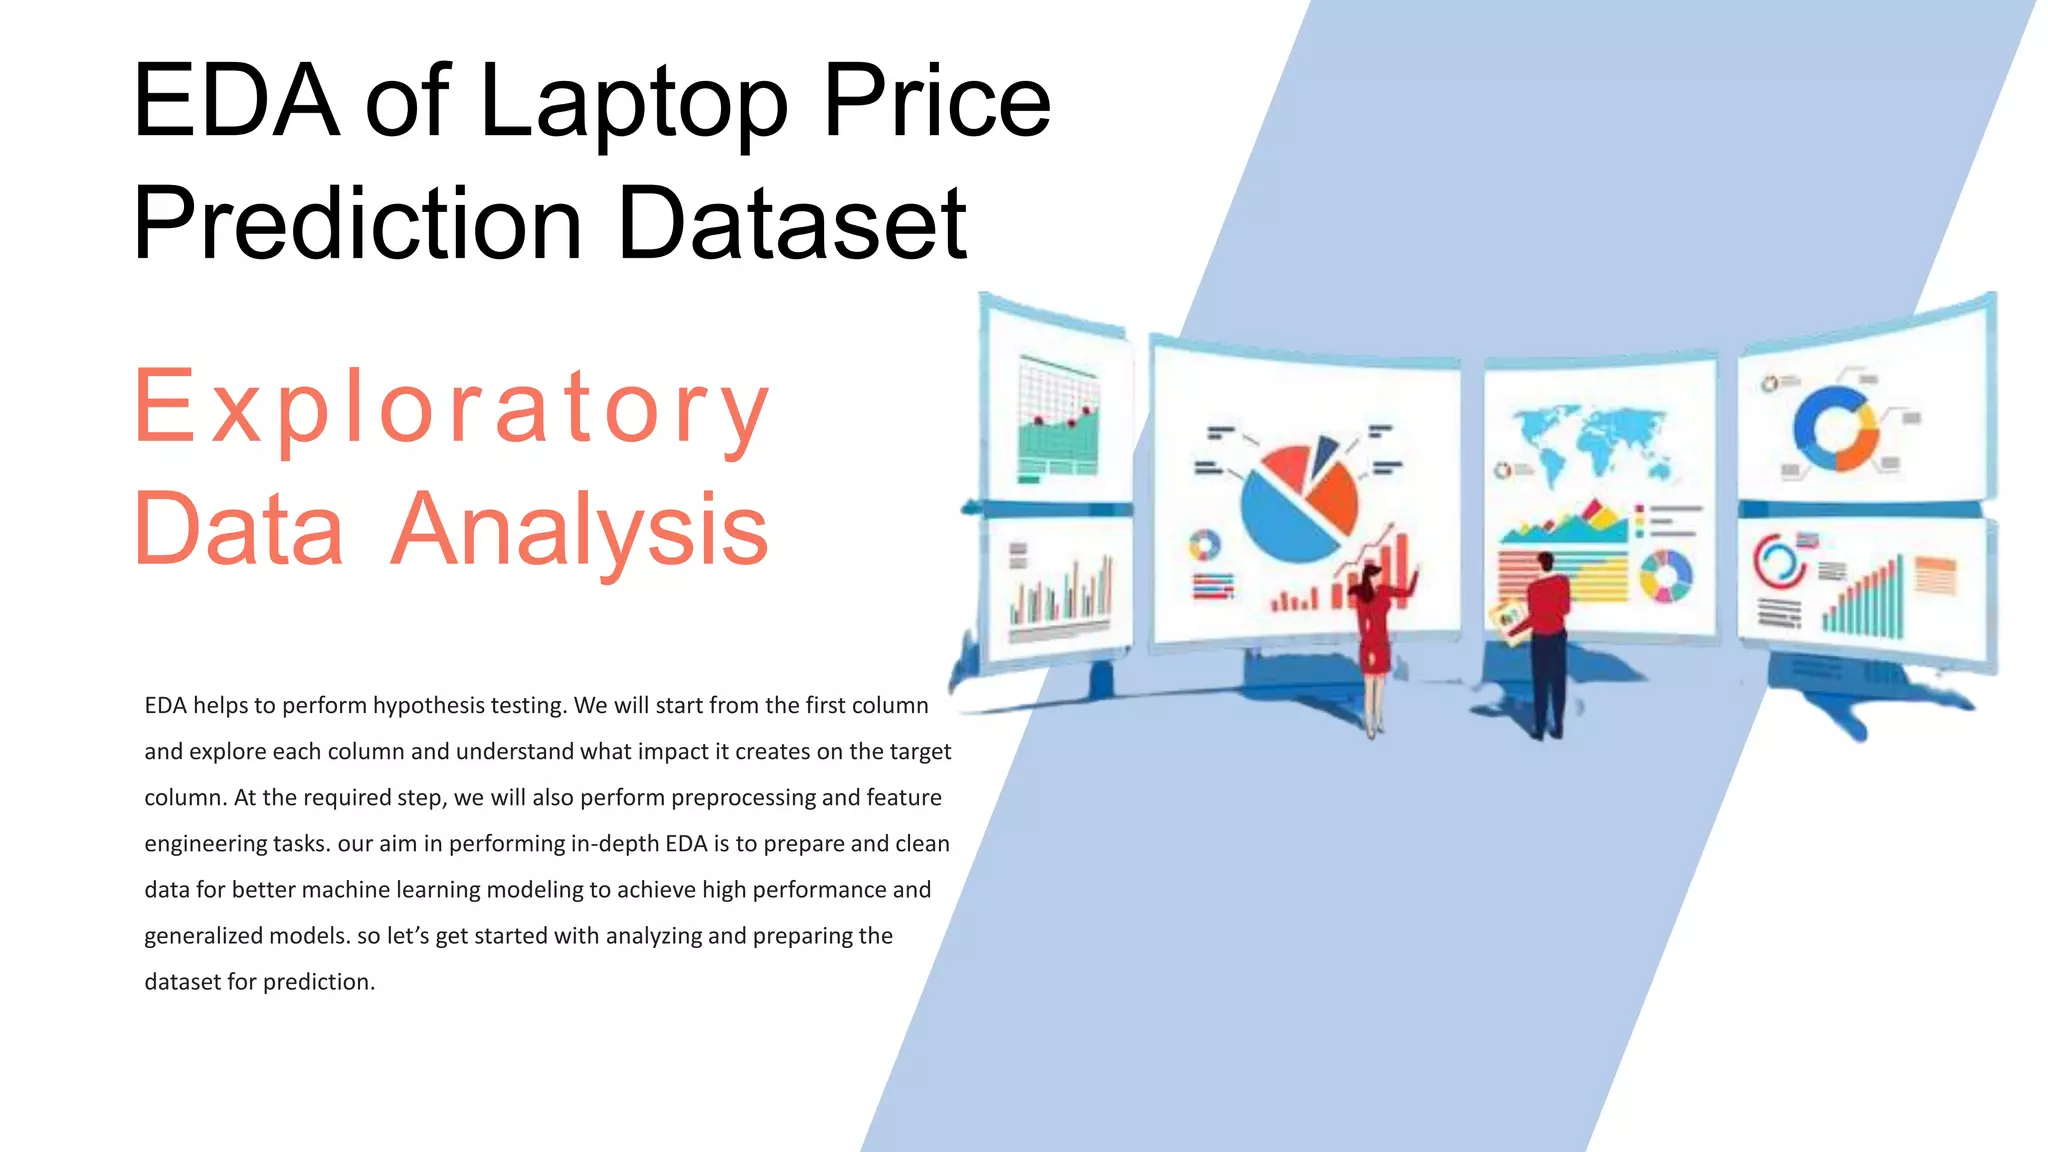
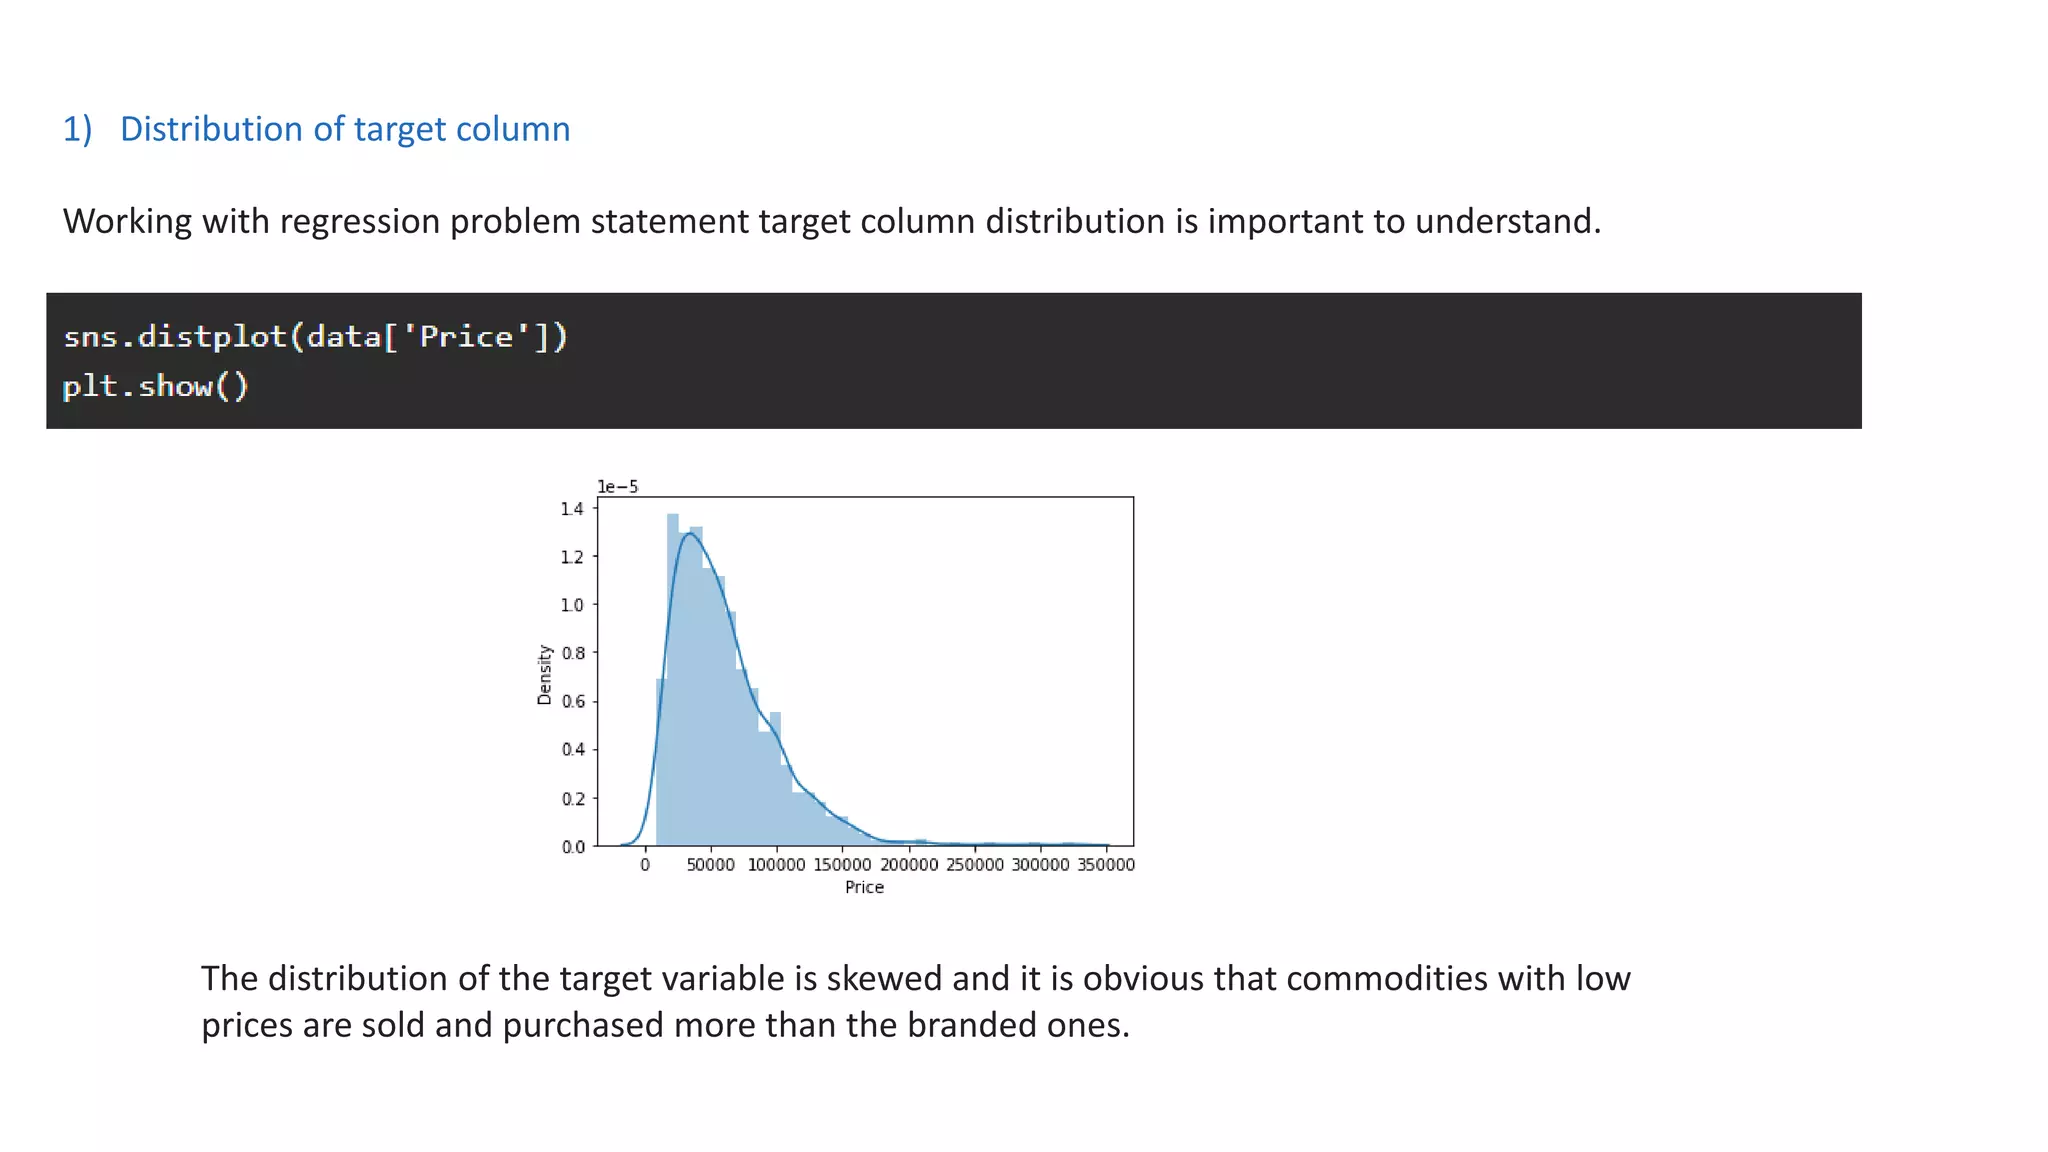
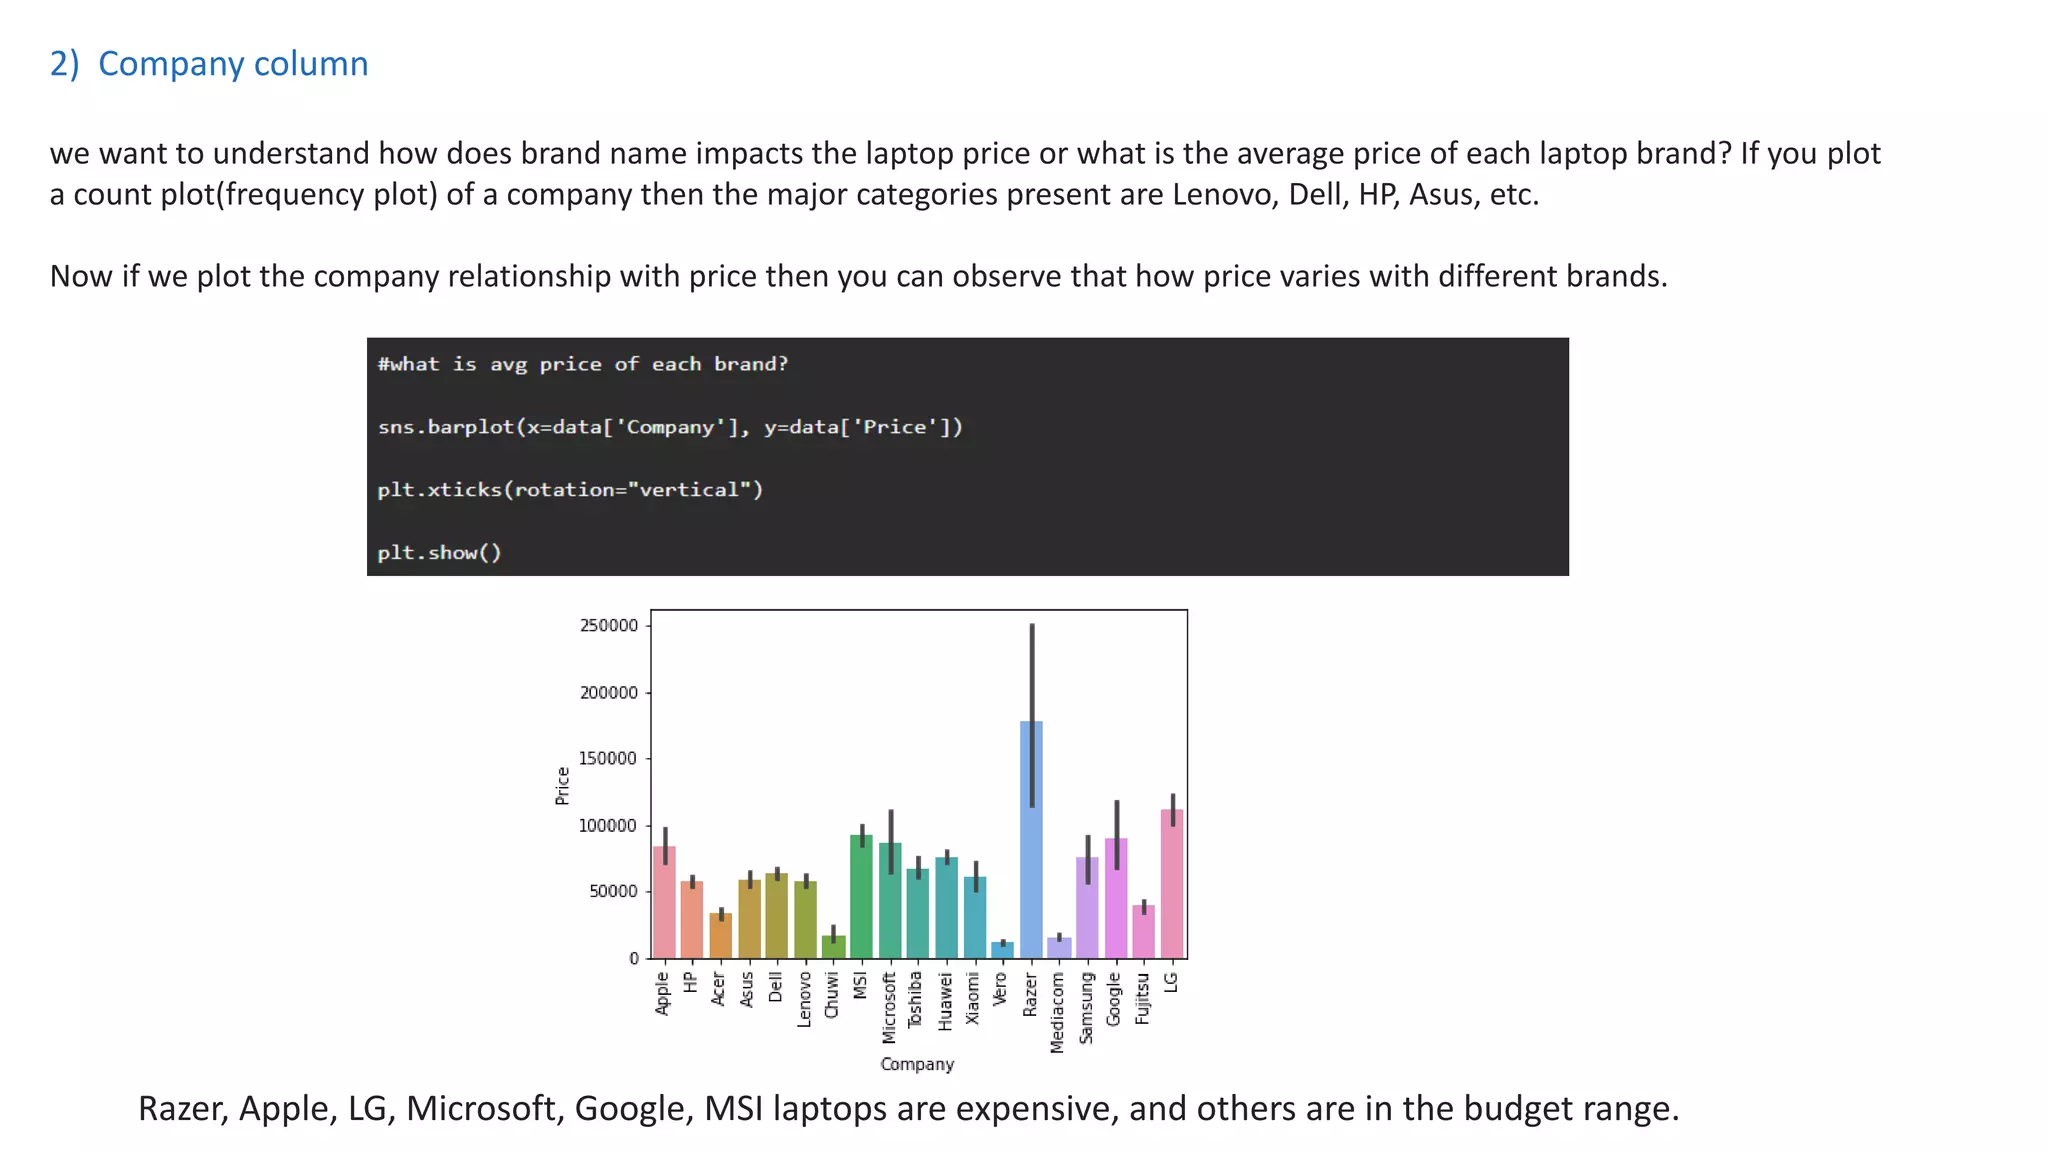
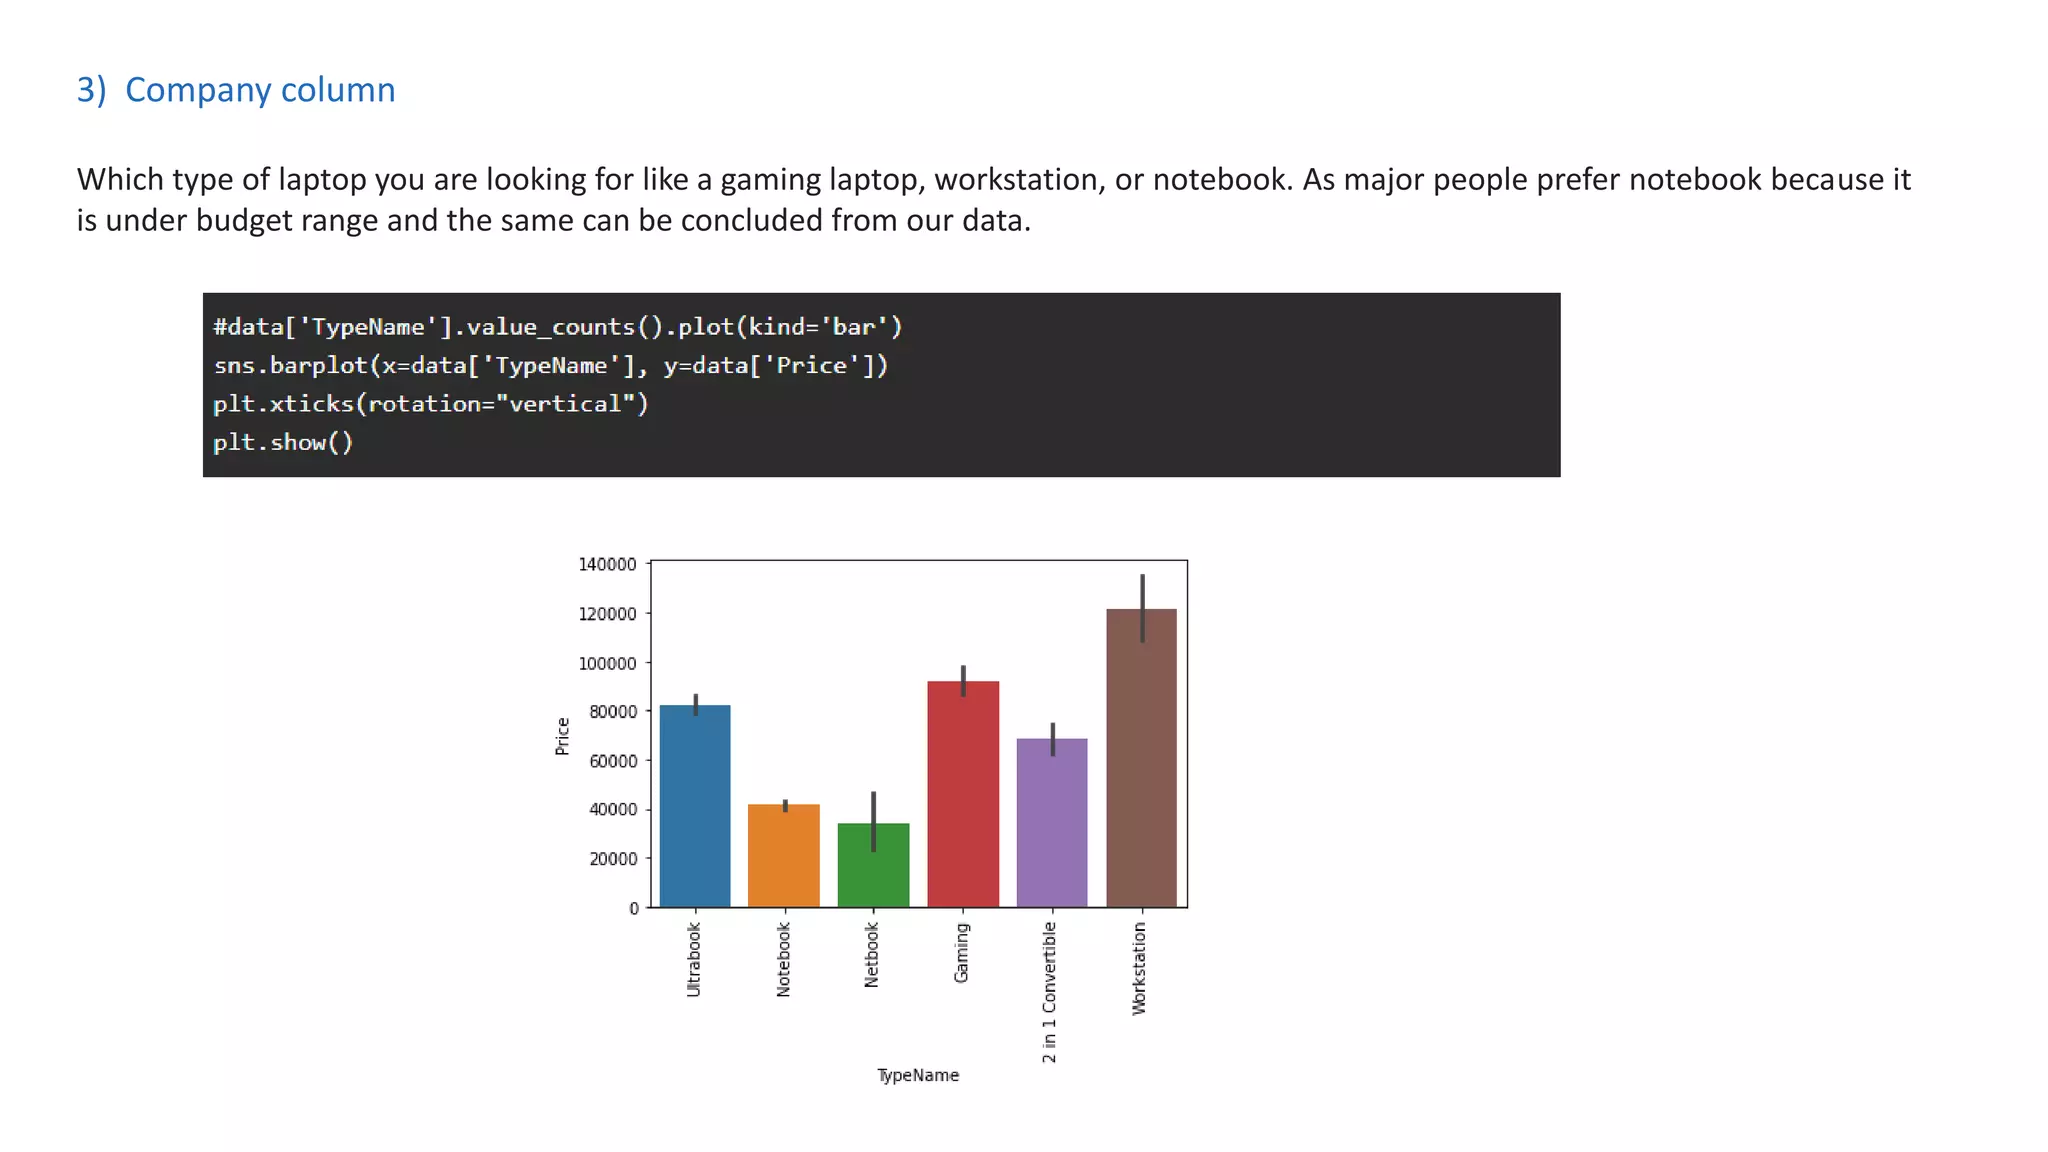
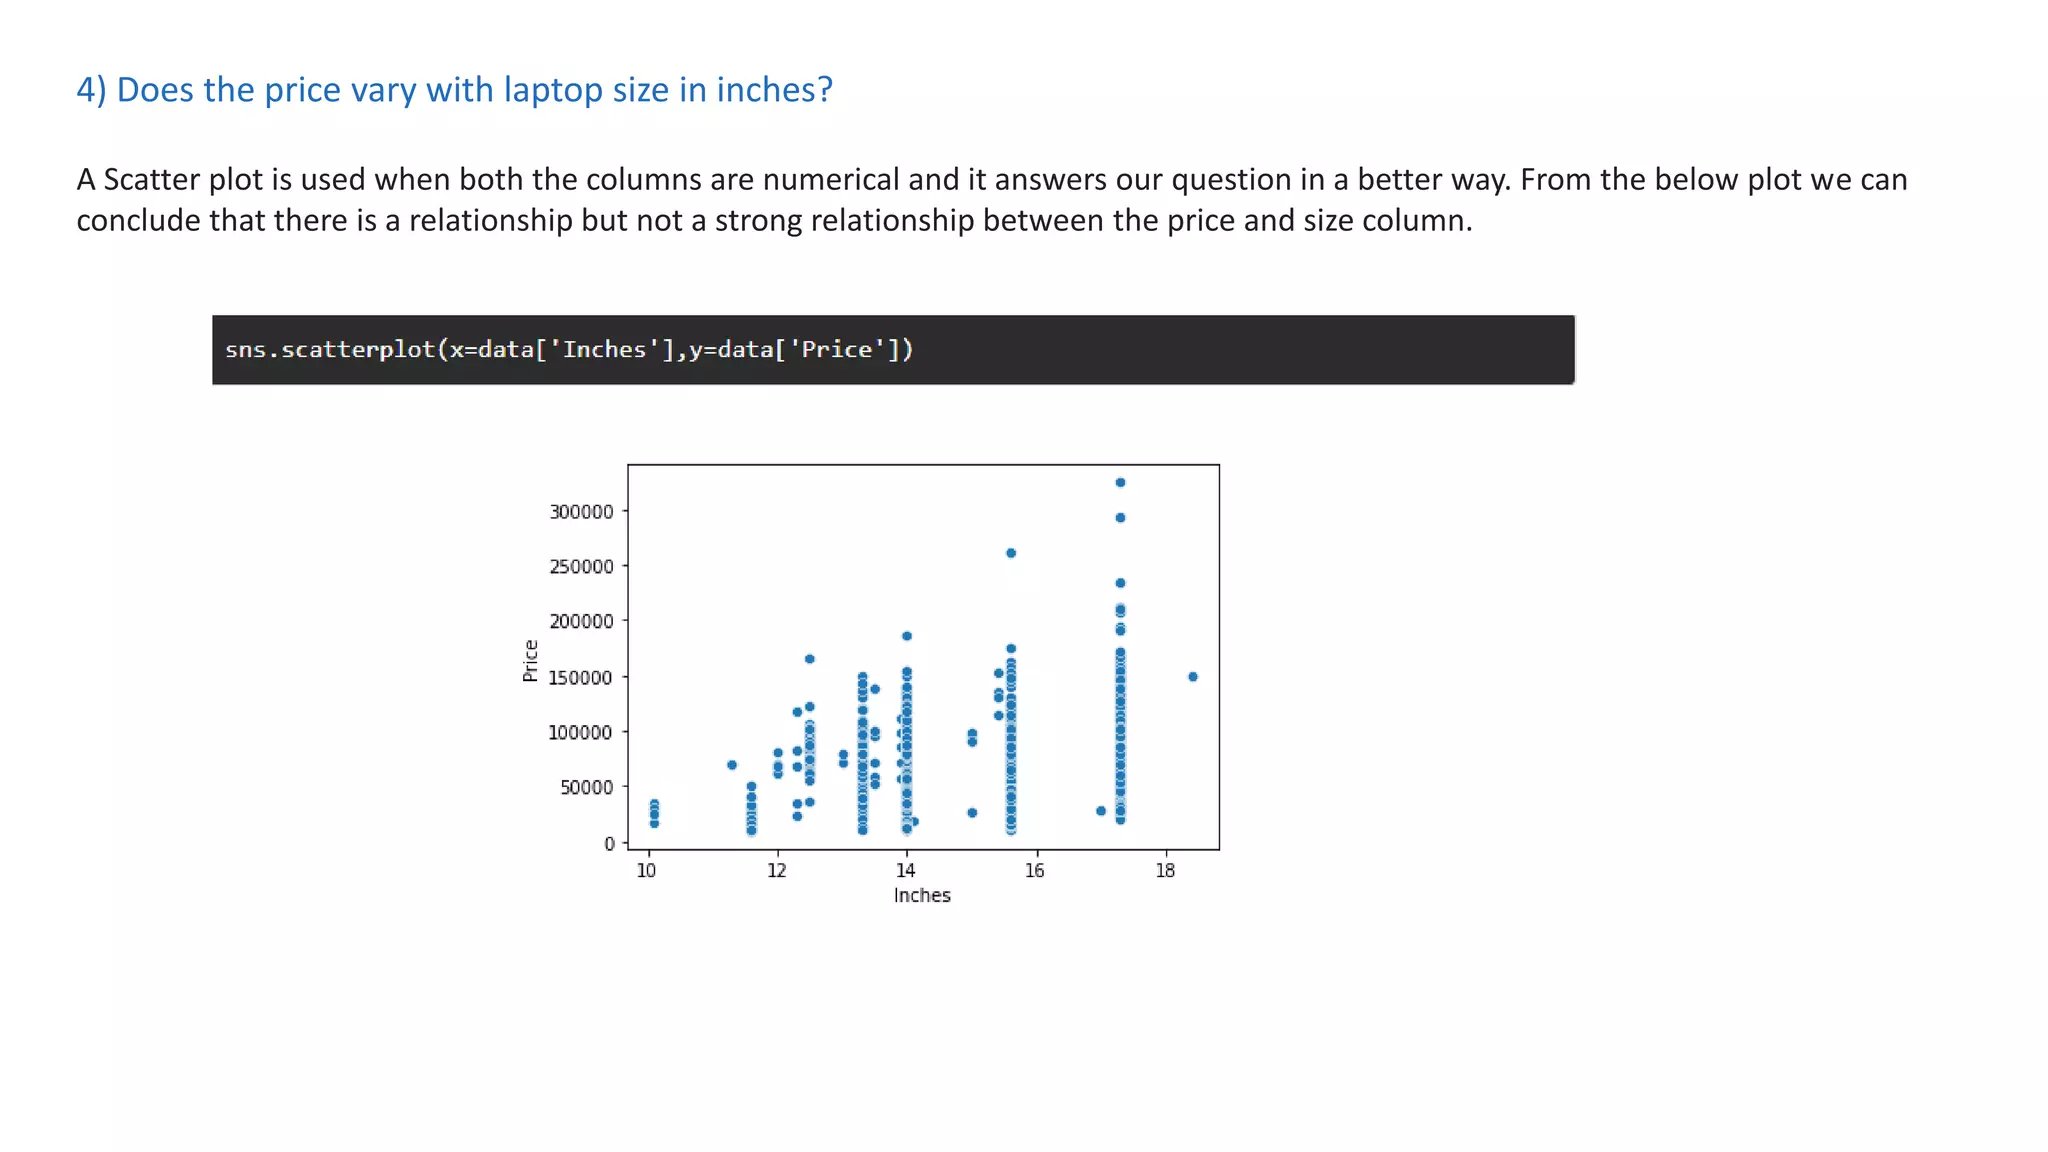
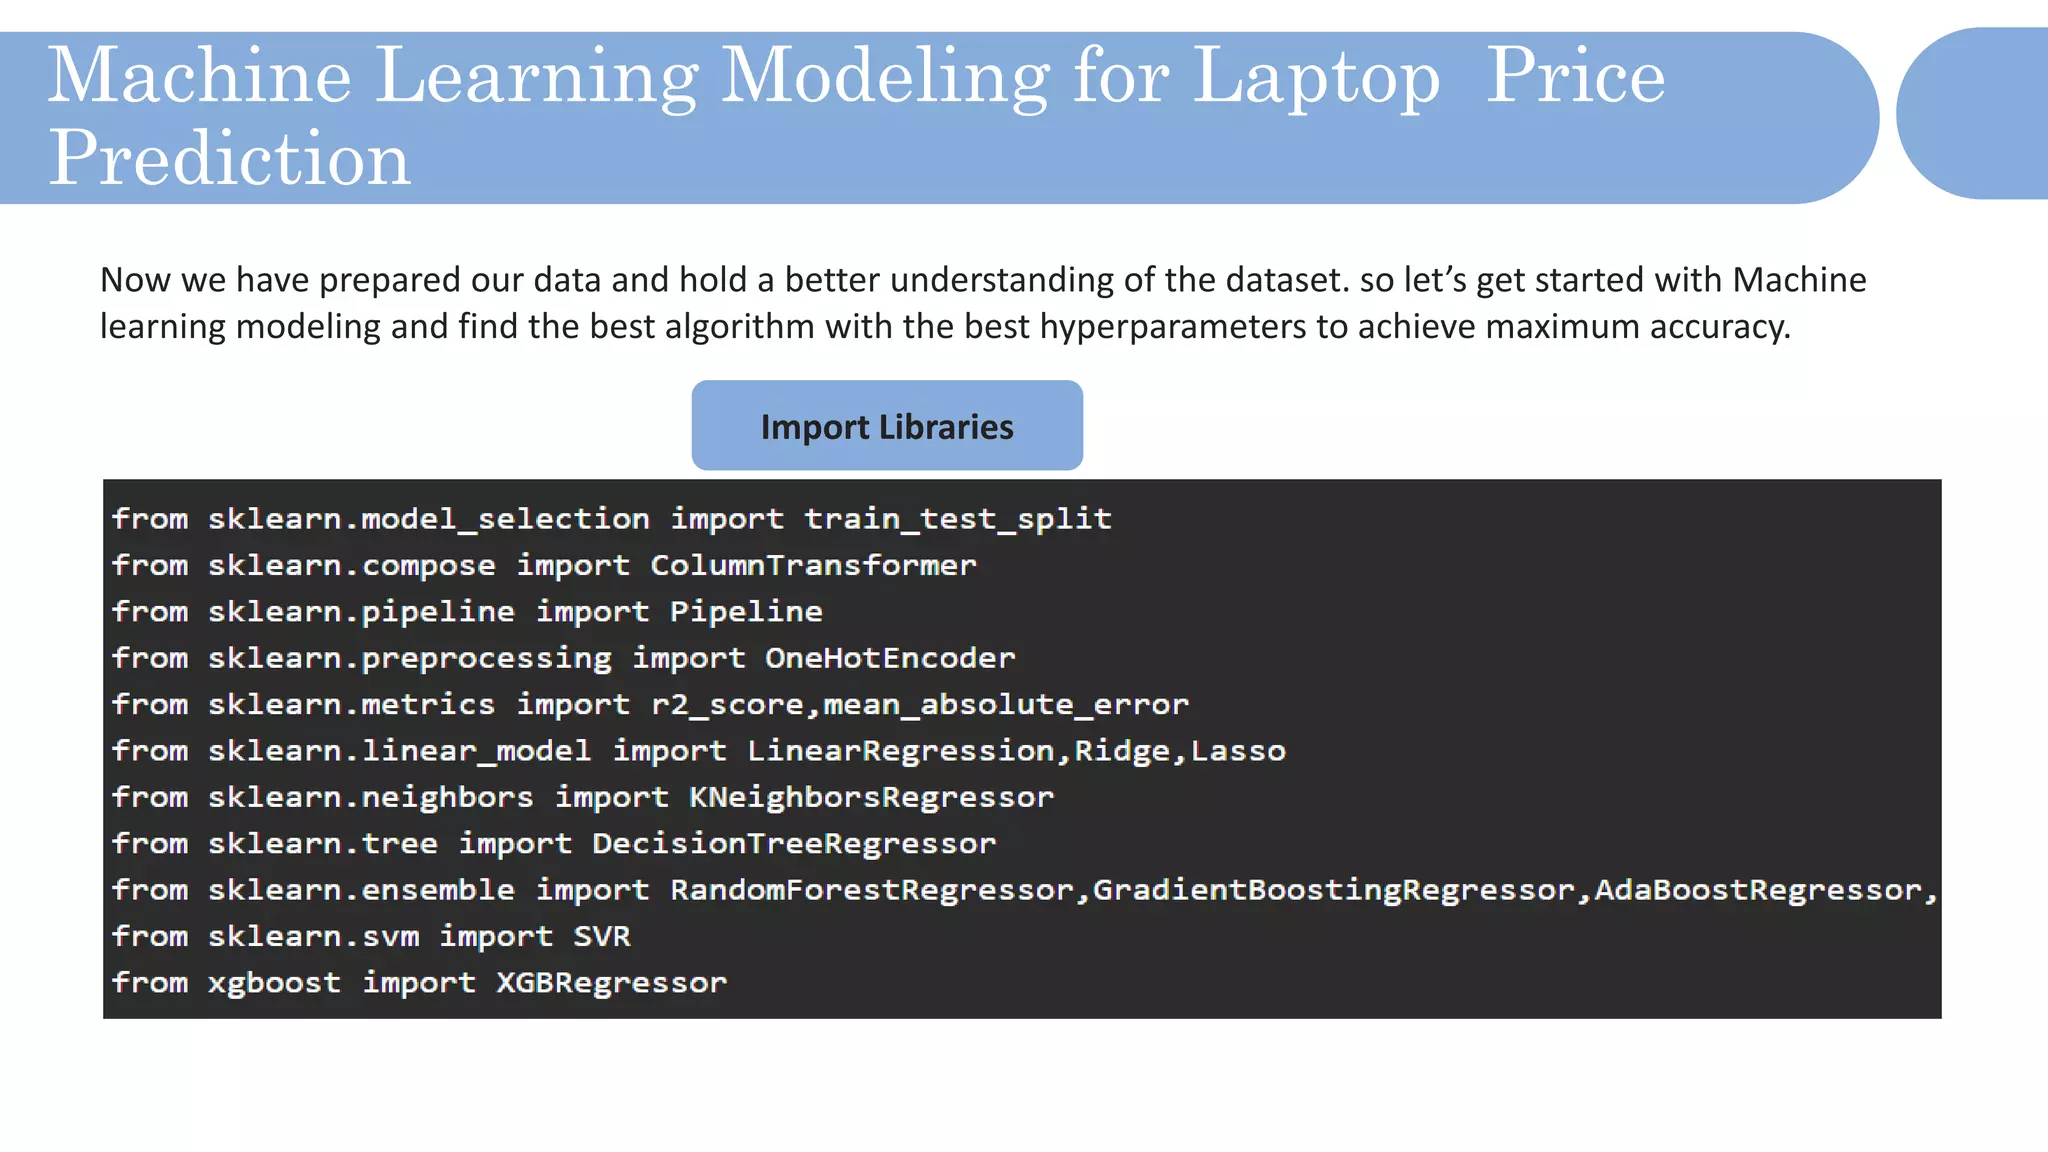
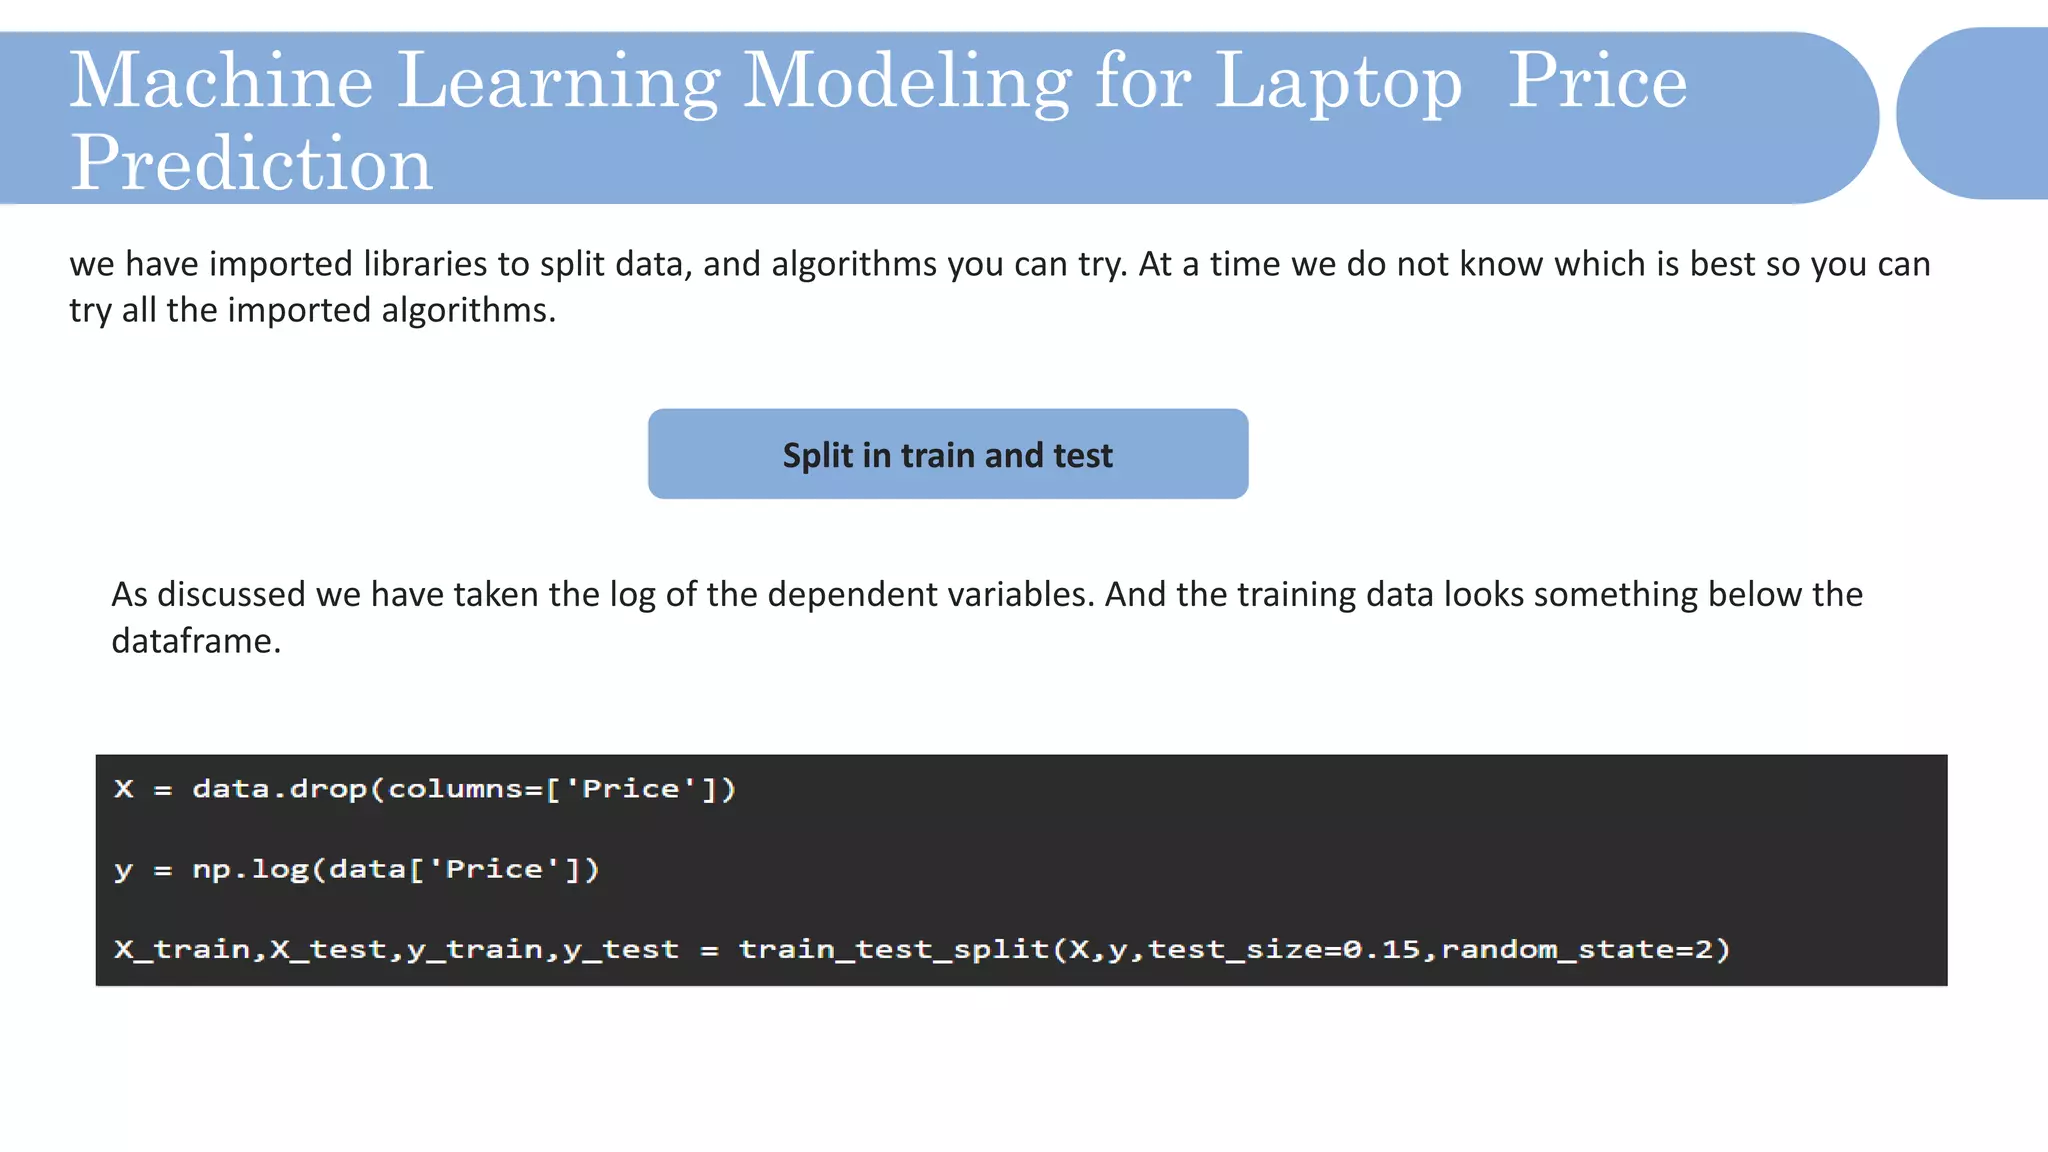
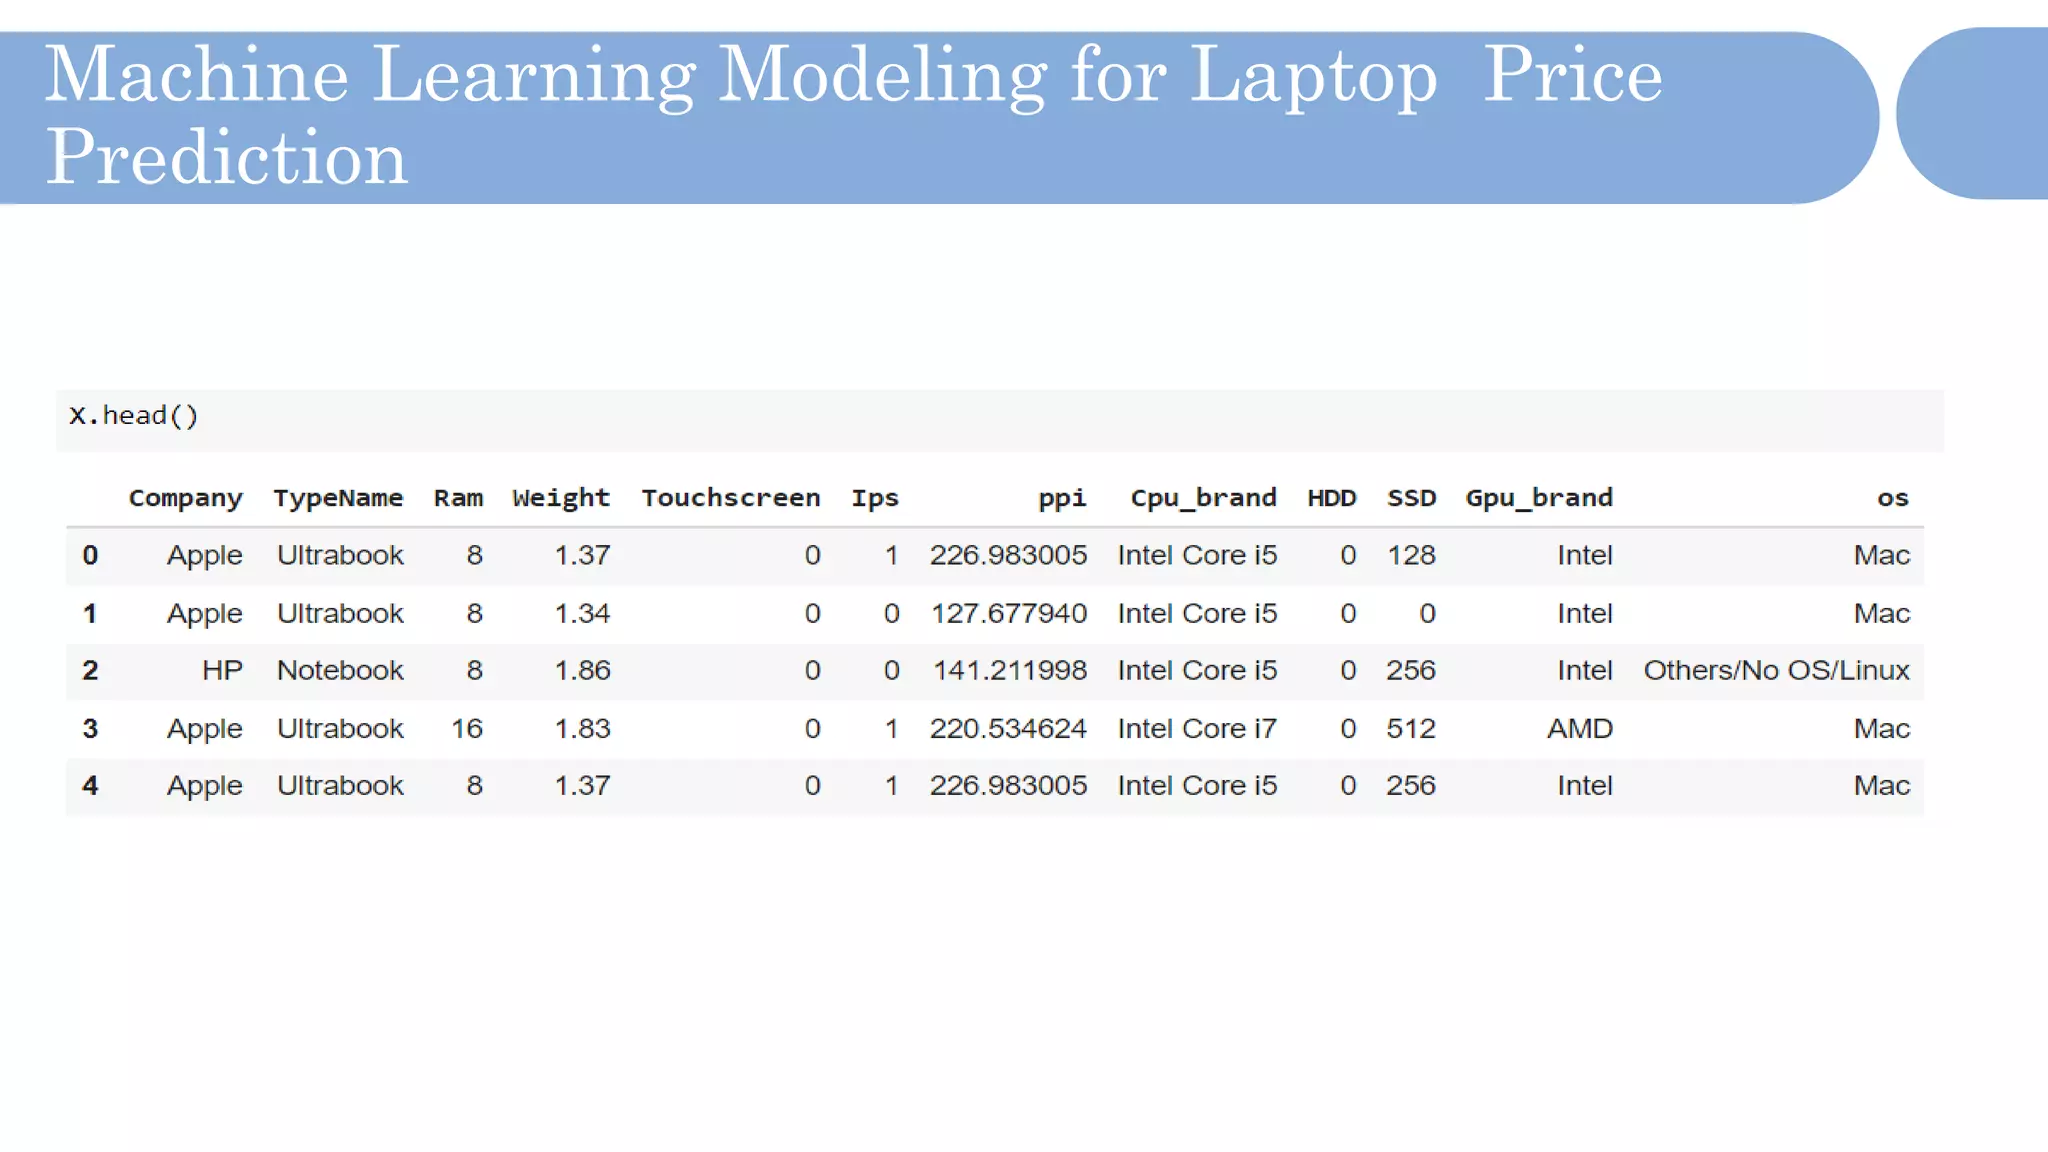
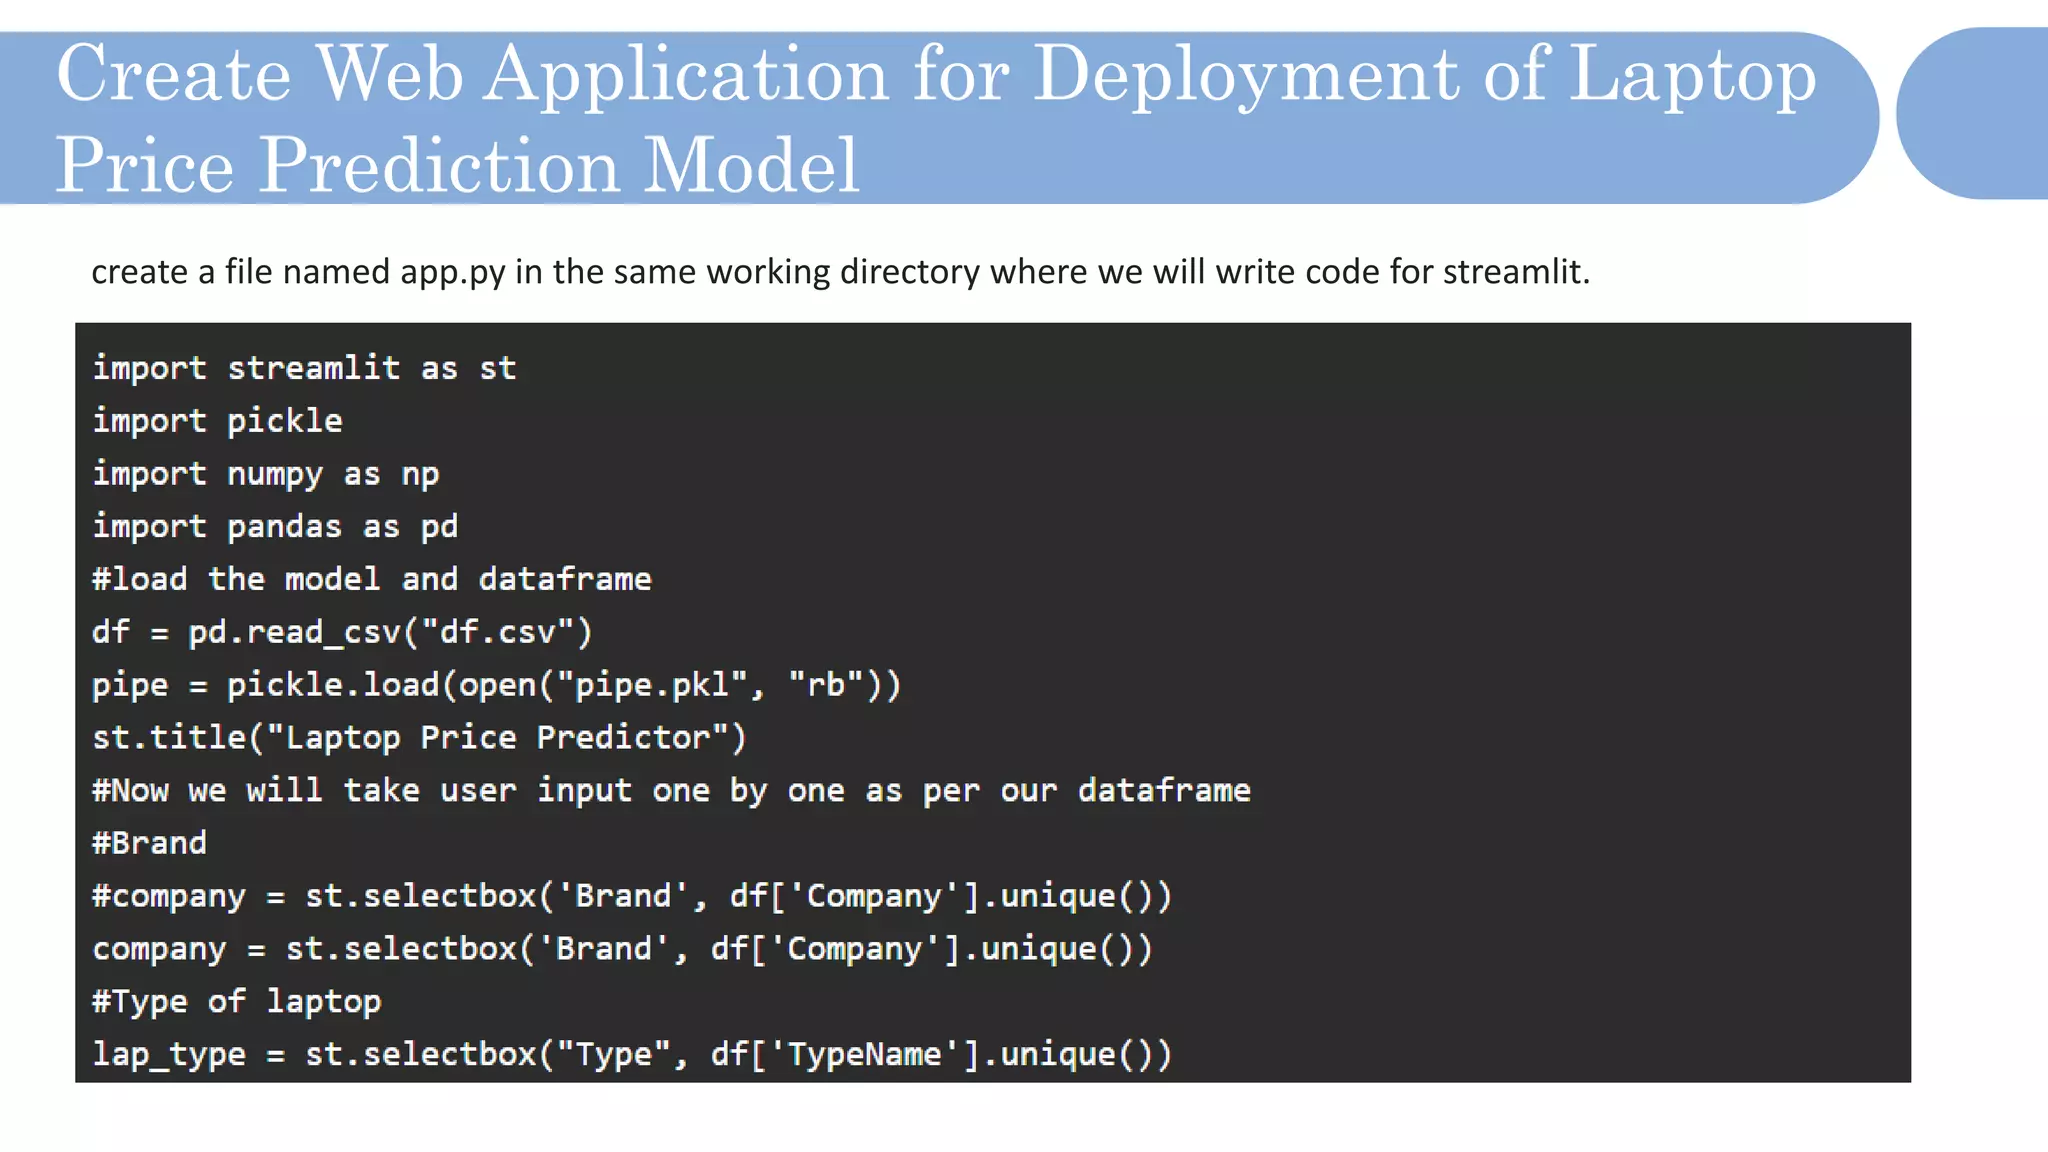
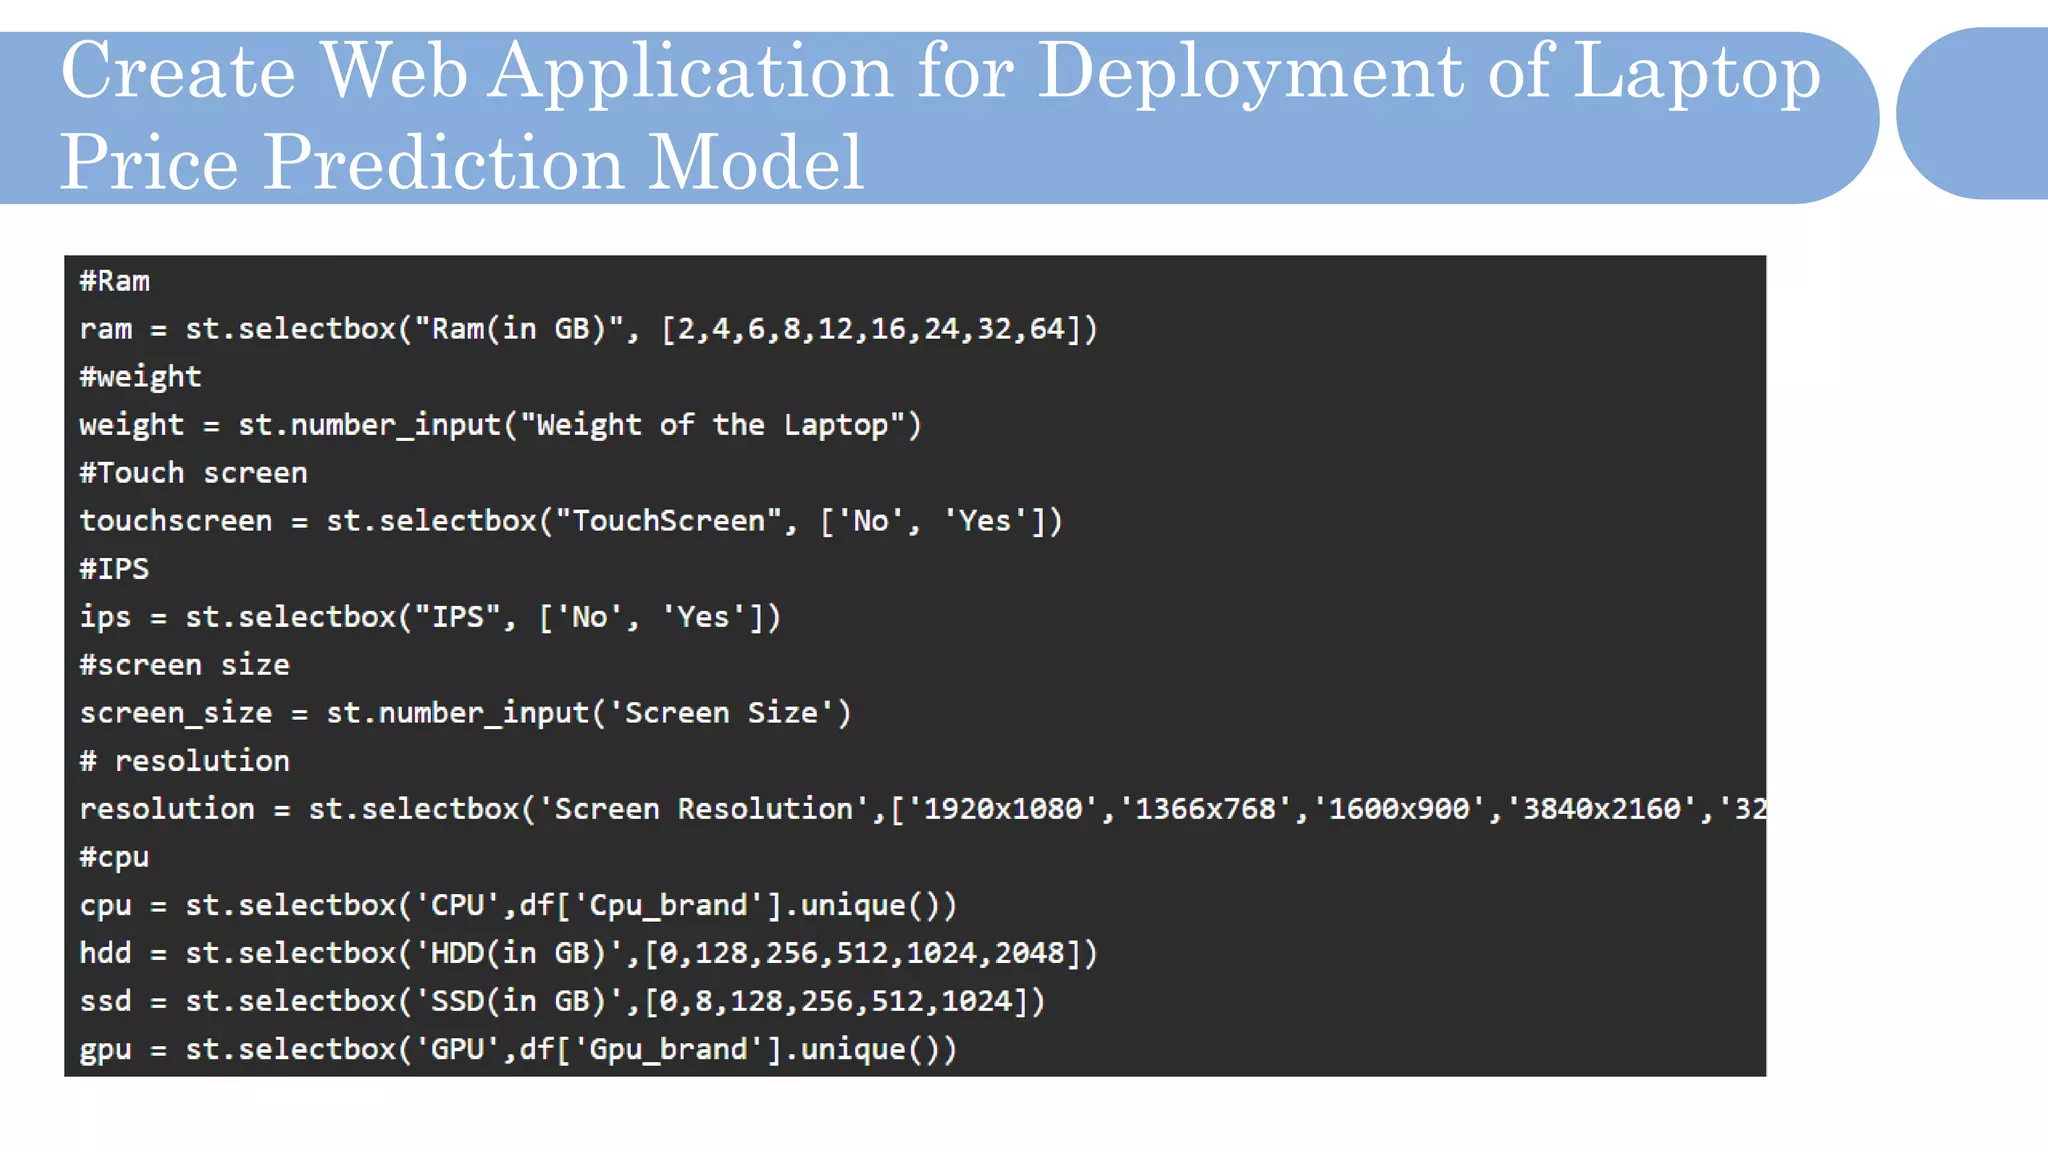
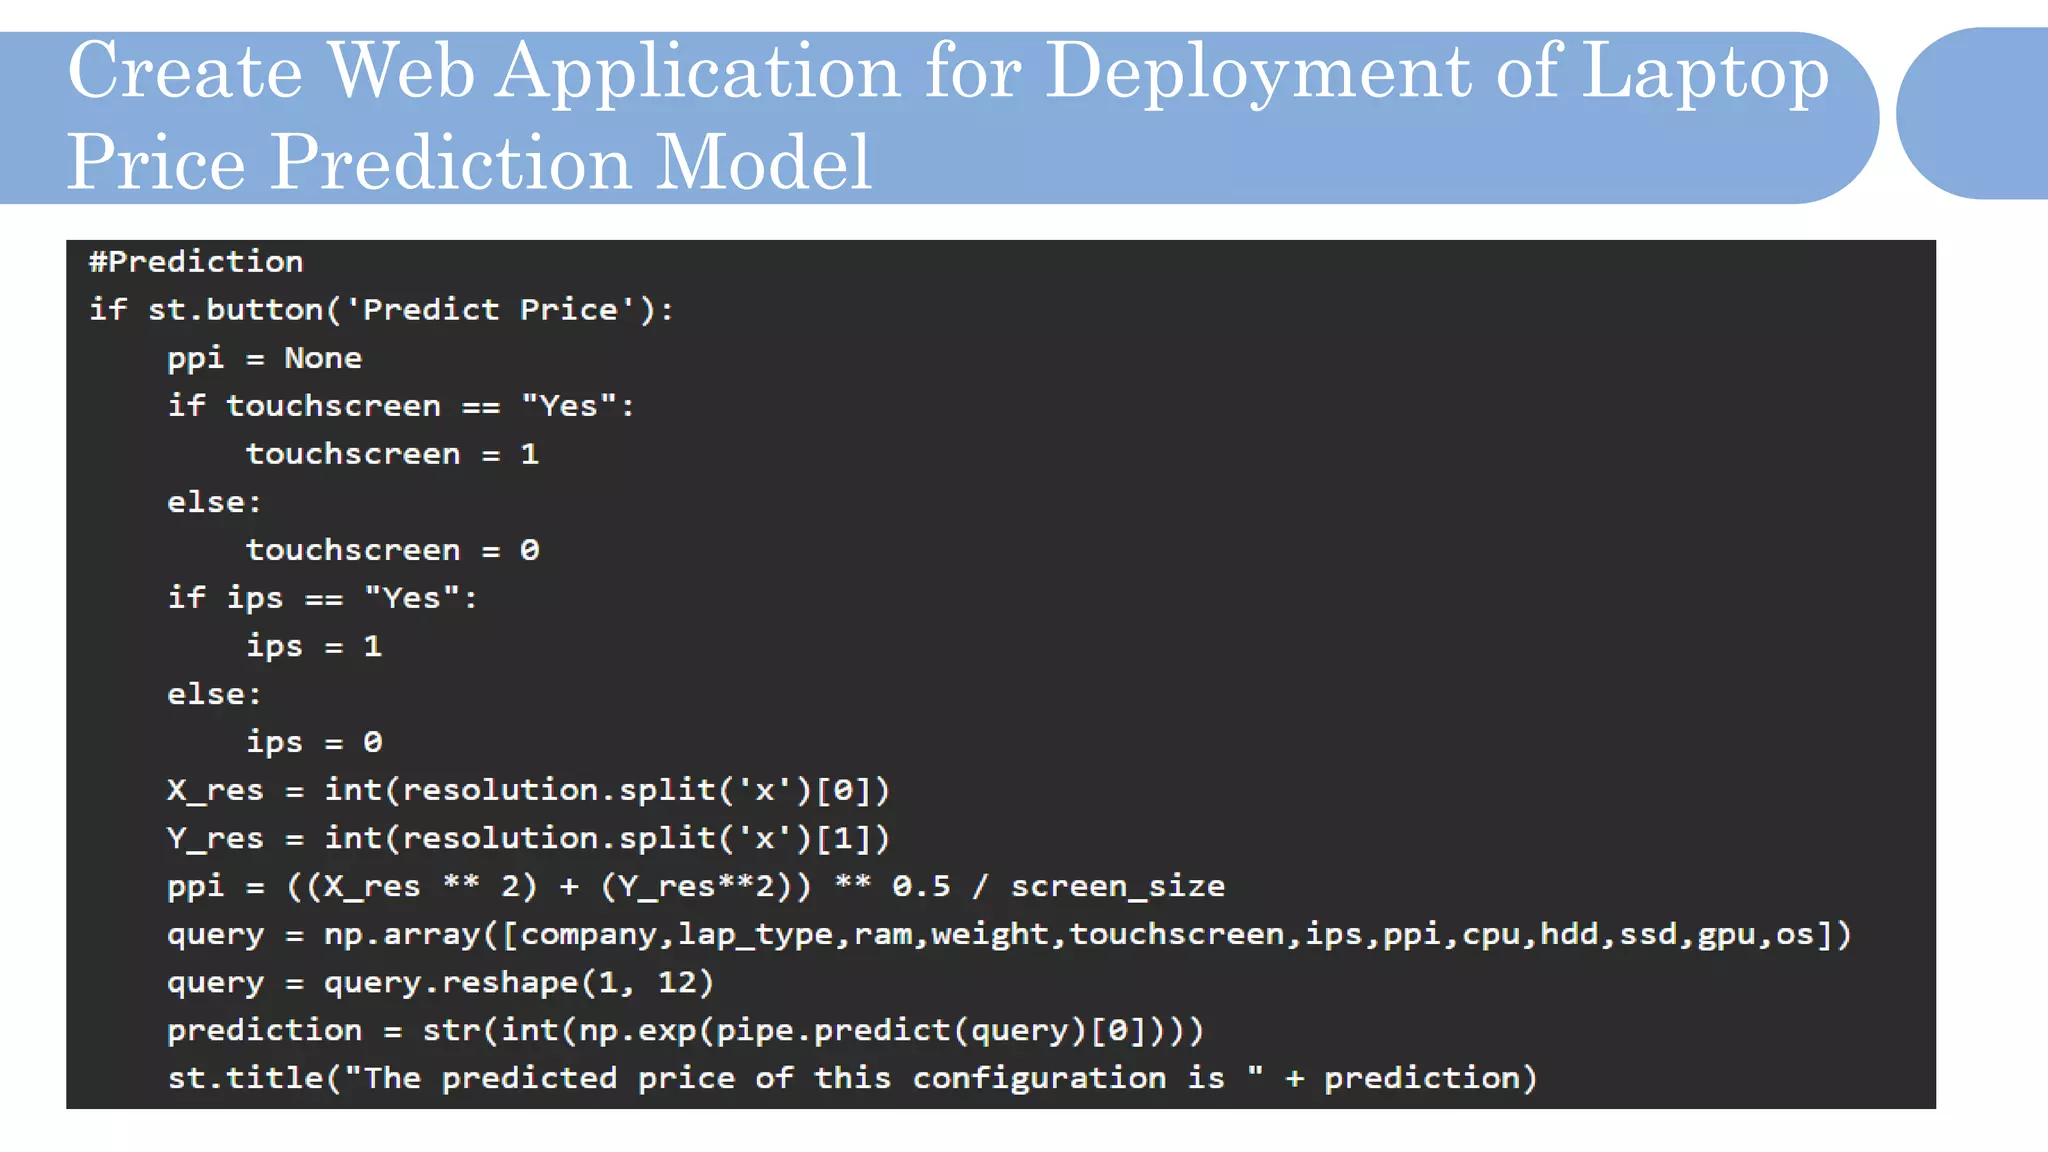
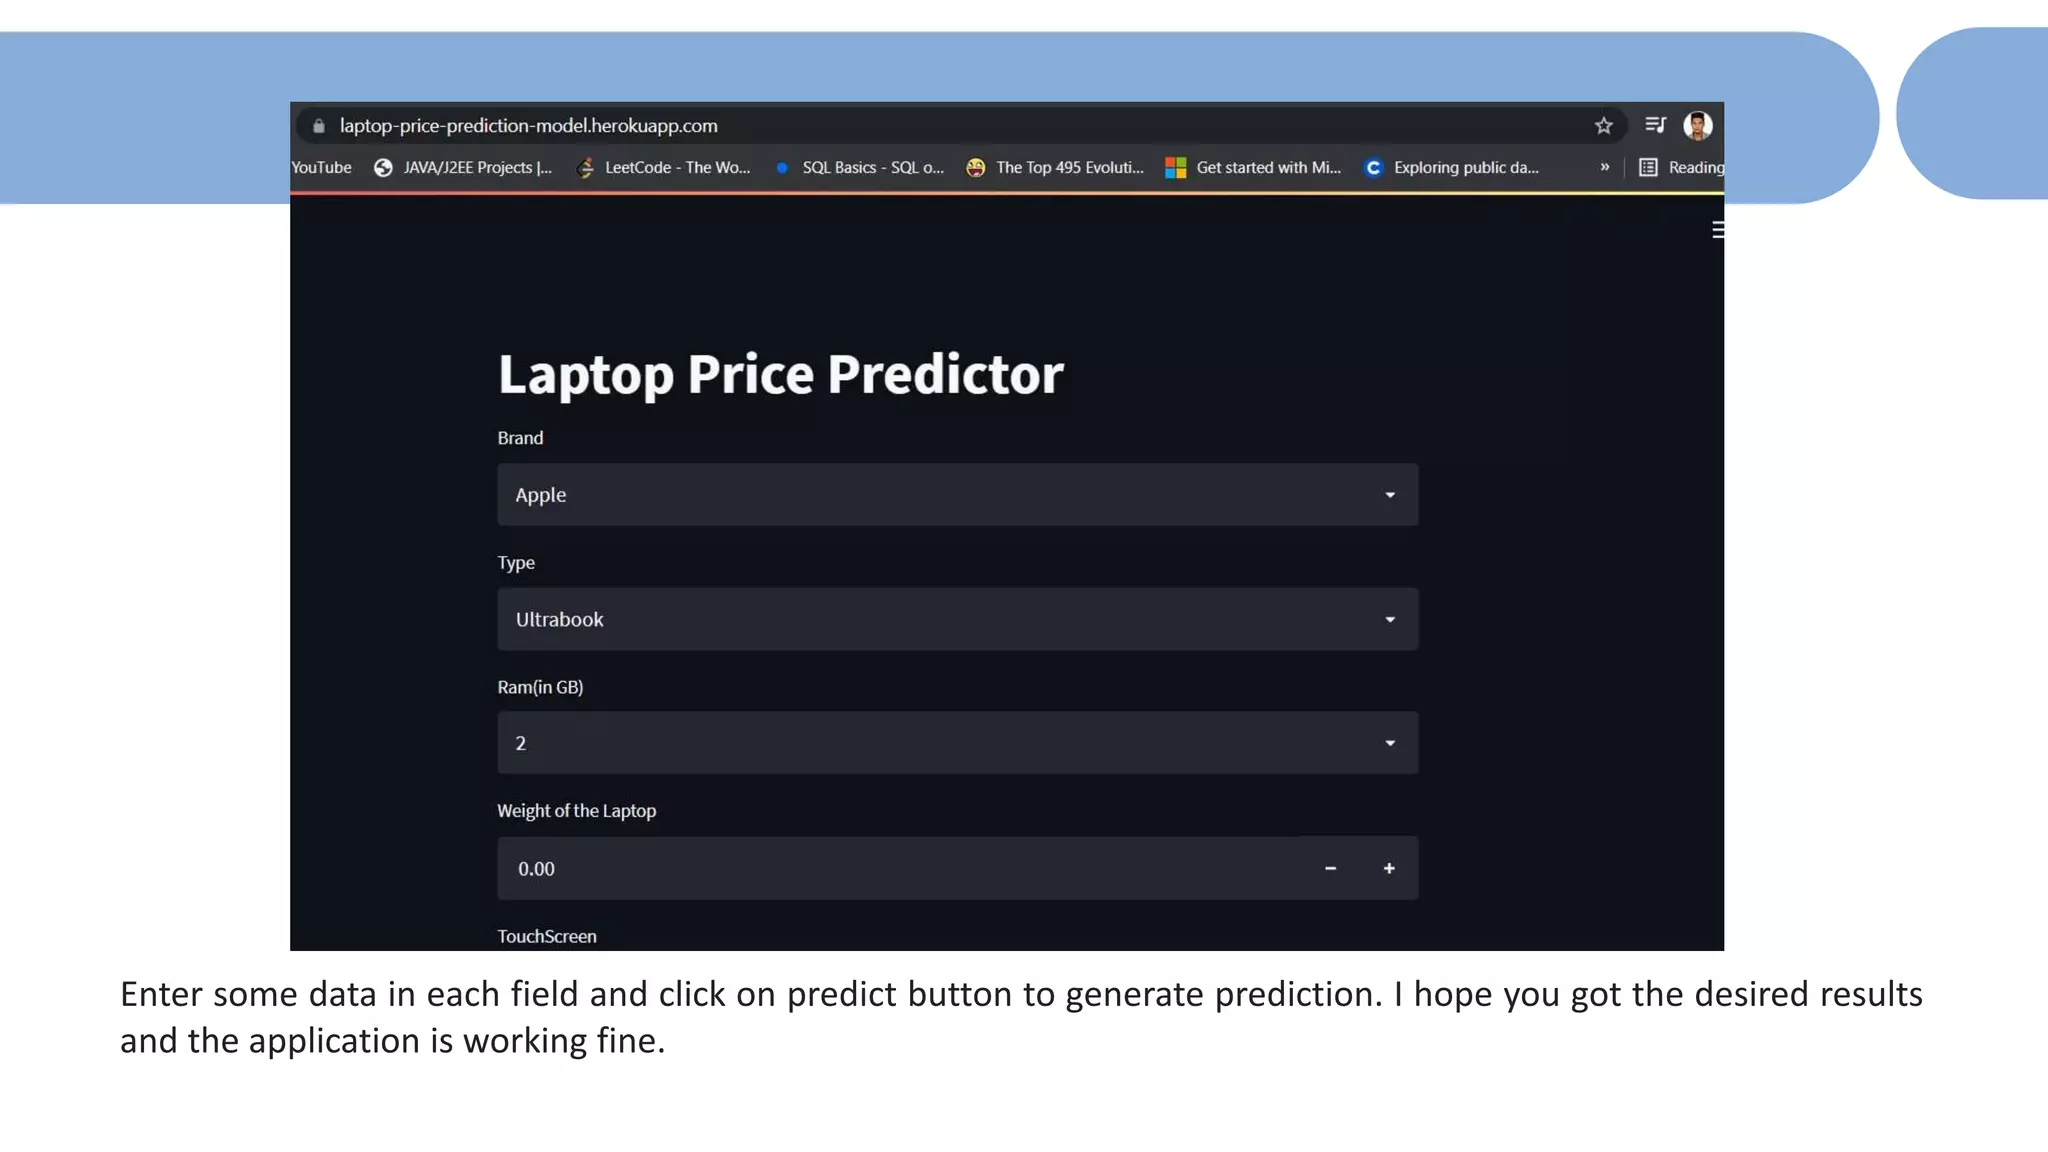
SlideShare a Scribd company logo
Laptop Price
Predictor
The Noob Entity (Group 07)
“Data is a precious
thing and will last
longer than the
systems themselves.”
- Tim Berners-Lee,
Inventor(World
Wide Web)
Group Members
(Group no7)
Sourabh Choudhary
2018521460107
Rashedin Islam
2018521460109
Harun Or Rashid
2018521460121
Md. Riaz Hassan
2018521460123
(Project Manager)
Contents
Describing Problem Statement
01
Overview about dataset
02
Data Cleaning
03
Exploratory Data Analysis
04
Feature Engineering
05
Machine learning Modeling
06
ML web app development
07
Deployment Machine learning app
08
P R O B L E M
S T A T E M E N T
Problem Statement for Laptop Price Prediction
We will make a project for Laptop price prediction. The problem statement is that if any
user wants to buy a laptop then our application should be compatible to provide a
tentative price of laptop according to the user configurations.
Although it looks like a simple project or just developing a model, the dataset we have is
noisy and needs lots of feature engineering, and preprocessing that will drive your interest
in developing this project.
Data Set for Laptop Prediction
Most of the columns in a dataset are noisy and contain lots of information. But with feature engineering you
do, you will get more good results. The only problem is we are having less data but we will obtain a good
accuracy over it. The only good thing is it is better to have a large data. we will develop a website that could
predict a tentative price of a laptop based on user configuration.
Data Set
Basic Understanding of Laptop Price Prediction Data
Now let us start working on a dataset in our Jupyter
Notebook. The first step is to import the libraries
and load data. After that we will take a basic
understanding of data like its shape, sample, is
there are any NULL values present in the dataset.
Understanding the data is an important step for
prediction or any machine learning project.
Basic Understanding of Laptop Price Prediction Data
It is good that there are no NULL values. And we need little changes in weight and Ram column to convert them to
numeric by removing the unit written after value. So we will perform data cleaning here to get the correct types
of columns.
EDA helps to perform hypothesis testing. We will start from the first column
and explore each column and understand what impact it creates on the target
column. At the required step, we will also perform preprocessing and feature
engineering tasks. our aim in performing in-depth EDA is to prepare and clean
data for better machine learning modeling to achieve high performance and
generalized models. so let’s get started with analyzing and preparing the
dataset for prediction.
Exploratory
Data Analysis
EDA of Laptop Price
Prediction Dataset
1) Distribution of target column
Working with regression problem statement target column distribution is important to understand.
The distribution of the target variable is skewed and it is obvious that commodities with low
prices are sold and purchased more than the branded ones.
2) Company column
we want to understand how does brand name impacts the laptop price or what is the average price of each laptop brand? If you plot
a count plot(frequency plot) of a company then the major categories present are Lenovo, Dell, HP, Asus, etc.
Now if we plot the company relationship with price then you can observe that how price varies with different brands.
Razer, Apple, LG, Microsoft, Google, MSI laptops are expensive, and others are in the budget range.
3) Company column
Which type of laptop you are looking for like a gaming laptop, workstation, or notebook. As major people prefer notebook because it
is under budget range and the same can be concluded from our data.
4) Does the price vary with laptop size in inches?
A Scatter plot is used when both the columns are numerical and it answers our question in a better way. From the below plot we can
conclude that there is a relationship but not a strong relationship between the price and size column.
5) Screen Resolution
Screen resolution contains lots of information. Before any analysis first, we need to perform feature engineering over it. If you observe unique values of
the column then we can see that all value gives information related to the presence of an IPS panel, are a laptop touch screen or not, and the X-axis
and Y-axis screen resolution. So, we will extract the column into 3 new columns in the dataset.
Feature Engineering and Preprocessing of Laptop Price Prediction Model
Feature engineering is a process to convert raw data to meaningful information. there are many methods that come under feature engineering
like transformation, categorical encoding, etc. Now the columns we have are noisy so we need to perform some feature engineering steps.
Extract Touch screen information
It is a binary variable so we can encode it as 0 and 1. one means the laptop is a touch screen and zero indicates not a touch screen.
If we plot the touch screen column against price then laptops with touch screens are expensive which is true in real life.
Extract IPS Channel presence information
It is a binary variable and the code is the same we used above. The laptops with IPS channel are present less in our data but by observing relationship against
the price of IPS channel laptops are high.
Extract X-axis and Y-axis screen resolution dimensions
Now both the dimension are present at end of a string and separated with a cross sign. So first we will split the string with space and access the last string
from the list. then split the string with a cross sign and access the zero and first index for X and Y-axis dimensions.
Replacing inches, X and Y resolution to PPI
If you find the correlation of columns with price using the corr method then we can see that inches do not have a strong correlation but X and Y-axis
resolution have a very strong resolution so we can take advantage of it and convert these three columns to a single column that is known as Pixel per
inches(PPI). In the end, our goal is to improve the performance by having fewer features.
Now when you will see the correlation of price then PPI is having a strong correlation.
So now we can drop the extra columns which are not of use. At this point, we have started keeping the important columns in
our dataset.
6) CPU column
If you observe the CPU column then it also contains lots of information. If you again use a unique function or value counts function on the CPU column
then we have 118 different categories. The information it gives is about preprocessors in laptops and speed.
To extract the preprocessor we need to extract the first three words from the string. we are having an Intel preprocessor and AMD preprocessor so we are
keeping 5 categories in our dataset as i3, i5, i7, other intel processors, and AMD processors.
How does the price vary with processors?
We can again use our bar plot property to answer this question. And as obvious the price of i7 processor
is high, then of i5 processor, i3 and AMD processor lies at the almost the same range. Hence price will
depend on the preprocessor.
8) Memory Column
Memory column is again a noisy column that gives an understanding of hard drives. many laptops came with HHD and SSD both, as well in some there
is an external slot present to insert after purchase. This column can disturb your analysis if not feature engineer it properly. So If you use value counts
on a column then we are having 4 different categories of memory as HHD, SSD, Flash storage, and hybrid.
First, we have cleaned the memory column and then made 4 new columns which are a binary column where each column contains 1 and 0 indicate that amount four is present
and which is not present. Any laptop has a single type of memory or a combination of two. so in the first column, it consists of the first memory size and if the second slot is
present in the laptop then the second column contains it else we fill the null values with zero. After that in a particular column, we have multiplied the values by their binary
value. It means that if in any laptop particular memory is present then it contains binary value as one and the first value will be multiplied by it, and same with the second
combination. For the laptop which does have a second slot, the value will be zero multiplied by zero is zero.
Now when we see the correlation of price then Hybrid and flash storage have very less or no correlation with a price. We will drop this column with CPU and memory which is no
longer required.
9) GPU Variable
GPU(Graphical Processing Unit) has many categories in data. We are having which brand graphic card is there on a laptop. we are not
having how many capacities like (6Gb, 12 Gb) graphic card is present. so we will simply extract the name of the brand.
If you use the value counts function then there is a row with GPU of ARM so we have removed that row and after
extracting the brand GPU column is no longer needed.
10) Operating System Column
There are many categories of operating systems. we will keep all windows categories in one, Mac in one, and remaining in others.
This is a simple and most used feature engineering method, you can try something else if you find more correlation with price.
when you plot price against operating system then as usual Mac is most expensive.
Log-Normal Transformation
We saw the distribution of the target variable above which was right-skewed. By transforming it to normal distribution performance of
the algorithm will increase. we take the log of values that transform to the normal distribution which you can observe below. So while
separating dependent and independent variables we will take a log of price, and in displaying the result perform exponent of it.
Machine Learning Modeling for Laptop Price
Prediction
Now we have prepared our data and hold a better understanding of the dataset. so let’s get started with Machine
learning modeling and find the best algorithm with the best hyperparameters to achieve maximum accuracy.
Import Libraries
we have imported libraries to split data, and algorithms you can try. At a time we do not know which is best so you can
try all the imported algorithms.
Machine Learning Modeling for Laptop Price
Prediction
Split in train and test
As discussed we have taken the log of the dependent variables. And the training data looks something below the
dataframe.
Machine Learning Modeling for Laptop Price
Prediction
Machine Learning Modeling for Laptop Price
Prediction
Now we implement a pipeline to streamlit the training and testing process. first, we use a column transformer to
encode categorical variables which is step one. After that, we create an object of our algorithm and pass both steps to
the pipeline. using pipeline objects we predict the score on new data and display the accuracy.
Implement Pipeline for training and testing
Machine Learning Modeling for Laptop Price
Prediction
Machine Learning Modeling for Laptop Price
Prediction
In the first step for categorical encoding, we passed the index of columns to encode, and pass-through means pass the
other numeric columns as it is. The best accuracy I got is with all-time favorite Random Forest. But you can use this
code again by changing the algorithm and its parameters. I am showing Random forest. you can do Hyperparameter
tuning using GridsearchCV or Random Search CV. we can also do feature scaling but it does not create any impact on
Random Forest.
Machine Learning Modeling for Laptop Price
Prediction
Exporting the Model
Now we have done with modeling. we will save the pipeline object for the development of the project website. we will
also export the data frame which will be required to create dropdowns in the website.
Create Web Application for Deployment of Laptop
Price Prediction Model
Now we will use streamlit to create a web app to predict laptop prices. In a web application, we need to implement
a form that takes all the inputs from users that we have used in a dataset, and by using the dumped model we
predict the output and display it to a user.
Streamlit
Streamlit is an open-source web framework written in Python. It is the fastest way to create data apps and it is
widely used by data science practitioners to deploy machine learning models. To work with this it is not
important to have any knowledge of frontend languages.
Streamlit contains a wide variety of functionalities, and an in-built function to meet your requirement. It
provides you with a plot map, flowcharts, slider, selection box, input field, the concept of caching, etc. install
streamlit using the below pip command.
Create Web Application for Deployment of Laptop
Price Prediction Model
create a file named app.py in the same working directory where we will write code for streamlit.
Create Web Application for Deployment of Laptop
Price Prediction Model
Create Web Application for Deployment of Laptop
Price Prediction Model
Create Web Application for Deployment of
Laptop Price Prediction Model
Explanation
First we load the data frame and model that we have saved. After that, we create an HTML form of each field based
on training data columns to take input from users. In categorical columns, we provide the first parameter as input field
name and second as select options which is nothing but the unique categories in the dataset. In the numerical field,
we provide users with an increase or decrease in the value.
After that, we created the prediction button, and whenever it is triggered it will encode some variable and prepare a
two-dimension list of inputs and pass it to the model to get the prediction that we display on the screen. Take the
exponential of predicted output because we have done a log of the output variable.
Now when you run the app file using the above command you will get two URL and it will automatically open the web
application in your default browser or copy the URL and open it. the application will look something like the below
figure.
Enter some data in each field and click on predict button to generate prediction. I hope you got the desired results
and the application is working fine.
谢谢!

More Related Content

What's hot

RECURSIVE DESCENT PARSING
RECURSIVE DESCENT PARSINGRECURSIVE DESCENT PARSING
RECURSIVE DESCENT PARSING
Jothi Lakshmi
 
Multimedia Mining
Multimedia Mining Multimedia Mining
Multimedia Mining
Biniam Asnake
 
Online Tweet Sentiment Analysis with Apache Spark
Online Tweet Sentiment Analysis with Apache SparkOnline Tweet Sentiment Analysis with Apache Spark
Online Tweet Sentiment Analysis with Apache Spark
Davide Nardone
 
Emotion recognition
Emotion recognitionEmotion recognition
Emotion recognition
Madhusudhan G
 
And or graph
And or graphAnd or graph
And or graph
Ali A Jalil
 
Machine learning
Machine learningMachine learning
Machine learning
Mike Martinez
 
Spell checker using Natural language processing
Spell checker using Natural language processing Spell checker using Natural language processing
Spell checker using Natural language processing
Sandeep Wakchaure
 
OLAP
OLAPOLAP
OLAP
Ashir Ali
 
Map reduce in BIG DATA
Map reduce in BIG DATAMap reduce in BIG DATA
Map reduce in BIG DATA
GauravBiswas9
 
Testing Hadoop jobs with MRUnit
Testing Hadoop jobs with MRUnitTesting Hadoop jobs with MRUnit
Testing Hadoop jobs with MRUnit
Eric Wendelin
 
Internship report on AI , ML & IIOT and project responses full docs
Internship report on AI , ML & IIOT and project responses full docsInternship report on AI , ML & IIOT and project responses full docs
Internship report on AI , ML & IIOT and project responses full docs
Rakesh Arigela
 
Introduction to NumPy (PyData SV 2013)
Introduction to NumPy (PyData SV 2013)Introduction to NumPy (PyData SV 2013)
Introduction to NumPy (PyData SV 2013)
PyData
 
Three address code In Compiler Design
Three address code In Compiler DesignThree address code In Compiler Design
Three address code In Compiler Design
Shine Raj
 
8 queens problem using back tracking
8 queens problem using back tracking8 queens problem using back tracking
8 queens problem using back trackingTech_MX
 
13. Query Processing in DBMS
13. Query Processing in DBMS13. Query Processing in DBMS
13. Query Processing in DBMSkoolkampus
 
Classification and Regression
Classification and RegressionClassification and Regression
Classification and Regression
Megha Sharma
 
Predicting house price
Predicting house pricePredicting house price
Predicting house price
Divya Tiwari
 
machine learning
machine learningmachine learning
machine learning
RaheemUnnisa1
 
Deep learning
Deep learningDeep learning
Deep learning
Ratnakar Pandey
 
Token, Pattern and Lexeme
Token, Pattern and LexemeToken, Pattern and Lexeme
Token, Pattern and Lexeme
A. S. M. Shafi
 

What's hot (20)

RECURSIVE DESCENT PARSING
RECURSIVE DESCENT PARSINGRECURSIVE DESCENT PARSING
RECURSIVE DESCENT PARSING
 
Multimedia Mining
Multimedia Mining Multimedia Mining
Multimedia Mining
 
Online Tweet Sentiment Analysis with Apache Spark
Online Tweet Sentiment Analysis with Apache SparkOnline Tweet Sentiment Analysis with Apache Spark
Online Tweet Sentiment Analysis with Apache Spark
 
Emotion recognition
Emotion recognitionEmotion recognition
Emotion recognition
 
And or graph
And or graphAnd or graph
And or graph
 
Machine learning
Machine learningMachine learning
Machine learning
 
Spell checker using Natural language processing
Spell checker using Natural language processing Spell checker using Natural language processing
Spell checker using Natural language processing
 
OLAP
OLAPOLAP
OLAP
 
Map reduce in BIG DATA
Map reduce in BIG DATAMap reduce in BIG DATA
Map reduce in BIG DATA
 
Testing Hadoop jobs with MRUnit
Testing Hadoop jobs with MRUnitTesting Hadoop jobs with MRUnit
Testing Hadoop jobs with MRUnit
 
Internship report on AI , ML & IIOT and project responses full docs
Internship report on AI , ML & IIOT and project responses full docsInternship report on AI , ML & IIOT and project responses full docs
Internship report on AI , ML & IIOT and project responses full docs
 
Introduction to NumPy (PyData SV 2013)
Introduction to NumPy (PyData SV 2013)Introduction to NumPy (PyData SV 2013)
Introduction to NumPy (PyData SV 2013)
 
Three address code In Compiler Design
Three address code In Compiler DesignThree address code In Compiler Design
Three address code In Compiler Design
 
8 queens problem using back tracking
8 queens problem using back tracking8 queens problem using back tracking
8 queens problem using back tracking
 
13. Query Processing in DBMS
13. Query Processing in DBMS13. Query Processing in DBMS
13. Query Processing in DBMS
 
Classification and Regression
Classification and RegressionClassification and Regression
Classification and Regression
 
Predicting house price
Predicting house pricePredicting house price
Predicting house price
 
machine learning
machine learningmachine learning
machine learning
 
Deep learning
Deep learningDeep learning
Deep learning
 
Token, Pattern and Lexeme
Token, Pattern and LexemeToken, Pattern and Lexeme
Token, Pattern and Lexeme
 

Similar to Laptop Price Prediction system

A gentle introduction to algorithm complexity analysis
A gentle introduction to algorithm complexity analysisA gentle introduction to algorithm complexity analysis
A gentle introduction to algorithm complexity analysis
Lewis Lin 🦊
 
Info cube modeling_dimension_design_erada_bw_infoalert
Info cube modeling_dimension_design_erada_bw_infoalertInfo cube modeling_dimension_design_erada_bw_infoalert
Info cube modeling_dimension_design_erada_bw_infoalertPhani Kumar
 
Feature engineering mean encodings
Feature engineering   mean encodingsFeature engineering   mean encodings
Feature engineering mean encodings
Chode Amarnath
 
number system understand
number system  understandnumber system  understand
number system understandrickypatel151
 
4th sem project.pptx
4th sem project.pptx4th sem project.pptx
4th sem project.pptx
saiproject
 
BTE 320-498 Summer 2017 Take Home Exam (200 poi.docx
BTE 320-498 Summer 2017 Take Home Exam (200 poi.docxBTE 320-498 Summer 2017 Take Home Exam (200 poi.docx
BTE 320-498 Summer 2017 Take Home Exam (200 poi.docx
AASTHA76
 
What Are the Key Steps in Scraping Product Data from Amazon India.pptx
What Are the Key Steps in Scraping Product Data from Amazon India.pptxWhat Are the Key Steps in Scraping Product Data from Amazon India.pptx
What Are the Key Steps in Scraping Product Data from Amazon India.pptx
Productdata Scrape
 
What Are the Key Steps in Scraping Product Data from Amazon India.pdf
What Are the Key Steps in Scraping Product Data from Amazon India.pdfWhat Are the Key Steps in Scraping Product Data from Amazon India.pdf
What Are the Key Steps in Scraping Product Data from Amazon India.pdf
Productdata Scrape
 
AQA Computer science easter revision
AQA Computer science easter revisionAQA Computer science easter revision
AQA Computer science easter revision
Montgomery High School, Blackpool, UK
 
Creating your own Abstract Processor
Creating your own Abstract ProcessorCreating your own Abstract Processor
Creating your own Abstract ProcessorAodrulez
 
TabPy Presentation
TabPy PresentationTabPy Presentation
TabPy Presentation
Sanjana Jami
 
Data Science in business World
Data Science in business World Data Science in business World
Data Science in business World
DeepikaGauriBaijal
 
Automating With Excel An Object Oriented Approach
Automating  With  Excel    An  Object  Oriented  ApproachAutomating  With  Excel    An  Object  Oriented  Approach
Automating With Excel An Object Oriented Approach
Razorleaf Corporation
 
Workstations powered by Intel can play a vital role in CPU-intensive AI devel...
Workstations powered by Intel can play a vital role in CPU-intensive AI devel...Workstations powered by Intel can play a vital role in CPU-intensive AI devel...
Workstations powered by Intel can play a vital role in CPU-intensive AI devel...
Principled Technologies
 
Graphics Standards and Algorithm
Graphics Standards and AlgorithmGraphics Standards and Algorithm
Graphics Standards and Algorithm
Yatin Singh
 
Unraveling The Meaning From COVID-19 Dataset Using Python – A Tutorial for be...
Unraveling The Meaning From COVID-19 Dataset Using Python – A Tutorial for be...Unraveling The Meaning From COVID-19 Dataset Using Python – A Tutorial for be...
Unraveling The Meaning From COVID-19 Dataset Using Python – A Tutorial for be...
Kavika Roy
 
Mr bi
Mr biMr bi
Mr bi
renjan131
 
Data Science - Part II - Working with R & R studio
Data Science - Part II -  Working with R & R studioData Science - Part II -  Working with R & R studio
Data Science - Part II - Working with R & R studio
Derek Kane
 
Apple Conjoint Analysis -Spillproof Laptops
Apple Conjoint Analysis -Spillproof LaptopsApple Conjoint Analysis -Spillproof Laptops
Apple Conjoint Analysis -Spillproof LaptopsNicole Baron Dietrich
 
House price prediction
House price predictionHouse price prediction
House price prediction
SabahBegum
 

Similar to Laptop Price Prediction system (20)

A gentle introduction to algorithm complexity analysis
A gentle introduction to algorithm complexity analysisA gentle introduction to algorithm complexity analysis
A gentle introduction to algorithm complexity analysis
 
Info cube modeling_dimension_design_erada_bw_infoalert
Info cube modeling_dimension_design_erada_bw_infoalertInfo cube modeling_dimension_design_erada_bw_infoalert
Info cube modeling_dimension_design_erada_bw_infoalert
 
Feature engineering mean encodings
Feature engineering   mean encodingsFeature engineering   mean encodings
Feature engineering mean encodings
 
number system understand
number system  understandnumber system  understand
number system understand
 
4th sem project.pptx
4th sem project.pptx4th sem project.pptx
4th sem project.pptx
 
BTE 320-498 Summer 2017 Take Home Exam (200 poi.docx
BTE 320-498 Summer 2017 Take Home Exam (200 poi.docxBTE 320-498 Summer 2017 Take Home Exam (200 poi.docx
BTE 320-498 Summer 2017 Take Home Exam (200 poi.docx
 
What Are the Key Steps in Scraping Product Data from Amazon India.pptx
What Are the Key Steps in Scraping Product Data from Amazon India.pptxWhat Are the Key Steps in Scraping Product Data from Amazon India.pptx
What Are the Key Steps in Scraping Product Data from Amazon India.pptx
 
What Are the Key Steps in Scraping Product Data from Amazon India.pdf
What Are the Key Steps in Scraping Product Data from Amazon India.pdfWhat Are the Key Steps in Scraping Product Data from Amazon India.pdf
What Are the Key Steps in Scraping Product Data from Amazon India.pdf
 
AQA Computer science easter revision
AQA Computer science easter revisionAQA Computer science easter revision
AQA Computer science easter revision
 
Creating your own Abstract Processor
Creating your own Abstract ProcessorCreating your own Abstract Processor
Creating your own Abstract Processor
 
TabPy Presentation
TabPy PresentationTabPy Presentation
TabPy Presentation
 
Data Science in business World
Data Science in business World Data Science in business World
Data Science in business World
 
Automating With Excel An Object Oriented Approach
Automating  With  Excel    An  Object  Oriented  ApproachAutomating  With  Excel    An  Object  Oriented  Approach
Automating With Excel An Object Oriented Approach
 
Workstations powered by Intel can play a vital role in CPU-intensive AI devel...
Workstations powered by Intel can play a vital role in CPU-intensive AI devel...Workstations powered by Intel can play a vital role in CPU-intensive AI devel...
Workstations powered by Intel can play a vital role in CPU-intensive AI devel...
 
Graphics Standards and Algorithm
Graphics Standards and AlgorithmGraphics Standards and Algorithm
Graphics Standards and Algorithm
 
Unraveling The Meaning From COVID-19 Dataset Using Python – A Tutorial for be...
Unraveling The Meaning From COVID-19 Dataset Using Python – A Tutorial for be...Unraveling The Meaning From COVID-19 Dataset Using Python – A Tutorial for be...
Unraveling The Meaning From COVID-19 Dataset Using Python – A Tutorial for be...
 
Mr bi
Mr biMr bi
Mr bi
 
Data Science - Part II - Working with R & R studio
Data Science - Part II -  Working with R & R studioData Science - Part II -  Working with R & R studio
Data Science - Part II - Working with R & R studio
 
Apple Conjoint Analysis -Spillproof Laptops
Apple Conjoint Analysis -Spillproof LaptopsApple Conjoint Analysis -Spillproof Laptops
Apple Conjoint Analysis -Spillproof Laptops
 
House price prediction
House price predictionHouse price prediction
House price prediction
 

Recently uploaded

standardisation of garbhpala offhgfffghh
standardisation of garbhpala offhgfffghhstandardisation of garbhpala offhgfffghh
standardisation of garbhpala offhgfffghh
ArpitMalhotra16
 
原版制作(Deakin毕业证书)迪肯大学毕业证学位证一模一样
原版制作(Deakin毕业证书)迪肯大学毕业证学位证一模一样原版制作(Deakin毕业证书)迪肯大学毕业证学位证一模一样
原版制作(Deakin毕业证书)迪肯大学毕业证学位证一模一样
u86oixdj
 
Data Centers - Striving Within A Narrow Range - Research Report - MCG - May 2...
Data Centers - Striving Within A Narrow Range - Research Report - MCG - May 2...Data Centers - Striving Within A Narrow Range - Research Report - MCG - May 2...
Data Centers - Striving Within A Narrow Range - Research Report - MCG - May 2...
pchutichetpong
 
一比一原版(Bradford毕业证书)布拉德福德大学毕业证如何办理
一比一原版(Bradford毕业证书)布拉德福德大学毕业证如何办理一比一原版(Bradford毕业证书)布拉德福德大学毕业证如何办理
一比一原版(Bradford毕业证书)布拉德福德大学毕业证如何办理
mbawufebxi
 
一比一原版(UPenn毕业证)宾夕法尼亚大学毕业证成绩单
一比一原版(UPenn毕业证)宾夕法尼亚大学毕业证成绩单一比一原版(UPenn毕业证)宾夕法尼亚大学毕业证成绩单
一比一原版(UPenn毕业证)宾夕法尼亚大学毕业证成绩单
ewymefz
 
Predicting Product Ad Campaign Performance: A Data Analysis Project Presentation
Predicting Product Ad Campaign Performance: A Data Analysis Project PresentationPredicting Product Ad Campaign Performance: A Data Analysis Project Presentation
Predicting Product Ad Campaign Performance: A Data Analysis Project Presentation
Boston Institute of Analytics
 
一比一原版(TWU毕业证)西三一大学毕业证成绩单
一比一原版(TWU毕业证)西三一大学毕业证成绩单一比一原版(TWU毕业证)西三一大学毕业证成绩单
一比一原版(TWU毕业证)西三一大学毕业证成绩单
ocavb
 
Criminal IP - Threat Hunting Webinar.pdf
Criminal IP - Threat Hunting Webinar.pdfCriminal IP - Threat Hunting Webinar.pdf
Criminal IP - Threat Hunting Webinar.pdf
Criminal IP
 
一比一原版(UMich毕业证)密歇根大学|安娜堡分校毕业证成绩单
一比一原版(UMich毕业证)密歇根大学|安娜堡分校毕业证成绩单一比一原版(UMich毕业证)密歇根大学|安娜堡分校毕业证成绩单
一比一原版(UMich毕业证)密歇根大学|安娜堡分校毕业证成绩单
ewymefz
 
Algorithmic optimizations for Dynamic Levelwise PageRank (from STICD) : SHORT...
Algorithmic optimizations for Dynamic Levelwise PageRank (from STICD) : SHORT...Algorithmic optimizations for Dynamic Levelwise PageRank (from STICD) : SHORT...
Algorithmic optimizations for Dynamic Levelwise PageRank (from STICD) : SHORT...
Subhajit Sahu
 
一比一原版(CBU毕业证)卡普顿大学毕业证成绩单
一比一原版(CBU毕业证)卡普顿大学毕业证成绩单一比一原版(CBU毕业证)卡普顿大学毕业证成绩单
一比一原版(CBU毕业证)卡普顿大学毕业证成绩单
nscud
 
一比一原版(UVic毕业证)维多利亚大学毕业证成绩单
一比一原版(UVic毕业证)维多利亚大学毕业证成绩单一比一原版(UVic毕业证)维多利亚大学毕业证成绩单
一比一原版(UVic毕业证)维多利亚大学毕业证成绩单
ukgaet
 
一比一原版(ArtEZ毕业证)ArtEZ艺术学院毕业证成绩单
一比一原版(ArtEZ毕业证)ArtEZ艺术学院毕业证成绩单一比一原版(ArtEZ毕业证)ArtEZ艺术学院毕业证成绩单
一比一原版(ArtEZ毕业证)ArtEZ艺术学院毕业证成绩单
vcaxypu
 
一比一原版(UofS毕业证书)萨省大学毕业证如何办理
一比一原版(UofS毕业证书)萨省大学毕业证如何办理一比一原版(UofS毕业证书)萨省大学毕业证如何办理
一比一原版(UofS毕业证书)萨省大学毕业证如何办理
v3tuleee
 
一比一原版(Adelaide毕业证书)阿德莱德大学毕业证如何办理
一比一原版(Adelaide毕业证书)阿德莱德大学毕业证如何办理一比一原版(Adelaide毕业证书)阿德莱德大学毕业证如何办理
一比一原版(Adelaide毕业证书)阿德莱德大学毕业证如何办理
slg6lamcq
 
一比一原版(Deakin毕业证书)迪肯大学毕业证如何办理
一比一原版(Deakin毕业证书)迪肯大学毕业证如何办理一比一原版(Deakin毕业证书)迪肯大学毕业证如何办理
一比一原版(Deakin毕业证书)迪肯大学毕业证如何办理
oz8q3jxlp
 
一比一原版(RUG毕业证)格罗宁根大学毕业证成绩单
一比一原版(RUG毕业证)格罗宁根大学毕业证成绩单一比一原版(RUG毕业证)格罗宁根大学毕业证成绩单
一比一原版(RUG毕业证)格罗宁根大学毕业证成绩单
vcaxypu
 
Criminal IP - Threat Hunting Webinar.pdf
Criminal IP - Threat Hunting Webinar.pdfCriminal IP - Threat Hunting Webinar.pdf
Criminal IP - Threat Hunting Webinar.pdf
Criminal IP
 
The affect of service quality and online reviews on customer loyalty in the E...
The affect of service quality and online reviews on customer loyalty in the E...The affect of service quality and online reviews on customer loyalty in the E...
The affect of service quality and online reviews on customer loyalty in the E...
jerlynmaetalle
 
一比一原版(CU毕业证)卡尔顿大学毕业证成绩单
一比一原版(CU毕业证)卡尔顿大学毕业证成绩单一比一原版(CU毕业证)卡尔顿大学毕业证成绩单
一比一原版(CU毕业证)卡尔顿大学毕业证成绩单
yhkoc
 

Recently uploaded (20)

standardisation of garbhpala offhgfffghh
standardisation of garbhpala offhgfffghhstandardisation of garbhpala offhgfffghh
standardisation of garbhpala offhgfffghh
 
原版制作(Deakin毕业证书)迪肯大学毕业证学位证一模一样
原版制作(Deakin毕业证书)迪肯大学毕业证学位证一模一样原版制作(Deakin毕业证书)迪肯大学毕业证学位证一模一样
原版制作(Deakin毕业证书)迪肯大学毕业证学位证一模一样
 
Data Centers - Striving Within A Narrow Range - Research Report - MCG - May 2...
Data Centers - Striving Within A Narrow Range - Research Report - MCG - May 2...Data Centers - Striving Within A Narrow Range - Research Report - MCG - May 2...
Data Centers - Striving Within A Narrow Range - Research Report - MCG - May 2...
 
一比一原版(Bradford毕业证书)布拉德福德大学毕业证如何办理
一比一原版(Bradford毕业证书)布拉德福德大学毕业证如何办理一比一原版(Bradford毕业证书)布拉德福德大学毕业证如何办理
一比一原版(Bradford毕业证书)布拉德福德大学毕业证如何办理
 
一比一原版(UPenn毕业证)宾夕法尼亚大学毕业证成绩单
一比一原版(UPenn毕业证)宾夕法尼亚大学毕业证成绩单一比一原版(UPenn毕业证)宾夕法尼亚大学毕业证成绩单
一比一原版(UPenn毕业证)宾夕法尼亚大学毕业证成绩单
 
Predicting Product Ad Campaign Performance: A Data Analysis Project Presentation
Predicting Product Ad Campaign Performance: A Data Analysis Project PresentationPredicting Product Ad Campaign Performance: A Data Analysis Project Presentation
Predicting Product Ad Campaign Performance: A Data Analysis Project Presentation
 
一比一原版(TWU毕业证)西三一大学毕业证成绩单
一比一原版(TWU毕业证)西三一大学毕业证成绩单一比一原版(TWU毕业证)西三一大学毕业证成绩单
一比一原版(TWU毕业证)西三一大学毕业证成绩单
 
Criminal IP - Threat Hunting Webinar.pdf
Criminal IP - Threat Hunting Webinar.pdfCriminal IP - Threat Hunting Webinar.pdf
Criminal IP - Threat Hunting Webinar.pdf
 
一比一原版(UMich毕业证)密歇根大学|安娜堡分校毕业证成绩单
一比一原版(UMich毕业证)密歇根大学|安娜堡分校毕业证成绩单一比一原版(UMich毕业证)密歇根大学|安娜堡分校毕业证成绩单
一比一原版(UMich毕业证)密歇根大学|安娜堡分校毕业证成绩单
 
Algorithmic optimizations for Dynamic Levelwise PageRank (from STICD) : SHORT...
Algorithmic optimizations for Dynamic Levelwise PageRank (from STICD) : SHORT...Algorithmic optimizations for Dynamic Levelwise PageRank (from STICD) : SHORT...
Algorithmic optimizations for Dynamic Levelwise PageRank (from STICD) : SHORT...
 
一比一原版(CBU毕业证)卡普顿大学毕业证成绩单
一比一原版(CBU毕业证)卡普顿大学毕业证成绩单一比一原版(CBU毕业证)卡普顿大学毕业证成绩单
一比一原版(CBU毕业证)卡普顿大学毕业证成绩单
 
一比一原版(UVic毕业证)维多利亚大学毕业证成绩单
一比一原版(UVic毕业证)维多利亚大学毕业证成绩单一比一原版(UVic毕业证)维多利亚大学毕业证成绩单
一比一原版(UVic毕业证)维多利亚大学毕业证成绩单
 
一比一原版(ArtEZ毕业证)ArtEZ艺术学院毕业证成绩单
一比一原版(ArtEZ毕业证)ArtEZ艺术学院毕业证成绩单一比一原版(ArtEZ毕业证)ArtEZ艺术学院毕业证成绩单
一比一原版(ArtEZ毕业证)ArtEZ艺术学院毕业证成绩单
 
一比一原版(UofS毕业证书)萨省大学毕业证如何办理
一比一原版(UofS毕业证书)萨省大学毕业证如何办理一比一原版(UofS毕业证书)萨省大学毕业证如何办理
一比一原版(UofS毕业证书)萨省大学毕业证如何办理
 
一比一原版(Adelaide毕业证书)阿德莱德大学毕业证如何办理
一比一原版(Adelaide毕业证书)阿德莱德大学毕业证如何办理一比一原版(Adelaide毕业证书)阿德莱德大学毕业证如何办理
一比一原版(Adelaide毕业证书)阿德莱德大学毕业证如何办理
 
一比一原版(Deakin毕业证书)迪肯大学毕业证如何办理
一比一原版(Deakin毕业证书)迪肯大学毕业证如何办理一比一原版(Deakin毕业证书)迪肯大学毕业证如何办理
一比一原版(Deakin毕业证书)迪肯大学毕业证如何办理
 
一比一原版(RUG毕业证)格罗宁根大学毕业证成绩单
一比一原版(RUG毕业证)格罗宁根大学毕业证成绩单一比一原版(RUG毕业证)格罗宁根大学毕业证成绩单
一比一原版(RUG毕业证)格罗宁根大学毕业证成绩单
 
Criminal IP - Threat Hunting Webinar.pdf
Criminal IP - Threat Hunting Webinar.pdfCriminal IP - Threat Hunting Webinar.pdf
Criminal IP - Threat Hunting Webinar.pdf
 
The affect of service quality and online reviews on customer loyalty in the E...
The affect of service quality and online reviews on customer loyalty in the E...The affect of service quality and online reviews on customer loyalty in the E...
The affect of service quality and online reviews on customer loyalty in the E...
 
一比一原版(CU毕业证)卡尔顿大学毕业证成绩单
一比一原版(CU毕业证)卡尔顿大学毕业证成绩单一比一原版(CU毕业证)卡尔顿大学毕业证成绩单
一比一原版(CU毕业证)卡尔顿大学毕业证成绩单
 

Laptop Price Prediction system

  • 2. “Data is a precious thing and will last longer than the systems themselves.” - Tim Berners-Lee, Inventor(World Wide Web)
  • 3. Group Members (Group no7) Sourabh Choudhary 2018521460107 Rashedin Islam 2018521460109 Harun Or Rashid 2018521460121 Md. Riaz Hassan 2018521460123 (Project Manager)
  • 4. Contents Describing Problem Statement 01 Overview about dataset 02 Data Cleaning 03 Exploratory Data Analysis 04 Feature Engineering 05 Machine learning Modeling 06 ML web app development 07 Deployment Machine learning app 08
  • 5. P R O B L E M S T A T E M E N T Problem Statement for Laptop Price Prediction We will make a project for Laptop price prediction. The problem statement is that if any user wants to buy a laptop then our application should be compatible to provide a tentative price of laptop according to the user configurations. Although it looks like a simple project or just developing a model, the dataset we have is noisy and needs lots of feature engineering, and preprocessing that will drive your interest in developing this project.
  • 6. Data Set for Laptop Prediction Most of the columns in a dataset are noisy and contain lots of information. But with feature engineering you do, you will get more good results. The only problem is we are having less data but we will obtain a good accuracy over it. The only good thing is it is better to have a large data. we will develop a website that could predict a tentative price of a laptop based on user configuration.
  • 8. Basic Understanding of Laptop Price Prediction Data Now let us start working on a dataset in our Jupyter Notebook. The first step is to import the libraries and load data. After that we will take a basic understanding of data like its shape, sample, is there are any NULL values present in the dataset. Understanding the data is an important step for prediction or any machine learning project.
  • 9. Basic Understanding of Laptop Price Prediction Data It is good that there are no NULL values. And we need little changes in weight and Ram column to convert them to numeric by removing the unit written after value. So we will perform data cleaning here to get the correct types of columns.
  • 10. EDA helps to perform hypothesis testing. We will start from the first column and explore each column and understand what impact it creates on the target column. At the required step, we will also perform preprocessing and feature engineering tasks. our aim in performing in-depth EDA is to prepare and clean data for better machine learning modeling to achieve high performance and generalized models. so let’s get started with analyzing and preparing the dataset for prediction. Exploratory Data Analysis EDA of Laptop Price Prediction Dataset
  • 11. 1) Distribution of target column Working with regression problem statement target column distribution is important to understand. The distribution of the target variable is skewed and it is obvious that commodities with low prices are sold and purchased more than the branded ones.
  • 12. 2) Company column we want to understand how does brand name impacts the laptop price or what is the average price of each laptop brand? If you plot a count plot(frequency plot) of a company then the major categories present are Lenovo, Dell, HP, Asus, etc. Now if we plot the company relationship with price then you can observe that how price varies with different brands. Razer, Apple, LG, Microsoft, Google, MSI laptops are expensive, and others are in the budget range.
  • 13. 3) Company column Which type of laptop you are looking for like a gaming laptop, workstation, or notebook. As major people prefer notebook because it is under budget range and the same can be concluded from our data.
  • 14. 4) Does the price vary with laptop size in inches? A Scatter plot is used when both the columns are numerical and it answers our question in a better way. From the below plot we can conclude that there is a relationship but not a strong relationship between the price and size column.
  • 15. 5) Screen Resolution Screen resolution contains lots of information. Before any analysis first, we need to perform feature engineering over it. If you observe unique values of the column then we can see that all value gives information related to the presence of an IPS panel, are a laptop touch screen or not, and the X-axis and Y-axis screen resolution. So, we will extract the column into 3 new columns in the dataset. Feature Engineering and Preprocessing of Laptop Price Prediction Model Feature engineering is a process to convert raw data to meaningful information. there are many methods that come under feature engineering like transformation, categorical encoding, etc. Now the columns we have are noisy so we need to perform some feature engineering steps. Extract Touch screen information It is a binary variable so we can encode it as 0 and 1. one means the laptop is a touch screen and zero indicates not a touch screen. If we plot the touch screen column against price then laptops with touch screens are expensive which is true in real life.
  • 16. Extract IPS Channel presence information It is a binary variable and the code is the same we used above. The laptops with IPS channel are present less in our data but by observing relationship against the price of IPS channel laptops are high.
  • 17. Extract X-axis and Y-axis screen resolution dimensions Now both the dimension are present at end of a string and separated with a cross sign. So first we will split the string with space and access the last string from the list. then split the string with a cross sign and access the zero and first index for X and Y-axis dimensions. Replacing inches, X and Y resolution to PPI If you find the correlation of columns with price using the corr method then we can see that inches do not have a strong correlation but X and Y-axis resolution have a very strong resolution so we can take advantage of it and convert these three columns to a single column that is known as Pixel per inches(PPI). In the end, our goal is to improve the performance by having fewer features.
  • 18. Now when you will see the correlation of price then PPI is having a strong correlation. So now we can drop the extra columns which are not of use. At this point, we have started keeping the important columns in our dataset.
  • 19. 6) CPU column If you observe the CPU column then it also contains lots of information. If you again use a unique function or value counts function on the CPU column then we have 118 different categories. The information it gives is about preprocessors in laptops and speed. To extract the preprocessor we need to extract the first three words from the string. we are having an Intel preprocessor and AMD preprocessor so we are keeping 5 categories in our dataset as i3, i5, i7, other intel processors, and AMD processors.
  • 20. How does the price vary with processors? We can again use our bar plot property to answer this question. And as obvious the price of i7 processor is high, then of i5 processor, i3 and AMD processor lies at the almost the same range. Hence price will depend on the preprocessor.
  • 21. 8) Memory Column Memory column is again a noisy column that gives an understanding of hard drives. many laptops came with HHD and SSD both, as well in some there is an external slot present to insert after purchase. This column can disturb your analysis if not feature engineer it properly. So If you use value counts on a column then we are having 4 different categories of memory as HHD, SSD, Flash storage, and hybrid.
  • 22. First, we have cleaned the memory column and then made 4 new columns which are a binary column where each column contains 1 and 0 indicate that amount four is present and which is not present. Any laptop has a single type of memory or a combination of two. so in the first column, it consists of the first memory size and if the second slot is present in the laptop then the second column contains it else we fill the null values with zero. After that in a particular column, we have multiplied the values by their binary value. It means that if in any laptop particular memory is present then it contains binary value as one and the first value will be multiplied by it, and same with the second combination. For the laptop which does have a second slot, the value will be zero multiplied by zero is zero. Now when we see the correlation of price then Hybrid and flash storage have very less or no correlation with a price. We will drop this column with CPU and memory which is no longer required.
  • 23. 9) GPU Variable GPU(Graphical Processing Unit) has many categories in data. We are having which brand graphic card is there on a laptop. we are not having how many capacities like (6Gb, 12 Gb) graphic card is present. so we will simply extract the name of the brand. If you use the value counts function then there is a row with GPU of ARM so we have removed that row and after extracting the brand GPU column is no longer needed.
  • 24. 10) Operating System Column There are many categories of operating systems. we will keep all windows categories in one, Mac in one, and remaining in others. This is a simple and most used feature engineering method, you can try something else if you find more correlation with price. when you plot price against operating system then as usual Mac is most expensive.
  • 25. Log-Normal Transformation We saw the distribution of the target variable above which was right-skewed. By transforming it to normal distribution performance of the algorithm will increase. we take the log of values that transform to the normal distribution which you can observe below. So while separating dependent and independent variables we will take a log of price, and in displaying the result perform exponent of it.
  • 26.
  • 27. Machine Learning Modeling for Laptop Price Prediction Now we have prepared our data and hold a better understanding of the dataset. so let’s get started with Machine learning modeling and find the best algorithm with the best hyperparameters to achieve maximum accuracy. Import Libraries
  • 28. we have imported libraries to split data, and algorithms you can try. At a time we do not know which is best so you can try all the imported algorithms. Machine Learning Modeling for Laptop Price Prediction Split in train and test As discussed we have taken the log of the dependent variables. And the training data looks something below the dataframe.
  • 29. Machine Learning Modeling for Laptop Price Prediction
  • 30. Machine Learning Modeling for Laptop Price Prediction Now we implement a pipeline to streamlit the training and testing process. first, we use a column transformer to encode categorical variables which is step one. After that, we create an object of our algorithm and pass both steps to the pipeline. using pipeline objects we predict the score on new data and display the accuracy. Implement Pipeline for training and testing
  • 31. Machine Learning Modeling for Laptop Price Prediction
  • 32. Machine Learning Modeling for Laptop Price Prediction In the first step for categorical encoding, we passed the index of columns to encode, and pass-through means pass the other numeric columns as it is. The best accuracy I got is with all-time favorite Random Forest. But you can use this code again by changing the algorithm and its parameters. I am showing Random forest. you can do Hyperparameter tuning using GridsearchCV or Random Search CV. we can also do feature scaling but it does not create any impact on Random Forest.
  • 33. Machine Learning Modeling for Laptop Price Prediction Exporting the Model Now we have done with modeling. we will save the pipeline object for the development of the project website. we will also export the data frame which will be required to create dropdowns in the website.
  • 34. Create Web Application for Deployment of Laptop Price Prediction Model Now we will use streamlit to create a web app to predict laptop prices. In a web application, we need to implement a form that takes all the inputs from users that we have used in a dataset, and by using the dumped model we predict the output and display it to a user. Streamlit Streamlit is an open-source web framework written in Python. It is the fastest way to create data apps and it is widely used by data science practitioners to deploy machine learning models. To work with this it is not important to have any knowledge of frontend languages. Streamlit contains a wide variety of functionalities, and an in-built function to meet your requirement. It provides you with a plot map, flowcharts, slider, selection box, input field, the concept of caching, etc. install streamlit using the below pip command.
  • 35. Create Web Application for Deployment of Laptop Price Prediction Model create a file named app.py in the same working directory where we will write code for streamlit.
  • 36. Create Web Application for Deployment of Laptop Price Prediction Model
  • 37. Create Web Application for Deployment of Laptop Price Prediction Model
  • 38. Create Web Application for Deployment of Laptop Price Prediction Model Explanation First we load the data frame and model that we have saved. After that, we create an HTML form of each field based on training data columns to take input from users. In categorical columns, we provide the first parameter as input field name and second as select options which is nothing but the unique categories in the dataset. In the numerical field, we provide users with an increase or decrease in the value. After that, we created the prediction button, and whenever it is triggered it will encode some variable and prepare a two-dimension list of inputs and pass it to the model to get the prediction that we display on the screen. Take the exponential of predicted output because we have done a log of the output variable. Now when you run the app file using the above command you will get two URL and it will automatically open the web application in your default browser or copy the URL and open it. the application will look something like the below figure.
  • 39. Enter some data in each field and click on predict button to generate prediction. I hope you got the desired results and the application is working fine.