MARGINALIZATION (Different learners in Marginalized Group
Spectroscopy.ppt
1. Spectroscopy
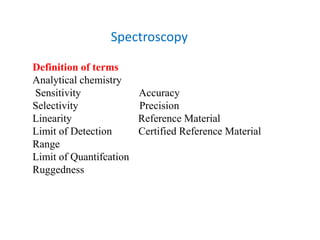
Definition of terms
Analytical chemistry
Sensitivity Accuracy
Selectivity Precision
Linearity Reference Material
Limit of Detection Certified Reference Material
Range
Limit of Quantifcation
Ruggedness
2. Selectivity
• Selectivity of a method refers to the extent to which it can
determine particular analyte(s) in a complex mixture without
interference from the other components in the mixture.
• Amethod which is perfectly selective for an analyte or group
of analytes is said to be specific.
• In each case the recovery of the analyte(s) of interest should be
determined and the influences of suspected interferences duly
stated.
3. Sensitivity
• Sensitivity is the difference in analyte concentration
corresponding to the smallest difference in the response of the
method that can be detected.
• It is represented by the slope of the calibration curve and can
be determined by a least squares procedure, or experimentally,
using samples containing various concentrations of the analyte
4. Limit of Detection
• Limit of detection of an analyte is determined by repeat
analysis of a blank test portion and is the analyte concentration
whose response is equivalent to the mean blank response plus
3 standard deviations. Its value is likely to be different for
different types of sample
• Method detection limit and
• Instrument detection limit
5. Limit of Quantification
• Limit of quantification is the lowest concentration of analyte
that can be determined with an acceptable level of accuracy
and precision. It should be established using an appropriate
standard or sample, i.e. it is usually the lowest point on the
calibration curve (excluding the blank). It should not be
determined by extrapolation
6. Range
• For quantitative analysis the working range for a method is
determined by examining samples with different analyte
concentrations and determining the concentration range for
which acceptable accuracy and precision can be achieved.
• The relationship of analyte response to concentration does not
have to be perfectly linear for a method to be effective.
• For methods showing good linearity 5 different standards are
usually sufficient for producing calibration curves.
• In qualitative analysis, it is common place to examine replicate
samples and standards over a range of concentrations to
establish at what concentration a reliable cut-off point can be
drawn between detection and non-detection.
7. Linearity
• Linearity is determined by the analysis of samples with analyte
concentrations spanning the claimed range of the method.
• The results are used to calculate a regression line against
analyte calculation using the least squares method.
• It is convenient if a method is linear over a particular range
but it is not an absolute requirement. Where linearity is
unattainable for a particular procedure, a suitable algorithm for
calculations should be determined
8. Ruggedness
• Sometimes it is also called robustness.
• Where different laboratories use the same method they
inevitably introduce small variations in the procedure, which
may or may not have a significant influence on the
performance of the method.
• The ruggedness of a method is tested by deliberately
introducing small changes to the method and examining the
consequences.
• A large number of factors may need to be considered, but
because most of these will have a negligible effect, it will
normally be possible to vary several at once. Ruggedness is
normally evaluated by the originating laboratory, before other
laboratories collaborate
9. Accuracy
• The accuracy of a method is the closeness of the obtained
analyte value to the true value.
• It can be established by analysing a suitable reference
material.
• Where a suitable reference material is not available, an
estimation of accuracy can be obtained by spiking test portions
with chemical standards.
• The value of spiking is limited; it can only be used to
determine the accuracy of those stages of the method
following the spiking.
• Accuracy can also be established by comparison with results
obtained by a definitive method or other alternative procedures
and via inter comparison studies
10. Precision
• Precision of a method is a statement of the closeness of
agreement between mutually independent test results and is
usually stated in terms of standard deviation.
• Repeatability is a type of precision relating to measurements
made under repeatable conditions, i.e. same method; same
material; same operator; same laboratory; narrow time period.
• Reproducibility is a concept of precision relating to
measurements made under reproducibility conditions, i.e. same
method; different operator, different laboratories; different
equipment; long time period.
11. Reference Material
• A reference material (RM) is a material or substance one or
more properties of which are sufficiently established to be
used for the calibration of an apparatus, the assessment of a
measurement method, or for assigning values to materials.
• A certified reference material (CRM) is a reference material
one or more of whose property values are certified by a
technically valid procedure, accompanied by, or traceable to a
certificate or other documentation which is issued by a
certifying body.
13. Spectroscopy
• We focuses on photon spectroscopy, using ultraviolet, visible,
and infrared radiation. Because these techniques use a
common set of optical devices for dispersing and focusing the
radiation, they often are identified as optical spectroscopies.
For convenience we will usually use the simpler term
“spectroscopy” in place of photon spectroscopy or optical
spectroscopy; Before we examine specific spectroscopic
methods, we first review the properties of electromagnetic
radiation.
14. What Is Electromagnetic Radiation
• Electromagnetic radiation, or light, is a form of energy whose
behavior is described by the properties of both waves and
particles.
• The optical properties of electromagnetic radiation, such as
reflection, refraction, diffraction, are explained best by
describing light as a wave.
• Many of the interactions between electromagnetic radiation
and matter, such as absorption and emission, however, are
better described by treating light as a particle, or photon.
• the dual models of wave and particle behavior provide a useful
description for electromagnetic radiation.
15. • Wave Properties of Electromagnetic Radiation
Electromagnetic radiation consists of oscillating electric and
magnetic fields that propagate through space along a linear path
and with a constant velocity.
In a vacuum, electromagnetic radiation travels at the speed of
light, c, which is 2.99792 X 10⁸ m/s. Electromagnetic radiation
moves through a medium other than a vacuum with a velocity, v,
less than that of the speed of light in a vacuum.
The speed of light to three significant figures, 3 X 10⁸ m/s, is
sufficiently accurate for most purposes. Oscillations in the
electric and magnetic fields are perpendicular to each other, and
to the direction of the wave’s propagation. Normally,
electromagnetic radiation is unpolarized, with oscillating electric
and magnetic flied.
17. Particle Properties of Electromagnetic
Radiation
When a sample absorbs electromagnetic radiation it undergoes
a change in energy. The interaction between the sample and the
electromagnetic radiation is easiest to understand if we assume
that electromagnetic radiation consists of a beam of energetic
particles called photons. When a photon is absorbed by a
sample, it is “destroyed,” and its energy acquired by the
sample. The energy of a photon, in joules, is related to its
frequency, wavelength, or wave number by the following
equations
E = hv = hc/l = hc
h = 6.626 ´ 10–34 J · s.
18. The Electromagnetic Spectrum
The frequency and wavelength of electromagnetic
radiation vary over many orders of magnitude. For convenience,
electromagnetic radiation is divided into different regions based on the type
of atomic or molecular transition that gives rise to the absorption or
emission of photons . The boundaries describing the electromagnetic
spectrum are not rigid, and an overlap between spectral regions is possible.
1020 1018 1016 1014 1012 108
-rays X-rays UV IR
Micro-
wave
Frequency (Hz)
Wavelength (m)
10-11 10-8 10-6 10-3
Visible
400 500 600 700 800 nm
20. Measuring Photons as a Signal
The characteristic properties of electromagnetic radiation, are its energy,
velocity, amplitude, frequency, phase angle, polarization, and direction of
propagation. Spectroscopy is possible only if the photon’s interaction with
the sample leads to a change in one or more of these characteristic
properties.
Spectroscopy is conveniently divided into two broad classes. In one class of
techniques, energy is transferred between a photon of electromagnetic
radiation and the analyte. In absorption spectroscopy the energy carried by a
photon is absorbed by the analyte, promoting the analyte from a lower-energy
state to a higher-energy, or excited, state. The source of the energetic state
depends on the photon’s energy. The electromagnetic spectrum shows that
absorbing a photon of visible light causes a valence electron in the analyte to
move to a higher-energy level. When an analyte absorbs infrared radiation, on
the other hand, one of its chemical bonds experiences a change in vibrational
energy.
21. Con’t
The intensity of photons passing through a sample containing
the analyte is attenuated because of absorption. The
measurement of this attenuation, which we call absorbance,
serves as our signal.
Absorption occurs only when the photon’s energy matches the
difference in energy between two energy levels. A plot of
absorbance as a function of the photon’s energy is called an
absorbance spectrum
Emission of a photon occurs when an analyte in a higher-
energy state returns to a lower-energy state. The higher-energy
state can be achieved in several ways, including thermal
energy, radiant energy from a photon, or by a chemical
reaction. Emission following the absorption of a photon is also
called photoluminescence, and that following a chemical
reaction is called chemiluminescence.
22. Basic Components of Spectroscopic
Instrumentation
• The instruments used in spectroscopy consist of several common
components, including a source of energy that can be input to the sample, a
means for isolating a narrow range of wavelengths, a detector for
measuring the signal, and a signal processor to display the signal in a form
convenient for the analyst.
• Sources of Energy
All forms of spectroscopy require a source of energy. In absorption and
scattering spectroscopy this energy is supplied by photons. Emission and
luminescence spectroscopy use thermal, radiant (photon), or chemical
energy to promote the analyte to a less stable, higher energy state.
Therefore, source of energy can be
Electromagnetic Radiation, Thermal or chemical reaction
23. Con’t
• Wavelength Selection
If more than one component in the sample contributes to the absorption of
radiation, then a quantitative analysis is impossible. For this reason we
usually try to select a single wavelength where the analyte is the only
absorbing species.
Unfortunately, we cannot isolate a single wavelength of radiation from a
continuum source. Instead, a wavelength selector passes a narrow band of
radiation characterized by a nominal wavelength, an effective bandwidth,
and a maximum throughput of radiation. The effective bandwidth is defined
as the width of the radiation at half the maximum throughput. The ideal
wavelength selector has a high throughput of radiation and a narrow
effective bandwidth.
24. Con’t
• Wavelength Selection Using Filters
The simplest method for isolating a narrow band of radiation is to use an
absorption or interference filter. Absorption filters work by selectively
absorbing radiation from a narrow region of the electromagnetic spectrum.
Interference filters use constructive and destructive interference to isolate a
narrow range of wavelengths. A piece of colored glass like purple filter
removes the complementary color green from 500–560 nm. Commercially
available absorption filters provide effective bandwidths from 30–250 nm.
The maximum throughput for the smallest effective band passes, however,
only 10% of the source’s emission intensity over that range of wavelengths.
Interference filters are more expensive than absorption filters, but have
narrower effective bandwidths, typically 10–20 nm, with maximum
throughputs of at least 40%.
25. Con’t
• Wavelength Selection Using Monochromators
An alternative approach to wavelength selection, which provides for a
continuous variation of wavelength, is the monochromator. Radiation from
the source enters the monochromator through an entrance slit. The radiation
is collected by a collimating mirror, which reflects a parallel beam of
radiation to a diffraction grating. The diffraction grating is an optically
reflecting surface with a large number of parallel grooves. Diffraction by
the grating disperses the radiation in space, where a second mirror focuses
the radiation onto a planar surface containing an exit slit. In some
monochromators a prism is used in place of the diffraction grating.
Radiation exits the monochromator and passes to the detector.
polychromatic source of radiation at the entrance slit is converted at the exit
slit to a monochromatic source of finite effective bandwidth.
27. Con’t
Monochromators are classified as either fixed-wavelength or
scanning. In a fixed-wavelength monochromator, the
wavelength is selected by manually rotating the grating.
Normally, a fixed-wavelength monochromator is only used for
quantitative analyses where measurements are made at one or
two wavelengths. A scanning monochromator includes a drive
mechanism that continuously rotates the grating, allowing
successive wavelengths to exit from the monochromator.
28. Con’t
• Interferometers
An interferometer provides an alternative approach for wavelength
selection. Instead of filtering or dispersing the electromagnetic radiation,
an interferometer simultaneously allows source radiation of all wavelengths
to reach the detector. Radiation from the source is focused on a beam
splitter that transmits half of the radiation to a fixed mirror, while reflecting
the other half to a movable mirror. The radiation recombines at the beam
splitter, where constructive and destructive interference determines, for
each wavelength, the intensity of light reaching the detector. As the moving
mirror changes position, the wavelengths of light experiencing maximum
constructive interference and maximum destructive interference also
changes. The signal at the detector shows intensity as a function of the
moving mirror’s position, expressed in units of distance or time. The result
is called an interferogram, or a time domain spectrum.
29. Con’t
The time domain spectrum is converted mathematically, by a process called
a Fourier transform, to the normal spectrum (also called a frequency
domain spectrum) of intensity as a function of the radiation’s energy. In
comparison with a monochromator, interferometers provide two significant
advantages. The first advantage, which is termed Jacquinot’s
advantage, results from the higher throughput of source radiation. Since an
interferometer does not use slits and has fewer optical components from
which radiation can be scattered and lost, the throughput of radiation
reaching the detector is 80–200 times greater than that achieved with a
monochromator. The result is an improved signal-to-noise ratio. The
second advantage, which is called Fellgett’s advantage, reflects a
savings in the time needed to obtain a spectrum. Since all frequencies are
monitored simultaneously, an entire spectrum can be recorded in
approximately in 1 s, as compared to 10–15 min with a scanning
monochromator.
30. Detectors
The first detector for optical spectroscopy was the human eye, which, of
course, is limited both by its accuracy and its limited sensitivity to
electromagnetic radiation. Modern detectors use a sensitive transducer to
convert a signal consisting of photons into an easily measured electrical
signal. Ideally the detector’s signal, S, should be a linear function of the
electromagnetic radiation’s power, P,
S = kP + D
where k is the detector’s sensitivity, and D is the detector’s dark current, or
the background electric current when all radiation from the source is
blocked from the detector.
31. Con’t
• Photon Transducers: Two general classes of transducers are used for
optical spectroscopy. Phototubes and photomultipliers contain a
photosensitive surface that absorbs radiation in the ultraviolet, visible, and
near infrared (IR), producing an electric current proportional to the number
of photons reaching the transducer. Other photon detectors use a
semiconductor as the photosensitive surface. When the semiconductor
absorbs photons, valence electrons move to the semiconductor’s
conduction band, producing a measurable current. One advantage of the Si
photodiode is that it is easily miniaturized. Groups of photodiodes may be
gathered together in a linear array containing from 64 to 4096 individual
photodiodes.
32. Con’t
• Thermal Transducers: Infrared radiation generally does not have
sufficient energy to produce a measurable current when using a photon
transducer. A thermal transducer, therefore, is used for infrared
spectroscopy. The absorption of infrared photons by a thermal transducer
increases its temperature, changing one or more of its characteristic
properties. The pneumatic transducer, for example, consists of a small tube
filled with xenon gas equipped with an IR-transparent window at one end,
and a flexible membrane at the other end. A blackened surface in the tube
absorbs photons, increasing the temperature and, therefore, the pressure of
the gas. The greater pressure in the tube causes the flexible membrane to
move in and out, and this displacement is monitored to produce an
electrical signal.
33. Signal Processors
The electrical signal generated by the transducer is sent to a signal
processor where it is displayed in a more convenient form for the analyst.
Examples of signal processors include analog or digital meters, recorders,
and computers equipped with digital acquisition boards. The signal
processor also may be used to calibrate the detector’s response, to amplify
the signal from the detector, to remove noise by filtering, or to
mathematically transform the signal.
34. Spectroscopy Based on Absorption
Absorbance of Electromagnetic Radiation
In absorption spectroscopy a beam of electromagnetic radiation passes
through a sample. Much of the radiation is transmitted without a loss in
intensity. At selected frequencies, however, the radiation’s intensity is
attenuated. This process of attenuation is called absorption. Two general
requirements must be met if an analyte is to absorb electromagnetic
radiation. The first requirement is that there must be a mechanism by which
the radiation’s electric field or magnetic field interacts with the analyte. For
ultraviolet and visible radiation, this interaction involves the electronic
energy of valence electrons. A chemical bond’s vibrational energy is altered
by the absorbance of infrared radiation.
35. Con’t
The second requirement is that the energy of the electromagnetic radiation
must exactly equal to the difference in energy, DE, between two of the
analytes quantized energy states.
E0
E1
vo
v1
v2
vo
v1
v2
The red lines labeled E0 and
E1 represent the analyte’s
ground (lowest) electronic
state and its first electronic
excited state. Superimposed on
each electronic energy level is
a series of lines representing
vibrational energy levels.
36.
37. Ultraviolet and visible absorption
spectroscopy
• The absorption by matter of electromagnetic radiation in the domain
ranging from the near ultraviolet to the very near infrared, between 180 and
1100 nm, has been studied extensively. This portion of the electromagnetic
spectrum, designated as the ‘UV/Visible’ since it includes radiation
perceptible to the human eye, generally yields little structural information
but is very useful for quantitative measurements.
• When a molecule or ion absorbs ultraviolet or visible radiation it undergoes
a change in its valence electron configuration. The valence electrons in
organic molecules, and inorganic anions such as CO3 2–, occupy quantized
sigma bonding, s, pi bonding, p, and nonbonding, n, molecular orbitals.
Unoccupied sigma antibonding, s*, and pi antibonding, p*, molecular
orbitals often lie close enough in energy that the transition of an electron
from an occupied to an unoccupied orbital is possible.
38. con’t
• Four types of transitions between quantized energy levels
account for molecular UV/Vis spectra.
s s*, p p*, n p*, n s*
Of these transitions, the most important are the np* and p
p*, because they involve functional groups that are
characteristic of the analyte and wavelengths that are easily
accessible. The bonds and functional groups that give rise to
the absorption of ultraviolet and visible radiation are called
chromophores.
39. Con’t
• Many transition metal ions, such as Cu2+ and Co2+, form
solutions that are colored because the metal ion absorbs visible
light. The transitions giving rise to this absorption are due to
valence electrons in the metal ion’s d-orbitals. For a free metal
ion, the five d-orbitals are of equal energy. In the presence of a
complexing ligand or solvent molecule, however, the d-
orbitals split into two or more groups that differ in energy. For
example, in the octahedral complex Cu(H2O)62+ the six water
molecules perturb the d-orbitals into two groups. The resulting
d–d transitions for transition metal ions are relatively weak.
M—L + hn M+ — L–
40. The UV/Vis spectral region and the origin of the
absorptions
This region of the spectrum is conventionally divided into
three sub-domains termed near UV (185–400 nm), visible
(400–700 nm) and very near infrared (700– 1100 nm). Most
commercial spectrophotometers cover the spectral range of
185 to 900 nm. The lower limit of the instrument depends
upon the nature of the optical components used and of the
presence of air along the optical pathway, since oxygen and
water vapor absorb intensely below 190 nm.
41. Con’t
Some instruments, on condition that they are operating in a
vacuum, can attain 150 nm with samples in the gaseous state.
This is the domain of vacuum or far ultraviolet. The long-
wavelength limit is usually determined by the wavelength
response of the detector in the spectrometer. The origin of
absorption in this domain is the interaction of photons from a
source with ions or molecules of the sample. When a molecule
absorbs a photon from the UV/Vis region, the corresponding
energy is captured by one (or several) of its outermost
electrons.
42. Con’t
As a consequence there occurs a modification of its electronic
energy (Ee), a component of the total mechanical energy of the
molecule along with its energy of rotation (Er) and its energy
of vibration (Ev).
A modification of Ee will result in alterations for both Er and
Ev resulting in a vast collection of possible transitions
obtained in all three cases, and since the polarities of the bonds
within the molecules will be disturbed their spectra are given
the generic name of charge transfer spectra.
Et = Er + Ev + Ee
Ee > Ev > Er.
43. Electronic transitions of organic compounds
• Organic compounds represent the majority of the studies made
in the UV/Vis. The observed transitions involve electrons
engaged in s or p or non-bonding n electron orbitals of atoms.
Where possible the character of each absorption band will be
indicated in relation to the molecular orbitals (MO) concerned.
• s→ s∗ transition
This transition appears in the far UV since promotion of an
electron from a s bonding MO to a s∗ anti bonding MO
requires a significant energy. This is the reason for saturated
hydrocarbons that only contain this type of bonding being
transparent in the near UV.
44. Con’t
• n→ s∗ transition
The promotion of an n electron from an atom of O, N, S, Cl to an MO s∗
leads to a transition of moderate intensity located around 180 nm for
alcohols, near 190 nm for ethers or halogen derivatives and in the region of
220 nm for amines.
• n→π∗ Transition
This transition of low intensity results from the passage of an n electron
(engaged in a non-bonding MO) to an anti-bonding π∗ orbital. This
transition is usually observed in molecules containing a hetero atom
carrying lone electron pairs as part of an unsaturated system. The best
known is that corresponding to the carbonyl band, easily observed at
around 270 to 295 nm. The molar absorption coefficient for this band is
weak.
45. • p→ p∗ Transition
Compounds possessing an isolated ethylenic double bond
reveal a strong absorption band around 170 nm. The precise
position depends upon the presence of heteroatom substituents.
A compound that is transparent in a given spectral range of the
near UV when it is isolated, can become absorbing if it interact
with a species through a mechanism of type donor–acceptor
(D-A). This phenomenon is linked to the passage of an
electron from a bonding orbital of the donor (which becomes a
radical cation) towards a vacant orbital of the acceptor (which
becomes a radical anion) of an attainable energy level.
46. Con’t
• d→d transition.
Numerous inorganic salts containing electrons engaged in d
orbitals are responsible for transitions of weak absorption
located in the visible region. These transitions are generally
responsible for their colours. That is why the solutions of
metallic salts of titanium TiH2O63+ or of copper CuH2O62+
are blue, while potassium permanganate yields violet
solutions, and so on.
47. Con’t
• Chromophore groups
The functional groups of organic compounds (ketones, amines, nitrogen
derivatives, etc.), responsible for absorption in UV/Vis are called
chromophores. A species formed from a carbon skeleton transparent in the
near UV on which they are attached one or several chromophores
constitutes a chromogene.
• Solvent effects: solvatochromism
Each solvent has its own characteristic polarity. Since it is known that all
electronic transitions modify the charge distribution of the compound in
solution, it is obvious that the position and intensity of the absorption bands
will vary a little with the nature of the solvent used. The nature of the
solvent/solute interactions are a greater indication of the type of transition.
Two contrasting effects can be distinguished.
Hypsochromic effect (the ‘blue shift’) and Bathochromic effect (the ‘red
shift’)
48. The UV/Vis spectrum
UV/Vis spectrometers collect the data over the required range
and generate the spectrum of the compound under analysis as a
graph representing the transmittance (or the absorbance) as a
function of wavelength along the abscissa, given in
nanometres. In spectroscopy, the transmittance T is a measure
of the attenuation of a beam of monochromatic light based
upon the comparison between the intensities of the transmitted
light (I) and the incident light I0.
T = I/I0
%T = I/I0×100
I0 I
sample
49. Absorbance and Concentration: Beer’s Law
• An alternative method for expressing the attenuation of electromagnetic
radiation is absorbance, A, which is defined as
A = - logT = - logI/Io
• When monochromatic electromagnetic radiation passes through an
infinitesimally thin layer of sample, of thickness dx, it experiences a
decrease in intensity of dI0. The fractional decrease in intensity is
proportional to the sample’s thickness and the analyte’s concentration, C;
thus
-dIo/Io = kcdx
=
Converting from ln to log, and substituting the equation ,
A = abc, this is Beer’s law
50. Beer’s Law and Multicomponent Samples
• Beer’s law can be extended to samples containing several
absorbing components provided that there are no interactions
between the components. Individual absorbances, Ai, are
additive. For a two-component mixture of X and Y, the total
absorbance, At, is
Atot = Ax +Ay = axcbx + aycby
51. Limitations to Beer’s Law
• According to Beer’s law, a calibration curve of absorbance versus the
concentration of analyte in a series of standard solutions should be a
straight line with an intercept of 0 and a slope of ab. In many cases,
however, calibration curves are found to be nonlinear. Deviations from
linearity are divided into three categories: fundamental, chemical, and
instrumental.
• Fundamental Limitations to Beers Law: Beer’s law is valid only for low
concentrations of analyte. There are two contributions to this fundamental
limitation.
At higher concentrations the individual particles of analyte no longer behave
independently of one another. The resulting interaction between particles of
analyte may change the value of absorptivity.
A second contribution is that the absorptivity, a, and molar absorptivity, e,
depend on the sample’s refractive index. Since the refractive index varies
with the analyte’s concentration, the values of a and e will change. For
sufficiently low concentrations of analyte, the refractive index remains
essentially constant, and the calibration curve is linear.
52. Con’t
• Chemical Limitations to Beer’s Law: Chemical deviations from Beer’s
law can occur when the absorbing species is involved in an equilibrium
reaction. Example weak acids
HA H+ + A-
• Instrumental Limitations to Beer’s Law: There are two principal
instrumental limitations to Beer’s law. The first limitation is that Beer’s law
is strictly valid for purely monochromatic radiation; that is, for radiation
consisting of only one wavelength. Stray radiation is the second
contribution to instrumental deviations from Beer’s law. Stray radiation
arises from imperfections within the wavelength selector that allows
extraneous light to “leak” into the instrument.
53. Instrumentation
• Frequently an analyst must select, from several instruments of different
design, the one instrument best suited for a particular analysis. In this
section we examine some of the different types of instruments used for
molecular absorption spectroscopy, emphasizing their advantages and
limitations.
• Single-beam monochannel optical spectrometers: The simplest
instrument currently used for molecular UV/Vis absorption is the filter
photometer, which uses an absorption or interference filter to isolate a
band of radiation. The filter is placed between the source and sample to
prevent the sample from decomposing when exposed to high-energy
radiation. A filter photometer has a single optical path between the source
and detector and is called a single-beam instrument. The instrument is
calibrated to 0% T while using a shutter to block the source radiation from
the detector. After removing the shutter, the instrument is calibrated to
100% T using an appropriate blank.
54.
55. Con’t
• Array-detector spectrophotometers
This type of instrument resembles a spectrograph closely since it allows the
simultaneous recording of all wavelengths of the spectrum by using an
array of up to a few thousands of miniaturized photodiodes. Array-detector
spectrophotometers allow rapid recording of absorption spectra, each diode
measuring the light intensity over a small interval of wavelength. The
resolution power of these diode-array instruments, without a
monochromator, is limited by the size of the diodes. These instruments use
only a single light beam, so a reference spectrum is recorded and stored in
memory to produce transmittance or absorbance spectra after recording the
sample spectrum.
56.
57. Con’t
• Double-beam scanning spectrometer
The double-beam design greatly simplifies the process of the single-beam
instrument by measuring the transmittance of the sample and solvent
almost simultaneously. One beam passes through the sample while the
other passes through the reference solution. Most spectrometers use one (or
two) mirrored rotating chopper wheel to alternately direct the light beam
through the sample and reference cells. This permits the detector to
compare the two intensities transmitted by reference or sample solutions for
the same wavelength. The amplification of the modulated signal allows the
elimination, in large part, of the stray light. The electronic circuit adjusts
the sensitivity of the photomultiplier tube as the inverse with respect to the
light intensity it receives. A simpler set-up is based on the use of semi-
transparent mirror and two connected photodiodes.