The document provides information about a project report submitted to Karnataka University on consumer behavior towards Mysore Sandal Soap by Karnataka Soaps and Detergents Limited (KS&DL) in Bangalore. It includes details about KS&DL such as its inception in 1918, product portfolio including Mysore Sandal Soap, and certifications like ISO 9001 and ISO 14001. The project aims to understand consumer preferences for Mysore Sandal Soap and analyze factors influencing their purchase behavior. Primary and secondary research methods are used to collect and analyze data.
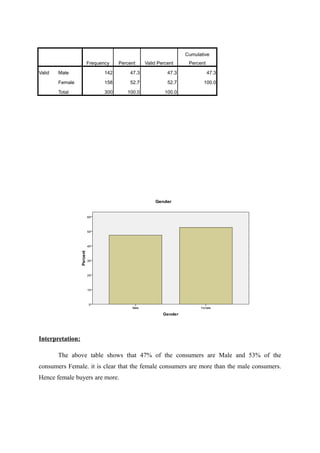
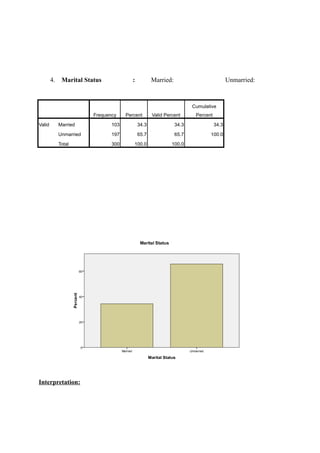


![5G Explained! A High Level Overview [Introduction]](https://cdn.slidesharecdn.com/ss_thumbnails/5gexplainedahighleveloverview-260119165306-cc137a3e-thumbnail.jpg?width=640&height=640&fit=bounds)


