Beginners Guide to TikTok for Search - Rachel Pearson - We are Tilt __ Bright...
Quiz 1 Term 3 Mathematics T STPM
1. QUIZ 1 – CHAPTER 1
NAME : ………………………………………………………………… CLASS : ……………………………
Answer all the questions.
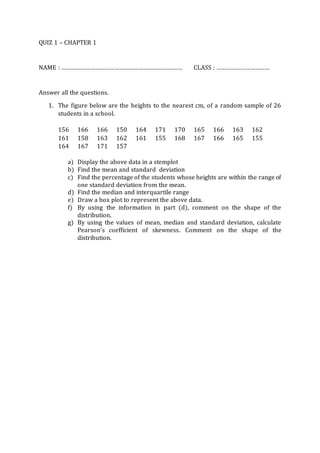
1. The figure below are the heights to the nearest cm, of a random sample of 26
students in a school.
156 166 166 150 164 171 170 165 166 163 162
161 158 163 162 161 155 168 167 166 165 155
164 167 171 157
a) Display the above data in a stemplot
b) Find the mean and standard deviation
c) Find the percentage of the students whose heights are within the range of
one standard deviation from the mean.
d) Find the median and interquartile range
e) Draw a box plot to represent the above data.
f) By using the information in part (d), comment on the shape of the
distribution.
g) By using the values of mean, median and standard deviation, calculate
Pearson’s coefficient of skewness. Comment on the shape of the
distribution.