Problem Axmlnamespace prefix = o ns = urnschemas-microsoft-com.pdf
Problem 3 rate 4%)? (vi) The $10,000 is stored under the investor\'s mattress for 10 years? (vii) The $10,000 is \'invested\' in lottery tickets? For the purposes of clarification, income from certificates of deposit, bonds, and TIPS are considered ordinary income. Problem 2. How much principal must be invested today for 5 years, during a period when the inflation rate is 2%, if the investor is in the 25% Federal and 4% State tax bracket for ordinary income but taxed at a 15% Federal rate for dividend income, to accumulate $10,000 in today\'s dollars, in the following cases: The principal is invested in a certificate of deposit that pays annual interest of 6%? (ii) The principal is invested in a stock that retains its share price and pays an annual dividend of 6%? (iii) The principal is invested in a municipal bond (on which no state tax is levied) that pays annual interest of 5%? Problem 3. In an economic environment with no inflation, $10,000 is invested in a savings bond that yields 7% for years. For this particular bond, investor choice of paying tax on the bond income (28%) annually, deferring the until the the year, when tax (28%) is paid once on the entire 8-year accumulated income (but not original $10,000) from the bond. Which tax option should the investor choose, and what is the benefit in income? The answer to this question reveals a very important aspect of investment strategy. Solution.

Recommended
Recommended
More Related Content
Similar to Problem Axmlnamespace prefix = o ns = urnschemas-microsoft-com.pdf
Similar to Problem Axmlnamespace prefix = o ns = urnschemas-microsoft-com.pdf (20)
More from ajantaopt
More from ajantaopt (9)
Recently uploaded
Recently uploaded (20)
Problem Axmlnamespace prefix = o ns = urnschemas-microsoft-com.pdf
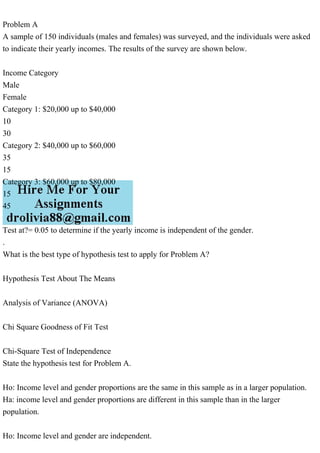
- 1. Problem A A sample of 150 individuals (males and females) was surveyed, and the individuals were asked to indicate their yearly incomes. The results of the survey are shown below. Income Category Male Female Category 1: $20,000 up to $40,000 10 30 Category 2: $40,000 up to $60,000 35 15 Category 3: $60,000 up to $80,000 15 45 Test at?= 0.05 to determine if the yearly income is independent of the gender. . What is the best type of hypothesis test to apply for Problem A? Hypothesis Test About The Means Analysis of Variance (ANOVA) Chi Square Goodness of Fit Test Chi-Square Test of Independence State the hypothesis test for Problem A. Ho: Income level and gender proportions are the same in this sample as in a larger population. Ha: income level and gender proportions are different in this sample than in the larger population. Ho: Income level and gender are independent.
- 2. Ha: There is a relationship between income level and gender. Ho: There is a relationship between income level and gender. Ha: Income level and gender are independent. Ho: Income level and gender are independent. Ha: Income level depends on gender. Calculate the value of the Chi-Square Test Statistic for Problem A. What is it? Identify the critical value for Problem A using the Table of Critical Values of the Chi Square Distribution. What is the critical value? What is your conclusion for Problem A? Gender depends on income level. Income level depends on gender. There is a relationship between income level and gender. Income level and gender are independent. Proportions in income level and gender do not statistically significantly change over time. Income Category Male Female Category 1: $20,000 up to $40,000 10 30 Category 2: $40,000 up to $60,000 35 15 Category 3: $60,000 up to $80,000 15 45 Solution
- 3. in it the test statistic=28.125 Chi-Square Test of Independence Ho: There is a relationship between income level and gender. Income level depends on gender.