SlideShare a Scribd company logo
1 of 18
Download to read offline
WE LL TES TiNG


                                                                                                    Bottomhole pressure
                                                                                                                              Bubblepoint


                                                                                                                                        ∆pA–B

                                                                                                                                        ∆pA–C


                                                                                                    Wellbore Potential
Testing Design and Analysis

Bruno Deruyck                 Christine Ehlig-Economides           Jeffrey Joseph
Montrouge, France             Clamart, France                      London, England                                              B

                                                                                                                          A                     C
 Well testing is performed in so many different guises that it is easy to lose
                                                                                                                                    Crossflow rates
                                       These are to confirm the economic potential
                                                                                                                          Production rate
In its simplest form, testing provides short-    tion logging to measure downhole flow.            nEstimating producibility by altering the
term production of reservoir fluids to the       They are routinely run in horizontal as well      production rate and noting changes in
                                                                                                   bottomhole pressure (top). A well’s pro-
surface permitting the operator to confirm       as vertical wells.                                ductivity index, or inflow performance, is
the show—indicated by cuttings, cores and           Developing the multifarious and intricate      the slope of the straight line, measured in
logs—and estimate reservoir deliverability.      hardware to accomplish all these tasks is a       barrels of oil per day per psi. The straight-
In its subtlest form, measured pressure tran-    design engineer’s dream. And juggling the         line response curves downward once
sients caused by abrupt changes in produc-       many options for conducting a well test pro-      pressure falls below bubblepoint and gas
                                                                                                   starts coming out of solution.
tion can characterize completion damage,         vides endless challenges in the field (see           In a layered reservoir, individual pro-
reservoir permeability and distant reservoir     “The Nuts and Bolts of Well Testing,” page        duction rates measured using a produc-
heterogeneities.                                 14). This article concentrates not on hard-       tion logging tool—layers A, B and C in this
   The logistics of well testing are simple in   ware but on the information well tests give       example—are plotted versus each layer’s
                                                                                                   wellbore potential, the wellbore pressure
concept, but complex in practice. Flowing        and how tests are designed and interpreted.       normalized to a datum. This so-called
an exploration well requires a temporary            Primary concerns in testing exploration        selective inflow performance technique
completion. Flowing any well not con-            wells are obtaining representative samples        reveals individual layer inflow perfor-
nected to downstream facilities requires         and estimating reservoir producibility.1 Fluid    mances and also pressure imbalances
heavy surface equipment including separa-        samples are needed to determine various           between layers that can promote crossflow.
tors and flares. Obtaining pressure transients   physical parameters required for well test
requires alternately shutting and opening        analysis, such as compressibility and viscos-
the well, preferably downhole, and making        ity, and for pressure-volume-temperature             In this article, COMPUTEST (wellsite computer sys-
accurate downhole measurements of pres-          (PVT) analysis that unlocks how the hydro-           tem), FPE (Fluid Properties Estimation), IMPULSE
                                                                                                      (measurement while perforating), MDT (Modular For-
sure. Increasingly, testing is performed in      carbon phases coexist at different pressures         mation Dynamics Tester), PLT (Production Logging
combination with perforating and produc-         and temperatures.2 For oil, a critical PVT           Tool), RFT (Repeat Formation Tester), SPG (Sapphire
                                                 parameter is bubblepoint pressure, the pres-         Pressure Gauge), STAR (Schlumberger Transient Anal-
                                                                                                      ysis and Report) and ZODIAC (Zoned Dynamic Inter-
                                                 sure above which oil is undersaturated in            pretation Analysis and Computation) are marks of
                                                 gas and below which gas within oil starts            Schlumberger.
                                                 being released. Maintaining reservoir pres-       1. Barnum RS and Vela S: “Testing Exploration Wells by
                                                                                                      Objectives,” paper SPE 13184, presented at the 59th
                                                 sure above bubblepoint is key to successful          SPE Annual Technical Conference and Exhibition,
                                                 testing since the principle of transient analy-      Houston, Texas, USA, September 16-19, 1984.
                                                 sis, described below, holds only if flow in       2. Freyss H, Guieze P, Varotsis N, Khakoo A, Lestelle K
                                                                                                      and Simper D: “PVT Analysis for Oil Reservoirs,”
                                                 the reservoir remains monophasic. Estimat-           The Technical Review 37, no. 1 (January 1989): 4-15.
                                                 ing reservoir producibility requires achiev-

28                                                                                                                                    Oilfield Review
ing stable flow rates at several choke sizes     ity—and it can determine the producing            everywhere, eventually reaching the reser-
       and then determining the productivity index      zone’s permeability-thickness product, kh. It     voir pressure that drives production.
       from the slope of the flow versus drawdown       can see to the limits of the reservoir indicat-      The reservoir engineer follows this chain
       pressure data (previous page ).                  ing the probable shape (but not orientation)      of events by measuring the pressure
          The type of oil as determined by a sample     of the reservoir boundaries and can show          buildup, or transient, and through analysis
       and the ability of the well to produce are       whether the primary recovery mechanism is         determines information about the reservoir
       the first steps toward commercial exploita-      from water or gas-cap support. This infor-        from near the wellbore to its limits. An anal-
       tion. If well productivity is less than          mation becomes crucial in the appraisal and       ogous chain of events occurs if instead of
       expected, then wellbore damage may be            production stages of field development            shutting in the well, the well is opened and
       the cause. This is the next concern in testing   when engineers combine testing interpreta-        allowed to flow. Again, it is oil near the
       exploration wells. Estimating the near-well-     tion results with seismic and geologic data       wellbore that first senses the disturbance,
       bore condition to perform necessary reme-        to refine their understanding of the reservoir.   but it is only a matter of time for oil deeper
       dial action and ultimately to plan a well           How does transient pressure testing work?      in the reservoir to respond and begin flow-
       completion strategy for the field is accom-      Imagine first an oil well in stable production    ing too. Drawdown pressure measurements
       plished from the transient analysis part of a    with a certain pressure drawdown between          to track these events practically mirror the
       well test.                                       the far limits of the reservoir and the well.     buildup response. In fact, transients can be
          Transient analysis, however, reaches          Now shut in the well. In the formation, a         obtained simply by increasing or decreasing
       deeper than just the near-wellbore region.       sort of concertina effect takes place (below).    the flow rate.
       Today, it contributes so much to characteriz-    Oil near the wellbore is the first to sense the      Transient testing depends on accurate
       ing the reservoir that engineers increasingly    shut-in and gets stopped in its tracks as it      pressure measurements taken long enough
       refer to well testing as reservoir testing.      tries to push more oil ahead of it, getting       after the flow rate change to observe what
       Analysis can indicate the likely producing       compressed in the process. Then, the shock        the test was designed to detect. Impulse test-
       mechanism of the formation—for example,          is felt farther away as news of the shut-in, so   ing, for example, measures the transient that
       how much production comes from frac-             to speak, travels to the outer regions of the     occurs as a well is perforated, allowed to
       tures, how much from intergranular poros-        reservoir. Gradually, the pressure builds up      produce for a short time and then shut in.

sight of its two real purposes.

of a discovery well and to maximize the cost efficiency of production in a developing or mature field.

Integrated with other measurements, well tests help provide the basis of reservoir characterization.


                                                                       Fracture


                           Sealing fault


                                                                         nPlan view showing the movement of wave fronts of a pressure transient
                                                                         progressing away from a well. This shows a hydraulically fractured well
                                                                         drilled near a sealing fault. Once wellbore storage disappears, the tran-
                                                                         sient moves into the formation along linear paths perpendicular to the
                                                                         fracture. Farther from the well, the transient moves radially from the
                                                                         borehole. On hitting the sealing fault, the transient begins reflecting back
                                                                         toward the borehole.


       April 1992                                                                                                                                    29
The primary target is the near-wellbore                                 Impulse               Conventional                       Interference
region (right ).3 The goal is to assess forma-
tion damage and, if necessary, perform stim-
ulation. Tests last just an hour or two. In a
conventional test conducted to investigate
reservoir boundaries, often called a limit
test, the transient must be long enough for
the pressure disturbance to reach the
boundaries and then create a measurable
response in the well. How long this takes
depends on formation and fluid characteris-
tics. In particular, the lower the formation
permeability, the more time is needed—tests
can continue for days. Longest lasting are
interference tests, in which the effect of a
transient created in one well is observed in
another, yielding information about reser-
voir transmissivity and storativity.
   The analysis and interpretation of well
tests have evolved remarkably since the
technique became established in the 1930s.
Today, a unified methodology has devel-
                                                             Flow


oped to obtain the maximum information
from any transient.4 The conventional test
on a new well comprises two flow periods
and two shut-ins (next page). The first flow
period, perhaps an hour long, is designed to
                                                             Pressure


clean up the near-wellbore region and give
the field crew time to manipulate chokes to
establish a practical, stable flow rate. The
well is then shut in and pressure builds up
to reservoir pressure, an important parame-
                                                                                                   Time
ter for the reservoir engineer. Then begins a
long flow period, followed by a shut-in last-               nThree types of well testing: Impulse, conventional and interference. Impulse testing
ing at least 1.2 to 1.5 times as long. This last            measures the transient caused by a very brief flow, typically just as the well is perfo-
step generates the transient designed to                    rated. Results yield skin and permeability and may indicate if remedial stimulation is
                                                            required. Conventional well testing measures the shut-in transient after a lengthy flow
yield the reservoir’s secrets. Of course, there             period and is often used to detect reservoir limits. Interference testing measures the
are many variants on this theme (see “Text-                 transient in a well caused by one or more flow pulses in a nearby well. Results yield
book Well Test from the Congo,” page 33).                   details about interwell transmissivity and storativity.


3. Ayestaran L, Ayoub J, Campbell J, Fairhurst D, Herrera
                                                               The basic data obtained are change in         bated if well pressure toward the top of the
   IC, Munsell S and Sneed BJ: “IMPULSE Testing,” The       pressure, ∆p, versus elapsed time since the      well drops below bubblepoint and part of
   Technical Review 36, no. 4 (October 1988): 37-45.        transient was initiated, ∆t. In traditional      the well is filled with compressible gas.
4. For a review:                                            analysis, ∆p is plotted against the logarithm    Wellbore storage is substantially reduced by
   Horne RN: Modern Well Test Analysis: A Computer-
   Aided Approach. Palo Alto, California, USA:
                                                            of (tp + ∆t )/∆t , a dimensionless variable in   shutting in the well downhole, minimizing
   Petroway, Inc, 1990.                                     which tp is the duration of the flow period.     the volume of fluids that contribute.
   For the development of well test analysis:               This is the Horner plot—( t p + ∆ t )/∆ t is        As wellbore storage dissipates, the tran-
   Ramey HJ Jr: “Advances in Practical Well Test Analy-     called Horner time (next page)—and the           sient begins to move into the formation.
   sis,” paper SPE 20592, presented at the 65th SPE
   Annual Technical Conference and Exhibition, New
                                                            transient is analyzed by tracing the             Pressure continues building up, but at a
   Orleans, Louisiana, USA, September 23-26, 1990.          progress of the data from right to left.         slower rate as the transient moves far
5. Bourdet D, Whittle TM, Douglas AA and Pirard YM:            First comes wellbore storage, which refers    enough to achieve radial flow toward the
   “A New Set of Type Curves Simplifies Well Test           to the obfuscating role of the wellbore fluid    wellbore. This is the so-called radial-flow
   Analysis,” World Oil 196 (May 1983): 95-106.
   Bourdet D, Ayoub JA and Pirard YM: “Use of Pressure
                                                            when a transient is initiated. The moment a      regime that appears as a straight line trend
   Derivative in Well Test Interpretation, paper SPE        well is shut in or allowed to flow, fluids in    on the Horner plot. The radial-flow regime
   12777, presented at the 1984 California Regional         the wellbore must first compress or expand       is crucial to quantitative interpretation, since
   Meeting, Long Beach, California, USA, April 11-13,
   1984.                                                    before formation fluids can react. If flow is    it provides values for kh and skin, S, a mea-
                                                            controlled from the surface, the entire well’s
                                                            fluids contribute to wellbore storage and the
                                                            effect can dominate the pressure transient
                                                            for hours afterward. The effect is exacer-


30                                                                                                                                         Oilfield Review
sure of the extra pressure drop caused by         most complex series of drawdowns and                                   A pressure transient breaks into several
wellbore damage. Skin takes positive values       buildups, providing that the radial-flow                            regimes on the log-log plot, each seeing
in a damaged well when pressure drop near         regime is present in the response.                                  deeper than the last. The first regime typi-
the wellbore is greater than expected and            Although the Horner plot is acceptable for                       cally reflects wellbore storage, during which
negative values when stimulation creates          interpreting the radial-flow regime of easy-                        both the pressure and derivative curves
less pressure drop. Next, the transient           to-interpret tests, a straight-line trend is often                  overlay and increase along a straight line of
encounters the limits of the reservoir and        difficult to pick out. Alternatively, there may                     unit slope. As wellbore fluids stabilize, pres-
pressure departs from its straight-line radial-   be several straight-line trends, of which only                      sure continues building up, but at a slower
flow response.                                    one represents radial flow. Also, the plot                          rate. The derivative curve swings down,
   The definition of Horner time is based on      fails to provide ready insight into the nature                      eventually flattening out as the transient
a step change in flow rate, with one flow         of reservoir limits. As pressure measure-                           moves far enough from the wellbore to
period followed by a buildup. In actual           ments improved in accuracy, it was this                             achieve radial flow. Since the radial-flow
tests, there are always at least two prior flow   aspect that increasingly engaged the atten-                         regime is a straight-line trend on the Horner
periods, often many more, and each affects        tion of reservoir engineers. The solution, dis-                     plot, the derivative curve on the log-log plot
the pressure response after it occurs. Never-     covered in in the early 1980s, was a double                         is constant and traces a horizontal line. The
theless, their cumulative effect can be deter-    logarithmic, or log-log, plot of two sets of                        interpreter’s first task always is to identify
mined using the superposition principle,          data versus ∆t (below).5 One set is simply                          this derivative plateau, but this may require
which states that transients occurring            ∆p, the other is the gradient, or derivative,                       waiting a long time in tests dominated by
sequentially simply add up. This results in       of the response on the Horner plot. The                             wellbore storage (page 34, top).
generalized Horner time that takes into           virtue of the log-log plot is that reservoirs                          Lengthy wellbore storage can totally mask
account the flow rates and flow times for all     similar in construction but perhaps differing                       earlier flow regimes that occur for certain
previous flow periods. Using generalized          in thickness, porosity and permeability give                        borehole-formation configurations and for-
Horner time, the Horner plot retains its          rise to similar looking responses and can be                        mation types, causing distinct perturbations
validity in determining kh and skin for the       recognized as belonging to a class.                                                            (continued on page 34)

           Data

                  1st Flow     1st     2nd Flow                   2nd Buildup
                             Buildup
Pressure


                                                                                        Horner Plot
                                                                                          Limits      Radial
                                                                                                       flow

                                          Time
                                                                                                                          Wellbore
                                                                    ∆p


nElements of a conventional two-stage buildup tran-                                                                       storage
sient test. Testing engineers use the first flow period to
clean up formation damage and adjust the choke to
gauge the producing capacity of the well. The first
buildup provides a first estimate of reservoir pressure.
Then begins a long flow period, followed by a longer
buildup. Analysis of the transient measured during this
                                                                                                          (tp + ∆t )/∆t
second buildup reveals details of the near-wellbore
                                                                                        Log-Log Plot
region, formation characteristics such as permeability,
and distant limits of the reservoir.
  Traditional analysis centered on the Horner plot
(middle), in particular the straight-line trend that sig-
                                                                    ∆p and Derivative


nals radial flow. Today, the log-log plot (bottom) of ∆p                                  Wellbore
and the derivative, the slope of the Horner plot, is used                                 storage
to first diagnose the various flow regimes of the tran-
sient. Then, specialized plots such as the Horner plot
are used to estimate specific parameters such as per-                                                                              Limits
                                                                                                                                 Limits
meability, skin and reservoir pressure.                                                                           Radial flow


                                                                                                                 ∆t


April 1992                                                                                                                                                          31
5 Five pressures, one obtained in surface
     readout and four in memory mode, are
     compared after normalization for different
     gauge depths. Agreement is within 12 psi,
     well within bounds of gauge technology.
                                                                                  6 During the buildup, the                                                       104
                                                                                  measured pressure transient (data
                               3065                                               points) is compared at the wellsite to                                                                                            S = 20
                                          Surface readout                         the design (solid lines), which considered


                                                                                                                                             ∆p and Derivative, psi
                                          SPG gauge                               a range of skin values between –3 and                                                                                                   5
                                          Qtz. gauge 2                            20. A value of –3 corresponds to a                                              103
                                                                                                                                                                                                                          0
               Pressure, psi


                                                                                  stimulated formation, 20 to a damaged
                                                                                  one. Finding skin was crucial because                                                                                                  –3
                                                                                  it determined the necessity of an acid
                                                                                  job. Overlaying the data on the design                                          102
                                                                                  shows skin to be between 0 and
                                                               Qtz. gauge 1       5—in fact, it was calculated at 1. This
                                                               Strain gauge       indicated that an acid job would
                           3035                                                   probably benefit production.
                                      19                19.5                 20      Permeability is less important here,                                         101
                                                 Time, hr                         because it is well known in the area—                                                 10-4           10-3    10-2     10-1      100        101
                                                                                  100 md was assumed for the design,                                                                          Elapsed time, hr
                                                                                  85 md was estimated
                                                                                  from the data.
                                           2 Downhole pressure jumps
                                           to the reservoir pressure level
                         4800              and then drops as the well is
                                           opened to clean up perforation                                                     9 The well is shut in as the
                                                                                                                              acid job is prepared and
     Pressure, psi


                                           debris.
                                                                                                                              performed.

                                               3 The well is shut in so the
                                               surface readout device can be                                                                                                      11 The well is shut in so the
                                               lowered into the hole.                                                                                                             surface readout device can
                                                                                                                                                                                  be lowered again and hooked
                                                                                                                                                                                  into the drillstem test tool.
     Flow rate, bopd


                          1000                                                                                                                                                    10 The well is flowed back to
                                                                                                                                                                                  clean up after the acid job.

                         1000
                            0
                                      0                        10                 20                       30                                 40                                               50       Time, hr        60

 1 The test begins with under-                                                                                                                                                           13 Comparison at wellsite between
 balanced perforation to                                                                  8 A short flow period                            BOPD/psi                                      pre- and post-acid buildups using
 minimize wellbore damage                                                                 during which a                                 0                                   5           surface pressure readout data.
 using tubing-conveyed                                                                    production logging                      2035                                                   Using specialized analysis, the data
 perforating guns slung below                                                             profile is made,
                                                                                                                                  Perfs.                                                 indicates pre-acid skin to be 1, and
 the drillstem test tool.                                                                 the tool passing                                                                               post-acid skin to be –2, a substantial
                                                                                          through the fullbore                    2040                                                   improvement.
                                                                                                                                                                      Limest.


                                                                                          drillstem tool to the                                                                            Because the post-acid drawdown
                                                                                                                       Depth, m


                           4 With pressure now available                                  newly perforated                                                                               and buildups are comparitively longer,
                           at the surface (red curve), a                                  reservoir formations                    2045                                                   the data sees further into the
                           6-hour flow period begins,                                     below. The flow profile                                                                        reservoir. After the radial-flow
                           followed by a slightly longer                                  shows good production                                                                          regime plateau, the post-acid
                                                                                                                                                                      Sandstone


                           buildup.                                                       from the sandstone                      2050                                                   derivative goes up and then down,
                                                                                          but not so good from                                                                           eventually becoming noisy as gauge
                                                                                          the overlying limestone,                                                                       resolution is coming into play. This is
                                               7 Once the radial-flow regime              confirming that
                                               of the buildup is confirmed,                                                       2055                                                   the time to halt the test.
                                                                                          production would
                                               the surface readout device is              definitely benefit
                                               pulled out of the hole.                    from an acid job.
                                               Pressure data change
                                               color, from surface readout
                                               to downhole memory mode.


32                                                                                                                                                                                                        Oilfield Review
Textbook Well Test from the Congo

                                        Gilles Bourdarot              This textbook case study comes from an Elf exploration well in the Congo. The 2200-m [7218-ft]
                                        Alain Desplanques             deep reservoir comprises a limestone overlying a sandstone, both having 20 to 22% porosity. The
                                        Elf Congo                     well test uses all the modern techniques—tubing-conveyed perforating, production logging and
                                        Pointe-Noire, Congo           sampling through fullbore drillstem equipment, surface readout and wellsite validation—and is
                                                                      designed to accomplish two goals:
                                        Mike Pearson
                                                                        One is to estimate near-wellbore damage, reducing it if necessary with a matrix acidization and
                                        Montrouge, France
                                                                      then checking that the acid cleanup worked—all without removing the drillstring from the hole.
                                                                      This was intended not only to benefit production in the well, but also to help plan a completion
                                                                      strategy for field development. The other goal was to investigate reservoir volume and identify
                                                                      reservoir boundaries.
                                                                        The record of surface oil flow rate and downhole pressure for the 130-hour test tells most of the
                                                                      story—follow the annotations in sequence. The surface oil flow rate data points are derived from
                                                                      measuring outflows from the surface separators. The data are stored in the COMPUTEST wellsite
                                                                      computer system. The lines represent averaged values for the duration of a flow period.
                                                                        The green pressure curve represents data stored in downhole memory throughout the test and
                                                                      then read out after retrieving the drillstring. In fact, four pressure gauges were used in this
                                                                      downhole memory mode: one strain gauge, two quartz gauges and one SPG Sapphire Pressure
                                                                      Gauge. The red curve represents pressure data obtained with the surface readout device hooked
                                                                      into the drillstem tool and read in real time at the surface. Over 75,000                               17 The sampler is                                  BOPD/psi
                                                                      pressure data points make up the curves in the plot.                                                    then pulled and a                                  0              5
                                                                                                                                                                              second production                           2035
                                                                        Now go to 1 .                                                                                         logging profile is made                     Perfs.
                                                                                                                                                                              with the well flowing
                                                                                    16 A fluid sampler is run in on                                                           at a higher rate.                           2040


                                                                                                                                                                                                                                           Limest.
12 A long, 24-hour flow period                                                      wireline, through the fullbore                                                            Comparing pre- and


                                                                                                                                                                                                               Depth, m
and a buildup lasting almost                                                                                                                                                  post-acid flow profiles,
                                                                                    drillstem test tool to position
two days then followed. This was                                                                                                                                              the acid job can be                         2045
                                                                                    opposite the producing formations.
to confirm the effectiveness of the                                                                                                                                           seen to have
                                                                                      The well is allowed to flow
acid job and to investigate                                                                                                                                                   successfully stimulated
                                                                                    gently to preserve bottomhole


                                                                                                                                                                                                                                           Sandstone
reservoir volume and boundaries.                                                                                                                                              the limestone.                              2050
                                                                                    pressure above bubblepoint
                                                                                    while sampling takes place.

                                                                                                                                                                                                                          2055
                                                       14 Toward the end of the
                                                       buildup, the surface readout
                                                       device is pulled out of the hole.


         70                                          80                        90                       100                      110                                       120                      130

                              101                                                             15 The second buildup was interpreted
                                                                                              using data measured in downhole
∆p and Derivative, psi/BOPD


                                                                                                                                                                     103
                                                                                              memory mode and thus covering the
                                                                                              buildup to its very end. The data were
                                                                                                                                            ∆p and Derivative, psi


                                                                                              analyzed off-site, after the drillstring
                              100            Pre-acid buildup                                 was pulled.                                                            102
                                                                                                This match (lines) is based on
                                                                                              a no-flow boundary and a constant-
   Normalized


                                                                                              pressure boundary (possibly the
                              10-1                                                            water table). Another good match                                       101
                                                              Post-acid buildup               to the data was obtained by
                                                                                              assuming a composite radial model.
                                                                                                Only the reservoir engineer in
                                                                                              cooperation with geologist and                                         100
                              10-2
                                                                                              geophysicist can decide which is
                                     10-3    10-2      10-1     100      101        102                                                                                10-3        10-2     10-1         100               101       102
                                                                                              more appropriate.
                                                    Elapsed time, hr                                                                                                                         Elapsed time, hr

                                                                       In five days, with only one pipe trip into the hole, this properly designed and executed well test has
                                                                      brought the exploration well to maximum potential, determined formation permeability, provided
                                                                      representative samples for PVT analysis, investigated far-reservoir boundaries, and set in place a
                                                                      completion strategy for development wells of the field.
                                                                                                                                                                                                                                                       33
nReduction of            Impermeable Boundary
                                                                                   wellbore storage
                                                                                   with downhole                                         Well
                                                                                   shut-in. The log-log
                              Downhole shut-in                                     plot compares two
                     100                                                           well tests, one shut
                                                                                   in at the surface,
                                                                                   the other shut in
∆p and Derivative, psi


                                                                                   downhole. In the
                                                                                   surface shut-in test,
                     10-1                                                          wellbore storage
                                                              Surface shut-in                               Partially Sealing Fault
                                                                                   masks the radial-
                                                                                   flow plateau for                                   Well
                                                                                   over 100 hours
                                                                                   (4 days) (square
                                                                                   data points). The
                     10-2
                                                                                   plateau emerges
                                                                                   clearly in the down-
                                                                                   hole shut-in data
                                                                                   after just one hour
                                                                                   (triangular data
                     10-3                                                          points).                 Intersecting Impermeable Boundaries
                       10-2     10-1         100        101            102         (From Joseph et al,
                                             Time, hr                              reference 6.)

                                                                                                              Well
  on the derivative response. The signs are               the special case in which the test is long
  varied (next page ). A partially penetrated             enough to reach all the no-flow boundaries,
  formation produces a linear trend on the                thus forming a closed system. Examples of
  derivative curve with a slope of –1/2. In wells         no-flow boundaries include sealing
  where the formation is strongly layered or              faults—perhaps several of them—pinchouts,         Parallel Impermeable Boundaries
  naturally fractured, the derivative tends to            and channels. Because no-flow boundaries
  dip before it rises to the radial-flow plateau.         reflect the transient back toward the well,
  If wellbore storage is not too dominating, the          they cause ∆p to rise at higher than its nor-
  transient can be analyzed to pinpoint the               mal radial-flow rate, so the derivative curve                   Well
  most likely explanation.                                jumps to a higher level. A sealing fault
     The last regime on the log-log plot occurs           causes the plateau value to double. With
  when the pressure transient has travelled far           two intersecting sealing faults, the jump is
  from the well and encounters the reservoir              correspondingly higher. If a fault is partially
                                                                                                            Truncated Channel
  or drainage-area limits. Testing theorists              sealing, the derivative curve starts to jump
  have worked out the transient response to a             but then falls back to its radial-flow value.
  catalog of boundary geometries ( right ). In              Constant-pressure boundaries, like a gas
  most cases, the transient responses alone do            cap or aquifer, allow the pressure transient                     Well
  not offer enough differentiation to enable              to flatten out at the boundary pressure, so
  the interpreter to definitively establish the           the derivative takes a nosedive, which is
  boundary type. The choice of the type as                instantly recognizable. In a closed system,
  well as the orientation of the boundary                 pressure is completely contained within the
  geometry must be guided by geologic, seis-              reservoir. How this affects the ∆ p and           Pinchout
  mic and log data.                                       derivative curves depends on whether the                         Well
     There are three categories: no-flow                  transient is a drawdown or buildup. In
  boundary, constant pressure boundary and                drawdown, both curves track a line of unit
                                                          slope, again an easily recognizable effect. In
                                                          buildup, the derivative curve starts moving
                                                          toward the line of unit slope but takes a
                                                          nosedive before reaching it, somewhat simi-
                                                          lar to the constant-pressure boundary case.       nA representative selection of no-flow
                                                            These reservoir models are simpler than         boundaries studied by well-test theorists.
                                                          nature generally allows—in reality, a mix-        Any of these may appear in the late-time
                                                          ture of responses should be expected.             portion of a transient’s diagnostic log-log
                                                          Thanks to the superposition principle, how-       plot. The associated parameters defining
                                                                                                            the boundary may then be estimated by
                                                          ever, responses may be combined to pro-           regression analysis.
                                                          duce a realistic transient response for even
                                                          the most complex situation. Simulating data,
                                                          though, is the easier forward task. More dif-


34                                                                                                                                           Oilfield Review
Log-log          Horner             Specialized               Flow Regimes

                                                                                                          Wellbore


                   ∆p, Derivative
                                                                                                          storage
                                                                                                          Radial


                                              ∆p


                                                                 ∆p
                                                                                                          flow
                                                                                                          Other

                                    Time           Horner time        Function of time
Homogeneous
Reservoir
                                                                                               Wellbore storage
                                                                                               coefficient


                                                                               ∆t
Partially
Penetrating Well


Infinite Conductivity
Vertical Fracture
                                                                                               (Fracture half-length)2
                                                                                               × matrix permeability


                                                                               ∆t
Finite Conductivity
Vertical Fracture
                                                                                               Fracture permeability
                                                                                               × fracture width


                                                                           4
Sealing Fault                                                                  ∆t


                                                                           nResponse of log-log plot (left column) to
                                                                           several common reservoir systems, show-
Constant Pressure                                                          ing different flow regimes (see legend).
Boundary
                                                                           The log-log plot is used by analysts to
                                                                           diagnose the flow regimes present in the
                                                                           transient. Once regimes are identified, the
                                                                           Horner plot (semi-logarithmic) and other
                                                                           specialized plots (linear) are used to eval-
                                                                           uate parameters characterizing the system.

Linear Channel


                                                                                               Matrix permeability
                                                                                               × (channel width)2


                                                                               ∆t
Dual-Porosity


                                                                                                                         35
ficult for the analyst is the inverse procedure      Using a workstation, the reservoir engi-        established in the second buildup to predict
of finding the best model to match actual          neer interacts with a computer program,           pressure response throughout all four peri-
test data (below ).6                               such as STAR Schlumberger Transient Anal-         ods of the test and confirms that the model
   For the traditional test comprising two         ysis and Report and ZODIAC Zoned                  satisfactorily accounts for all data. This may
flow periods and two buildups, transient           Dynamic Interpretation Analysis and Com-          result in more parameter adjustment
analysis focuses on the second buildup. The        putation programs,7 to build a comprehen-         because every period must now be matched
first step is to identify the various regimes on   sive model using all the parameters found         simultaneously, even though the second
the log-log ∆p and derivative-curve plots          for the various flow regimes, predict what        flow period is planned intentionally long to
and then choose the most likely model for          the entire transient should look like, and        minimize the influence of previous periods.
each. Estimation of model parameters is            compare the results with the data. In this           In some cases, interference from earlier
then made using specialized plots that allow       forward modeling process, the interpreter         well manipulations may obscure key
a focused analysis of each flow regime (pre-       tweaks parameters, either manually or auto-       regimes of the transient being analyzed.
vious page ). For example, wellbore storage        matically using a nonlinear regression            Interpreters then resort to a process called
in the early data is determined from the           scheme, and perhaps alters the choice of          desuperposition that attempts to isolate the
slope of the straight-line portion of a linear     model for one of the regimes to obtain the        transient from earlier ones and in particular
∆p versus ∆t plot. Confirmation and charac-        best possible fit. There may be several com-      reform the given transient’s data to mimic
terization of a vertical, high-conductivity        binations of models that match the data           how the reservoir would have reacted if the
fracture, recognized by a half-slope deriva-       equally well. In this case, other data must       flow rate change had been an isolated, per-
tive trend on the log-log plot, come from a        be sought to decide which model is the            fect step.8
plot of ∆ p versus ∆ t . The radial-flow           most appropriate (next page ).                       Designing well tests involves many of the
plateau is best analyzed using the general-          The final interpretation step, called history   same steps the interpreter uses. This is
ized Horner plot. And so on.                       matching or verification, uses the model          because once a test has been proposed,
                                                                                                     both the pressure data and the data’s inter-
                                                                                                     pretation can be simulated to show that the
                                                               Raw data                              test as designed meets its goals—design sim-
                                                                                                     ulation requires estimates of formation and
                                                                                                     fluid parameters from nearby wells or the
                                                                                                     well in question. By predicting the likely
                                                                                                     shape of the log-log ∆ p and derivative
                                                             Preprocessing                           curves, the engineer can demonstrate the
                                                                                                     feasibility of detecting and characterizing
                                                                                                     the anticipated reservoir features. For exam-
                                                                                                     ple, design simulation ensures that wellbore
                             Openhole logs                                                           storage does not smother the feature being
                             PVT data                       Model diagnosis                          sought and guarantees a test that is long
                             Production logs                                                         enough to view suspected reservoir bound-
                                                                                                     aries. Another important feature of simula-
                                                                                                     tion is determining the accuracy and preci-
                                                                                                     sion required of the pressure gauges.
                                                                   Specialized plots                    The design phase not only maps out the
                                                                                                     mechanics of a test, but also ensures that,
                                                                                                     once underway objectives are met. For
                                                                                                     example, the progress of the planned tran-
                                                                                                     sient can be followed at the wellsite and
                                                          Parameter estimation                       compared with that forecast during the
                                                                                                     design. To avoid the costly mistake of rig-
                                                                                                     ging down before the transient indicates a
                                                                                                     desired feature, wellsite validation of data
                                                                                                     during the test remains a must. This is best
                                                            History matching                         accomplished with surface readout of
                                                                                                     downhole gauges and enough computing
                                                                                                     power at the surface to produce appropriate
                                                                                                     plots, notably the log-log diagnostic plot. If
                                                                                                     the reservoir response is quite different from
                                                                 Results                             that assumed in the design, wellsite diagno-
                                                                                                     sis permits an instant correction of the job,
                                                                                                     perhaps a lengthening of the transient, to
                                                           nThe order of business
                                                           in pressure transient
                                                           analysis.


36                                                                                                                               Oilfield Review
Sealing Fault                                     ensure optimum use for the data. In certain
                    101
                                                                            cases, real-time readout is not feasible and
                                                                            downhole recording must be used. Data
                                                                            validation can still be performed onsite right
∆p and Derivative


                                                                            after retrieving the gauges.
                                                                              Integral to well test design is selection of
                    100                                                     hardware, which involves many options. To
                                                                            minimize wellbore storage, should the well
                                                                            be shut in downhole rather than at surface?
                                                                            In a low producer, will the act of shutting in
                                                                            actually kill the well? How sensitive must the
                                                                            pressure gauges be? To some extent, these
                10-1
                                                                            questions are decided by the operator’s stan-
                      Two Intersecting Perpendicular Faults
                101                                                         dard practices, the current status of the hole,
                                                                            the configuration of the downhole hardware
                                                                            and, not least, safety considerations.
                                                                              The options have expanded in recent
∆p and Derivative


                                                                            years. While drillstem test (DST) equipment
                                                                            has always guaranteed downhole shut-in in
                100
                                                                            new wells, downhole shut-in devices for
                                                                            completed wells did not become commer-
                                                                            cial until the early 1980s. Pressure gauges
                                                                            have evolved from crude mechanical
                                                                            devices to quickly reacting, highly accurate
             10-1                                                           quartz gauges. Perhaps the most unexpected
                          Dual-porosity Model                               innovation is a downhole flow measurement.
                101                                                           Traditional well testing theory dispensed
                                                                            with a flow measurement because it
                                                                            assumed constant wellbore storage,
∆p and Derivative


                                                                            enabling flow to be estimated from early
                                                                            pressure data. But reality is less predictable.
                100                                                         Wellbore storage often varies as the fluids in
                                                                            the wellbore change during the test, and a
                                                                            downhole flow measurement in fact offers a
                                                                            valuable complement to conventional pres-
                                                                            sure data.
                                                                              Downhole flow measurements are cur-
             10-1
                                                                            rently performed using production logging
                          Dual-permeability Model
                101                                                         6. Joseph J, Ehlig-Economides CA and Kuchuk F: “The
                                                                               Role of Downhole Flow and Pressure Measurements
                                                                               in Reservoir Testing,” paper SPE 18379, presented at
                                                                               the SPE European Petroleum Conference, London,
∆p and Derivative


                                                                               England, October 16-19, 1988.
                                                                               Ehlig-Economides CA, Joseph JA, Ambrose RW Jr and
                                                                               Norwood C: “A Modern Approach to Reservoir Test-
                100                                                            ing,” Journal of Petroleum Technology 42 (December
                                                                               1990): 1554-1563.
                                                                            7. The newer ZODIAC program includes all the features
                                                                               of the older STAR program.
                                                                            8. Ehlig-Economides CA, Ambrose RW and Joseph JA:
                                                                               “Pressure Desuperposition Technique for Improved
                                                                               Late-Time Transient Diagnosis,” paper SPE 20550,
             10-1                                                              presented at the 65th SPE Annual Technical Confer-
                      10-1                100       101       102     103      ence and Exhibition, New Orleans, Louisiana, USA,
                                                    Time                       September 23-26, 1990.

      nFinding the best model to fit the data. In this case, four scenar-
      ios fit quite well, but the dual-permeability model fits best. Dual
      permeability means a two-layered formation with a different
      permeability in each layer.


      April 1992                                                                                                                      37
tools and therefore not deployable when
                                                                                                                               downhole shut-in is planned. The most
∆p and Derivative


                                                                                                                               common uses are to measure transients
                                                                                                                               caused by either shutting in or altering the
                                                                                                                               flow rate at the surface—the tool, entered
                                                                                                                               into the well through a conventional riser
                                                                                                                               and lubricator, is suspended just above the
                                                                                                                               producing zone. A drawback of the current
                                                                                                                               technology is the threshold and resolution
                                                                                                                               of the spinner in the logging tool that mea-
                                                     Time                                       Model                          sures flow. Well testing experts dream about
                                                                                                                               a robust flow measurement incorporated
                                                        T                                                                      into the DST tool, enabling continuous flow
                                               P(t) =   0
                                                            q(τ) p(t-τ) dτ                                                     measurements in newly drilled wells.
                                                                                                                                  If flow measurements are at hand, how
                                                                                                                               does that change testing analysis? The nec-
                                                                                                                               essary theoretical ground was broken in the
                                                                               Pressure                                        1980s. The underlying principle is, once
                                                                                                                               again, superposition.9 Suppose the pressure
                                                                                                                               response to a unit step change in flow is
                                                                                                                               p(t – t 0 ), where t 0 is when the step change
                                                                                                                               occurs. Then the pressure response, P(t ), to
                                                                                                                               a gradual change in downhole flow rate,
                                                                               Flow rate                                       q (t ), may be computed by approximating
                                                                                                                               the gradual change with a series of stair
                                                                                                                               steps, then considering each step as provid-
                                                                        Time                                                   ing a minitransient, and finally through the
                                                                                                                               superposition principle summing all the
    nThe convolution integral that converts pressure response to a unit step change in flow,                                   minitransients (left ). As the steps are made
    p(t), and actual measured flow rate, q(t), into measured pressure response, P(t). Convo-
    lution revolutionizes transient analysis when downhole flow measurements are avail-                                        smaller, this sum becomes the convolution
    able, for example as measured by production logging in a flowing test. The mathemat-                                       integral:
    ical manipulation virtually wipes out wellbore storage, leaving later portions of the
                                                                                                                                                   T
    transient clearly visible.
                                                                                                                                          P ( t ) = q (τ) p (t– τ ) d τ .
                                                                                                        nAn example
                                                                                                                                                   0

                                                                                                        showing wellbore
                          103                                                                           storage virtually      During a test, downhole pressure gauges
                                                                                                        eliminated using       measure P (t ) and a flowmeter measures q(t ).
                                       Convolution derivative                     Pressure change       the convolution        But p(t ) is what the interpreter wants. Get-
                                                                                                        derivative. The
 ∆p and Derivative, psi


                                                                                                        transient was intro-   ting at it requires the reverse process of
                          102
                                                                               Pressure derivative      duced by chang-        deconvolution, which unfortunately is a
                                                                                                        ing the well’s pro-    rather unstable numerical procedure. More
                                                                                                        duction rate and       commonly, interpreters favor a procedure
                          101                                                                           downhole flow was
                                                                                                        measured using         called logarithmic convolution that converts
                                                                                                        production logging.    the two measurements more easily into
                                                                                                                               something that fits existing analytical tech-
                          100                                                                                                  niques (left ).
                                                                                                                                   Logarithmic convolution is a mathemati-
                                                                                                                               cal trick in which a form for p ( t ) is
                                                                                                                               assumed—usually the response for infinite-
                          10-1
                                                                                                                               acting radial flow—that simplifies the above
                                10-5        10-4     10-3       10-2       10-1       100      101
                                                                                                                               convolution integral to a simpler expression
                                                             Time, hr                                                          involving a rate-normalized pressure
                                                                                                                               P(t )/q (t ), written J (t ), and a new time-scale
                                                                                                                               called sandface rate convolution time, tsfrc .
                                                                                                                               J (t ) and its derivative with respect to tsfrc
                                                                                                                               offer the same diagnostic power as the con-
                                                                                                                               ventional well testing analysis described
                                                                                                                               earlier with the advantage that most of the
                                                                                                                               wellbore storage is removed.


38                                                                                                                                                               Oilfield Review
There are several advantages to testing a                                                 A                    B                    C
well with downhole pressure and flow mea-
                                                                                Surface flow rate
surements under drawdown—and one dis-
advantage. The disadvantage is that reservoir
shut-in pressure is not measured. The advan-
tages are:
•in producing wells, little production is lost                      A
   since the well is never shut-in.
•in poor producers, production is not killed
   as may occur during a shut in.
•in layered reservoirs, testing under draw-
   down reduces the possibility of crossflow                                    Downhole
   between producing layers, while this can                         C
   easily occur in a buildup test complicating
   the interpretation.                                                           Pressure
The technique’s most popular application in
layered reservoirs, though, is in analyzing
individual layer kh and skin values.10
   This involves measuring a series of tran-                        B             Flow
sients created by changing the production
rate, one for each layer with the production
logging tool situated at the top of the layer
(right ). The amount of data acquired is huge
and can be analyzed in several ways with                                                      A                   B                     C
varying degrees of sophistication. The key,                                                                     Time
however, is to first analyze the transient       nSequence of downhole pressure and flow transients measured using a production log-
measured with the tool situated just above       ging tool in a layered reservoir test. A separate transient is measured with the tool posi-
the bottom layer, yielding that layer’s reser-   tioned at the top of each zone. Analyzing the transients yields individual zone perme-
voir properties. Then, a second transient is     ability and skin values.
measured with the tool situated above the
next layer, revealing reservoir properties of    innovation provides a solution. Samples of           9. Meunier D, Wittmann MJ and Stewart G: “Interpreta-
the new layer and bottom layer combined.         extraordinary reliability may now be                    tion of Pressure Buildup Test Using In-Situ Measure-
Since reservoir properties for the bottom        obtained from any number of zones using                 ment of Afterflow,” Journal of Petroleum Technology
                                                                                                         37 (January 1985): 143-152.
layer are already estimated, the transient       the new wireline-conveyed MDT Modular               10. Kucuk F, Karakas M and Ayestaran L: “Well Test
can be analyzed to reveal just the new           Formation Dynamics Tester, but this has to              Analysis of Commingled Zones Without Crossflow,”
layer’s properties. The process continues up     be planned in advance because the sam-                  paper SPE 13081, presented at the 59th SPE Annual
                                                                                                         Technical Conference and Exhibition, Houston
the well.                                        pling takes place in open hole (see “The                Texas, USA, September 16-19, 1984.
   Layered reservoir testing (LRT) was origi-    MDT tool: A Wireline Testing Break-                     Ayestaran L, Ehlig-Economides C, Shah P, Kuchuk F,
nally conceived to investigate production        through,” page 58).                                     Nicolson B and Wittmann M: “Layered Reservoir
                                                                                                         Testing,” The Technical Review 35, no. 4 (October
wells. Recently in offshore Congo, AGIP             In addition to convolution and layered               1987): 4-11.
used the technique to evaluate a layered         reservoir testing, there are other advantages
reservoir encountered by an exploration          to supplementing conventional pressure
well. Conventional testing of individual pay     data with production logging measure-
zones in an exploration well would nor-          ments. A flow profile run during stabilized
mally call for a separate DST-perforation run    production or shut-in can pinpoint where
for each zone. But using layered reservoir       production is coming from and provide
testing, AGIP obtained reliable kh, skin and     invaluable data on crossflow between
productivity index values for individual         zones. The information may directly influ-
zones with only one trip in the hole, at a       ence testing interpretation. For example, if a
considerable cost savings (see “Exploration      zone is producing only from its upper part,
Layered Reservoir Testing in the Congo,“         a portion of the transient will react as if the
next page).                                      well were only partially completed. The
   The drawback of using an LRT in the           diagnosis must be adjusted accordingly. The
exploration setting is that production from      fluid density measurement in production
different zones commingles, ruling out rep-      logging also plays a role by indicating
resentative sampling from different pay          whether gas is coming out of solution, giv-
zones. Fortunately, a recent technological       ing a warning that a test may be occurring
                                                 at below bubblepoint conditions.
                                                    Perhaps the most valuable contribution of
                                                 downhole flow measurements is in testing
                                                                            (continued on page 45)


April 1992                                                                                                                                                39
Exploration Layered Reservoir Testing in the Congo


                                              Luigi Piero                                  Augustine Alagoa
                                              AGIP Congo                                   Pointe-Noire, Congo
                                              Pointe-Noire, Congo


                                              AGIP’s innovative use of layered reservoir testing                                      RFT Pressure        Lower layer
                                              (LRT) in an exploration well occurred offshore                                                              Upper layer


                                                                                                      Pressure potential, bar
                                              Congo. The goal of the test was to evaluate two                                                             Composite
                                                                                                                            308
                                              producing layers only a few meters apart with
                                              only one trip into the hole, a much less costly
                                                                                                                            300
                                              undertaking than the usual two trips. The LRT
                                              technique was originally developed for testing
                                                                                                                            292
                                              production wells, in which several layers produce
                                              commingled—in this case, LRT is a must to eval-
                                              uate each layer’s dynamic properties. Here, AGIP                                    0       10         20       30        40
                                              extended the method to the exploration environ-                                            Bottomhole flow rate, m3/hr
                                              ment, where openhole data suggest several pay         nSelective inflow performance plot for the
                                                                                                    two reservoir layers, showing the lower
                                              zones quite close to each other.
nReservoir geometry near the two layers         The discovered field is an elongated structure
                                                                                                    layer to be easily the more productive
                                                                                                    and the reservoir pressure corrected to a
investigated by a layered reservoir test in
                                                                                                    depth datum of 2735 m to be the same in
AGIP’s Congo exploration well.                bounded by two faults forming a V shape (left).
                                                                                                    both layers—315 bars.
                                              The well penetrates several reservoirs. Five tests
                                              were performed in the well, two using the LRT         in. tubing-conveyed perforating (TCP) guns to
                                              technique. Each LRT test looked at two distinct       enhance cleanup and control perforation damage.
                                              layers. This example presents results from the              The test began with a flow period to clean up
                                              shallower pair.                                       the well, then a shut-in during which a production
                                                The bottom layer is a 17-m [56-ft] thick sand-      logging profile was recorded. The well was then
                                              stone/limestone mix of 26% porosity, while the        opened on a 3/8-in. choke, and transient pressure
                                              top layer is a 7-m [23-ft] thick limestone of 20%     and flow measurements were recorded with the
                                              porosity. The layers are separated by about 4 m       production logging tool positioned above the top
                                              [13 ft] of silts. The well was completed with 7-in.   zone (above). After flow stabilized, a second pro-
                                              casing and perforated underbalanced with 4    1/2-    duction logging profile showed that 95% of pro-
                                                                                                    duction came from 10 m [33 ft] of the bottom
                                                                                                    layer and just 5% from the top layer. The tool was
                                                                                                    then moved to the top of the bottom zone and a
                                                                                                    new transient measured after the choke was
                                                                                                    increased to 1/2 in. The choke was finally
                                                                                                    increased to 3/4 in. and a final transient mea-
                                                                                                    sured with the tool back above the top zone.
                                                                                                          First, the flow profiles were analyzed to obtain
                                                                                                    the inflow performance of and reservoir pressure
                                                                                                    in each layer. Plots of pressure normalized to a


40                                                                                                                                                    Oilfield Review
Well Test Design
Well Test Design
Well Test Design
Well Test Design
Well Test Design

More Related Content

What's hot

Introduction to Reservoir Engineering
Introduction to Reservoir EngineeringIntroduction to Reservoir Engineering
Introduction to Reservoir EngineeringMikeEllingham
 
Well Teste Interpretation
Well Teste InterpretationWell Teste Interpretation
Well Teste InterpretationMeg Medeiros
 
reservoir engineering
reservoir engineeringreservoir engineering
reservoir engineeringbehnamproeng
 
Introduction - Artificial lift
Introduction - Artificial liftIntroduction - Artificial lift
Introduction - Artificial liftAndi Anriansyah
 
Water coning in oil wells and DWS technology
Water coning in oil wells and DWS technologyWater coning in oil wells and DWS technology
Water coning in oil wells and DWS technologyshubhamsaxena2329
 
Drill stem test (mtm)
Drill stem test (mtm)Drill stem test (mtm)
Drill stem test (mtm)majeed talal
 
Q913 re1 w4 lec 13
Q913 re1 w4 lec 13Q913 re1 w4 lec 13
Q913 re1 w4 lec 13AFATous
 
Introduction to Well Testing.pdf
Introduction to Well Testing.pdfIntroduction to Well Testing.pdf
Introduction to Well Testing.pdfssuser2fc67e
 
Q922+de2+l02 v1
Q922+de2+l02 v1Q922+de2+l02 v1
Q922+de2+l02 v1AFATous
 
Semester Project in Reservoir Simulation
Semester Project in Reservoir SimulationSemester Project in Reservoir Simulation
Semester Project in Reservoir SimulationKonstantinos D Pandis
 
Well completion d.pptx
Well completion d.pptxWell completion d.pptx
Well completion d.pptxAihamAltayeh1
 
Repeated Formation Testers
Repeated Formation TestersRepeated Formation Testers
Repeated Formation TestersOmar ElGanzoury
 
Pressure & Rate Transient Analysis.pdf
Pressure & Rate Transient Analysis.pdfPressure & Rate Transient Analysis.pdf
Pressure & Rate Transient Analysis.pdfSeyedAbolfazlHossein4
 

What's hot (20)

Introduction to Reservoir Engineering
Introduction to Reservoir EngineeringIntroduction to Reservoir Engineering
Introduction to Reservoir Engineering
 
Well Teste Interpretation
Well Teste InterpretationWell Teste Interpretation
Well Teste Interpretation
 
reservoir engineering
reservoir engineeringreservoir engineering
reservoir engineering
 
Gas lift design
Gas lift designGas lift design
Gas lift design
 
Artificial Lift Methods
Artificial Lift MethodsArtificial Lift Methods
Artificial Lift Methods
 
Introduction - Artificial lift
Introduction - Artificial liftIntroduction - Artificial lift
Introduction - Artificial lift
 
Artificial lift method
Artificial lift methodArtificial lift method
Artificial lift method
 
Water coning in oil wells and DWS technology
Water coning in oil wells and DWS technologyWater coning in oil wells and DWS technology
Water coning in oil wells and DWS technology
 
Drill stem test (mtm)
Drill stem test (mtm)Drill stem test (mtm)
Drill stem test (mtm)
 
Q913 re1 w4 lec 13
Q913 re1 w4 lec 13Q913 re1 w4 lec 13
Q913 re1 w4 lec 13
 
Introduction to Well Testing.pdf
Introduction to Well Testing.pdfIntroduction to Well Testing.pdf
Introduction to Well Testing.pdf
 
Q922+de2+l02 v1
Q922+de2+l02 v1Q922+de2+l02 v1
Q922+de2+l02 v1
 
Field Development Plan
Field Development PlanField Development Plan
Field Development Plan
 
Semester Project in Reservoir Simulation
Semester Project in Reservoir SimulationSemester Project in Reservoir Simulation
Semester Project in Reservoir Simulation
 
Well completion d.pptx
Well completion d.pptxWell completion d.pptx
Well completion d.pptx
 
Repeated Formation Testers
Repeated Formation TestersRepeated Formation Testers
Repeated Formation Testers
 
Well test-procedures-manual
Well test-procedures-manualWell test-procedures-manual
Well test-procedures-manual
 
Well Control
Well ControlWell Control
Well Control
 
Pressure draw down test .
Pressure draw down test .Pressure draw down test .
Pressure draw down test .
 
Pressure & Rate Transient Analysis.pdf
Pressure & Rate Transient Analysis.pdfPressure & Rate Transient Analysis.pdf
Pressure & Rate Transient Analysis.pdf
 

Viewers also liked

PetroSync - Well Test Analysis
PetroSync - Well Test AnalysisPetroSync - Well Test Analysis
PetroSync - Well Test AnalysisPetroSync
 
Well Test Analysis in Horizontal Wells
Well Test Analysis in Horizontal WellsWell Test Analysis in Horizontal Wells
Well Test Analysis in Horizontal WellsSohil Shah
 
Estimation of skin factor by using pressure transient
Estimation of skin factor by using pressure transientEstimation of skin factor by using pressure transient
Estimation of skin factor by using pressure transientMuhamad Kurdy
 
Well Test Analysis in Horizontal Wells
Well Test Analysis in Horizontal WellsWell Test Analysis in Horizontal Wells
Well Test Analysis in Horizontal WellsSohil Shah
 
Pressure Draw Down Test
Pressure Draw Down TestPressure Draw Down Test
Pressure Draw Down TestMubarik Rao
 
05 well testing trisakti 25 nov 2007
05 well testing   trisakti 25 nov 200705 well testing   trisakti 25 nov 2007
05 well testing trisakti 25 nov 2007yudi05
 
Evaluating storage capability of reservoir using an integrated source-free in...
Evaluating storage capability of reservoir using an integrated source-free in...Evaluating storage capability of reservoir using an integrated source-free in...
Evaluating storage capability of reservoir using an integrated source-free in...Fabio Brambilla
 
Multiple choice testing
Multiple choice testingMultiple choice testing
Multiple choice testingmaduncan
 
Common test techniques
Common test techniquesCommon test techniques
Common test techniquesMaury Martinez
 
Gas Deliverability Analysis
Gas Deliverability AnalysisGas Deliverability Analysis
Gas Deliverability Analysisdwi_riyanto
 
Comtrade file manipulationver1
Comtrade file manipulationver1Comtrade file manipulationver1
Comtrade file manipulationver1Jay Gosalia
 
Intelligent Fields: A New Era for Oil and Gas Field Development
Intelligent Fields: A New Era for Oil and Gas Field DevelopmentIntelligent Fields: A New Era for Oil and Gas Field Development
Intelligent Fields: A New Era for Oil and Gas Field Developmentfhmutairi
 
Formation Damage Presentation Group F
Formation Damage Presentation Group FFormation Damage Presentation Group F
Formation Damage Presentation Group FShaho Mohamedali
 

Viewers also liked (20)

PetroSync - Well Test Analysis
PetroSync - Well Test AnalysisPetroSync - Well Test Analysis
PetroSync - Well Test Analysis
 
Well Test Analysis in Horizontal Wells
Well Test Analysis in Horizontal WellsWell Test Analysis in Horizontal Wells
Well Test Analysis in Horizontal Wells
 
Estimation of skin factor by using pressure transient
Estimation of skin factor by using pressure transientEstimation of skin factor by using pressure transient
Estimation of skin factor by using pressure transient
 
Well Test Analysis in Horizontal Wells
Well Test Analysis in Horizontal WellsWell Test Analysis in Horizontal Wells
Well Test Analysis in Horizontal Wells
 
Well test procedures manual
Well test procedures manualWell test procedures manual
Well test procedures manual
 
Pressure Draw Down Test
Pressure Draw Down TestPressure Draw Down Test
Pressure Draw Down Test
 
05 well testing trisakti 25 nov 2007
05 well testing   trisakti 25 nov 200705 well testing   trisakti 25 nov 2007
05 well testing trisakti 25 nov 2007
 
Corrosion basic
Corrosion basicCorrosion basic
Corrosion basic
 
Evaluating storage capability of reservoir using an integrated source-free in...
Evaluating storage capability of reservoir using an integrated source-free in...Evaluating storage capability of reservoir using an integrated source-free in...
Evaluating storage capability of reservoir using an integrated source-free in...
 
Multiple choice testing
Multiple choice testingMultiple choice testing
Multiple choice testing
 
Common test techniques
Common test techniquesCommon test techniques
Common test techniques
 
Gas Deliverability Analysis
Gas Deliverability AnalysisGas Deliverability Analysis
Gas Deliverability Analysis
 
Formation Damge
Formation Damge Formation Damge
Formation Damge
 
Formation Damage Test.
Formation Damage Test.Formation Damage Test.
Formation Damage Test.
 
Comtrade file manipulationver1
Comtrade file manipulationver1Comtrade file manipulationver1
Comtrade file manipulationver1
 
Intelligent Fields: A New Era for Oil and Gas Field Development
Intelligent Fields: A New Era for Oil and Gas Field DevelopmentIntelligent Fields: A New Era for Oil and Gas Field Development
Intelligent Fields: A New Era for Oil and Gas Field Development
 
Formation Damage Presentation Group F
Formation Damage Presentation Group FFormation Damage Presentation Group F
Formation Damage Presentation Group F
 
Formation Damage and Acid Stimulation Presentation 2.
Formation Damage and Acid Stimulation Presentation 2.Formation Damage and Acid Stimulation Presentation 2.
Formation Damage and Acid Stimulation Presentation 2.
 
Od Intervention
Od InterventionOd Intervention
Od Intervention
 
Skin Effects
Skin EffectsSkin Effects
Skin Effects
 

Similar to Well Test Design

OTC 14009 Deep Offshore Well Metering and Permutation Testing
OTC 14009 Deep Offshore Well Metering and Permutation TestingOTC 14009 Deep Offshore Well Metering and Permutation Testing
OTC 14009 Deep Offshore Well Metering and Permutation Testingguest467223b
 
registro de pozoz
registro de pozozregistro de pozoz
registro de pozozopulento22
 
HPHT LWD & EWL formation testing SPWLA 2006
HPHT LWD & EWL formation testing SPWLA 2006HPHT LWD & EWL formation testing SPWLA 2006
HPHT LWD & EWL formation testing SPWLA 2006alanmchardy
 
Permeability From Cap Curve To Flowrate
Permeability   From Cap Curve To FlowratePermeability   From Cap Curve To Flowrate
Permeability From Cap Curve To FlowrateGraham Davis
 
Drilling Fluid Engineering-Viscosity & Yeild Point.pdf
Drilling Fluid Engineering-Viscosity & Yeild Point.pdfDrilling Fluid Engineering-Viscosity & Yeild Point.pdf
Drilling Fluid Engineering-Viscosity & Yeild Point.pdfSARWAR SALAM
 
Comparison of Pressure Drop Characteristics of Swing Plate and Dual Plate Che...
Comparison of Pressure Drop Characteristics of Swing Plate and Dual Plate Che...Comparison of Pressure Drop Characteristics of Swing Plate and Dual Plate Che...
Comparison of Pressure Drop Characteristics of Swing Plate and Dual Plate Che...IRJET Journal
 
Grl report #103067 grlweap - lpv 16[1].2
Grl report #103067   grlweap - lpv 16[1].2Grl report #103067   grlweap - lpv 16[1].2
Grl report #103067 grlweap - lpv 16[1].2robinking277
 
SPE 160891 Tar Characterization for Optimum Reservoir .docx
SPE 160891 Tar Characterization for Optimum Reservoir .docxSPE 160891 Tar Characterization for Optimum Reservoir .docx
SPE 160891 Tar Characterization for Optimum Reservoir .docxrafbolet0
 
431816062-IPR-and-FIPR-pdf.pdf
431816062-IPR-and-FIPR-pdf.pdf431816062-IPR-and-FIPR-pdf.pdf
431816062-IPR-and-FIPR-pdf.pdfMohanadHussien2
 
Permeability Evaluation in Pilaspi (M. Eocene - U. Eocene) Formation
Permeability Evaluation in Pilaspi (M. Eocene - U. Eocene) FormationPermeability Evaluation in Pilaspi (M. Eocene - U. Eocene) Formation
Permeability Evaluation in Pilaspi (M. Eocene - U. Eocene) FormationIJERA Editor
 
IMWA2013_Swanson_511
IMWA2013_Swanson_511IMWA2013_Swanson_511
IMWA2013_Swanson_511Eric Swanson
 
Tubing Performance Relation (TPR)
Tubing Performance Relation (TPR)Tubing Performance Relation (TPR)
Tubing Performance Relation (TPR)James Craig
 

Similar to Well Test Design (20)

RFT & MDT.pdf
RFT & MDT.pdfRFT & MDT.pdf
RFT & MDT.pdf
 
Texto ipr
Texto   iprTexto   ipr
Texto ipr
 
1.1 Introduction to Art.lift.ppt
1.1  Introduction  to Art.lift.ppt1.1  Introduction  to Art.lift.ppt
1.1 Introduction to Art.lift.ppt
 
OTC 14009 Deep Offshore Well Metering and Permutation Testing
OTC 14009 Deep Offshore Well Metering and Permutation TestingOTC 14009 Deep Offshore Well Metering and Permutation Testing
OTC 14009 Deep Offshore Well Metering and Permutation Testing
 
registro de pozoz
registro de pozozregistro de pozoz
registro de pozoz
 
HPHT LWD & EWL formation testing SPWLA 2006
HPHT LWD & EWL formation testing SPWLA 2006HPHT LWD & EWL formation testing SPWLA 2006
HPHT LWD & EWL formation testing SPWLA 2006
 
Nodal analysis
Nodal analysisNodal analysis
Nodal analysis
 
Permeability From Cap Curve To Flowrate
Permeability   From Cap Curve To FlowratePermeability   From Cap Curve To Flowrate
Permeability From Cap Curve To Flowrate
 
Flumping
FlumpingFlumping
Flumping
 
Drilling Fluid Engineering-Viscosity & Yeild Point.pdf
Drilling Fluid Engineering-Viscosity & Yeild Point.pdfDrilling Fluid Engineering-Viscosity & Yeild Point.pdf
Drilling Fluid Engineering-Viscosity & Yeild Point.pdf
 
Comparison of Pressure Drop Characteristics of Swing Plate and Dual Plate Che...
Comparison of Pressure Drop Characteristics of Swing Plate and Dual Plate Che...Comparison of Pressure Drop Characteristics of Swing Plate and Dual Plate Che...
Comparison of Pressure Drop Characteristics of Swing Plate and Dual Plate Che...
 
Grl report #103067 grlweap - lpv 16[1].2
Grl report #103067   grlweap - lpv 16[1].2Grl report #103067   grlweap - lpv 16[1].2
Grl report #103067 grlweap - lpv 16[1].2
 
SPE 160891 Tar Characterization for Optimum Reservoir .docx
SPE 160891 Tar Characterization for Optimum Reservoir .docxSPE 160891 Tar Characterization for Optimum Reservoir .docx
SPE 160891 Tar Characterization for Optimum Reservoir .docx
 
431816062-IPR-and-FIPR-pdf.pdf
431816062-IPR-and-FIPR-pdf.pdf431816062-IPR-and-FIPR-pdf.pdf
431816062-IPR-and-FIPR-pdf.pdf
 
Brownn.docx
Brownn.docxBrownn.docx
Brownn.docx
 
Spe 121557-ms
Spe 121557-msSpe 121557-ms
Spe 121557-ms
 
[IJET-V1I2P10] Authors :L. O. Osuman, A. Dosunmu , B .S. Odagme
[IJET-V1I2P10] Authors :L. O. Osuman, A. Dosunmu , B .S. Odagme [IJET-V1I2P10] Authors :L. O. Osuman, A. Dosunmu , B .S. Odagme
[IJET-V1I2P10] Authors :L. O. Osuman, A. Dosunmu , B .S. Odagme
 
Permeability Evaluation in Pilaspi (M. Eocene - U. Eocene) Formation
Permeability Evaluation in Pilaspi (M. Eocene - U. Eocene) FormationPermeability Evaluation in Pilaspi (M. Eocene - U. Eocene) Formation
Permeability Evaluation in Pilaspi (M. Eocene - U. Eocene) Formation
 
IMWA2013_Swanson_511
IMWA2013_Swanson_511IMWA2013_Swanson_511
IMWA2013_Swanson_511
 
Tubing Performance Relation (TPR)
Tubing Performance Relation (TPR)Tubing Performance Relation (TPR)
Tubing Performance Relation (TPR)
 

Recently uploaded

EPANDING THE CONTENT OF AN OUTLINE using notes.pptx
EPANDING THE CONTENT OF AN OUTLINE using notes.pptxEPANDING THE CONTENT OF AN OUTLINE using notes.pptx
EPANDING THE CONTENT OF AN OUTLINE using notes.pptxRaymartEstabillo3
 
POINT- BIOCHEMISTRY SEM 2 ENZYMES UNIT 5.pptx
POINT- BIOCHEMISTRY SEM 2 ENZYMES UNIT 5.pptxPOINT- BIOCHEMISTRY SEM 2 ENZYMES UNIT 5.pptx
POINT- BIOCHEMISTRY SEM 2 ENZYMES UNIT 5.pptxSayali Powar
 
KSHARA STURA .pptx---KSHARA KARMA THERAPY (CAUSTIC THERAPY)————IMP.OF KSHARA ...
KSHARA STURA .pptx---KSHARA KARMA THERAPY (CAUSTIC THERAPY)————IMP.OF KSHARA ...KSHARA STURA .pptx---KSHARA KARMA THERAPY (CAUSTIC THERAPY)————IMP.OF KSHARA ...
KSHARA STURA .pptx---KSHARA KARMA THERAPY (CAUSTIC THERAPY)————IMP.OF KSHARA ...M56BOOKSTORE PRODUCT/SERVICE
 
Presiding Officer Training module 2024 lok sabha elections
Presiding Officer Training module 2024 lok sabha electionsPresiding Officer Training module 2024 lok sabha elections
Presiding Officer Training module 2024 lok sabha electionsanshu789521
 
Final demo Grade 9 for demo Plan dessert.pptx
Final demo Grade 9 for demo Plan dessert.pptxFinal demo Grade 9 for demo Plan dessert.pptx
Final demo Grade 9 for demo Plan dessert.pptxAvyJaneVismanos
 
Biting mechanism of poisonous snakes.pdf
Biting mechanism of poisonous snakes.pdfBiting mechanism of poisonous snakes.pdf
Biting mechanism of poisonous snakes.pdfadityarao40181
 
Interactive Powerpoint_How to Master effective communication
Interactive Powerpoint_How to Master effective communicationInteractive Powerpoint_How to Master effective communication
Interactive Powerpoint_How to Master effective communicationnomboosow
 
Employee wellbeing at the workplace.pptx
Employee wellbeing at the workplace.pptxEmployee wellbeing at the workplace.pptx
Employee wellbeing at the workplace.pptxNirmalaLoungPoorunde1
 
How to Configure Email Server in Odoo 17
How to Configure Email Server in Odoo 17How to Configure Email Server in Odoo 17
How to Configure Email Server in Odoo 17Celine George
 
Roles & Responsibilities in Pharmacovigilance
Roles & Responsibilities in PharmacovigilanceRoles & Responsibilities in Pharmacovigilance
Roles & Responsibilities in PharmacovigilanceSamikshaHamane
 
Software Engineering Methodologies (overview)
Software Engineering Methodologies (overview)Software Engineering Methodologies (overview)
Software Engineering Methodologies (overview)eniolaolutunde
 
CARE OF CHILD IN INCUBATOR..........pptx
CARE OF CHILD IN INCUBATOR..........pptxCARE OF CHILD IN INCUBATOR..........pptx
CARE OF CHILD IN INCUBATOR..........pptxGaneshChakor2
 
Earth Day Presentation wow hello nice great
Earth Day Presentation wow hello nice greatEarth Day Presentation wow hello nice great
Earth Day Presentation wow hello nice greatYousafMalik24
 
DATA STRUCTURE AND ALGORITHM for beginners
DATA STRUCTURE AND ALGORITHM for beginnersDATA STRUCTURE AND ALGORITHM for beginners
DATA STRUCTURE AND ALGORITHM for beginnersSabitha Banu
 
Painted Grey Ware.pptx, PGW Culture of India
Painted Grey Ware.pptx, PGW Culture of IndiaPainted Grey Ware.pptx, PGW Culture of India
Painted Grey Ware.pptx, PGW Culture of IndiaVirag Sontakke
 
“Oh GOSH! Reflecting on Hackteria's Collaborative Practices in a Global Do-It...
“Oh GOSH! Reflecting on Hackteria's Collaborative Practices in a Global Do-It...“Oh GOSH! Reflecting on Hackteria's Collaborative Practices in a Global Do-It...
“Oh GOSH! Reflecting on Hackteria's Collaborative Practices in a Global Do-It...Marc Dusseiller Dusjagr
 
Historical philosophical, theoretical, and legal foundations of special and i...
Historical philosophical, theoretical, and legal foundations of special and i...Historical philosophical, theoretical, and legal foundations of special and i...
Historical philosophical, theoretical, and legal foundations of special and i...jaredbarbolino94
 

Recently uploaded (20)

EPANDING THE CONTENT OF AN OUTLINE using notes.pptx
EPANDING THE CONTENT OF AN OUTLINE using notes.pptxEPANDING THE CONTENT OF AN OUTLINE using notes.pptx
EPANDING THE CONTENT OF AN OUTLINE using notes.pptx
 
POINT- BIOCHEMISTRY SEM 2 ENZYMES UNIT 5.pptx
POINT- BIOCHEMISTRY SEM 2 ENZYMES UNIT 5.pptxPOINT- BIOCHEMISTRY SEM 2 ENZYMES UNIT 5.pptx
POINT- BIOCHEMISTRY SEM 2 ENZYMES UNIT 5.pptx
 
Model Call Girl in Tilak Nagar Delhi reach out to us at 🔝9953056974🔝
Model Call Girl in Tilak Nagar Delhi reach out to us at 🔝9953056974🔝Model Call Girl in Tilak Nagar Delhi reach out to us at 🔝9953056974🔝
Model Call Girl in Tilak Nagar Delhi reach out to us at 🔝9953056974🔝
 
KSHARA STURA .pptx---KSHARA KARMA THERAPY (CAUSTIC THERAPY)————IMP.OF KSHARA ...
KSHARA STURA .pptx---KSHARA KARMA THERAPY (CAUSTIC THERAPY)————IMP.OF KSHARA ...KSHARA STURA .pptx---KSHARA KARMA THERAPY (CAUSTIC THERAPY)————IMP.OF KSHARA ...
KSHARA STURA .pptx---KSHARA KARMA THERAPY (CAUSTIC THERAPY)————IMP.OF KSHARA ...
 
Presiding Officer Training module 2024 lok sabha elections
Presiding Officer Training module 2024 lok sabha electionsPresiding Officer Training module 2024 lok sabha elections
Presiding Officer Training module 2024 lok sabha elections
 
Final demo Grade 9 for demo Plan dessert.pptx
Final demo Grade 9 for demo Plan dessert.pptxFinal demo Grade 9 for demo Plan dessert.pptx
Final demo Grade 9 for demo Plan dessert.pptx
 
Biting mechanism of poisonous snakes.pdf
Biting mechanism of poisonous snakes.pdfBiting mechanism of poisonous snakes.pdf
Biting mechanism of poisonous snakes.pdf
 
Interactive Powerpoint_How to Master effective communication
Interactive Powerpoint_How to Master effective communicationInteractive Powerpoint_How to Master effective communication
Interactive Powerpoint_How to Master effective communication
 
Employee wellbeing at the workplace.pptx
Employee wellbeing at the workplace.pptxEmployee wellbeing at the workplace.pptx
Employee wellbeing at the workplace.pptx
 
How to Configure Email Server in Odoo 17
How to Configure Email Server in Odoo 17How to Configure Email Server in Odoo 17
How to Configure Email Server in Odoo 17
 
Roles & Responsibilities in Pharmacovigilance
Roles & Responsibilities in PharmacovigilanceRoles & Responsibilities in Pharmacovigilance
Roles & Responsibilities in Pharmacovigilance
 
Software Engineering Methodologies (overview)
Software Engineering Methodologies (overview)Software Engineering Methodologies (overview)
Software Engineering Methodologies (overview)
 
CARE OF CHILD IN INCUBATOR..........pptx
CARE OF CHILD IN INCUBATOR..........pptxCARE OF CHILD IN INCUBATOR..........pptx
CARE OF CHILD IN INCUBATOR..........pptx
 
Earth Day Presentation wow hello nice great
Earth Day Presentation wow hello nice greatEarth Day Presentation wow hello nice great
Earth Day Presentation wow hello nice great
 
DATA STRUCTURE AND ALGORITHM for beginners
DATA STRUCTURE AND ALGORITHM for beginnersDATA STRUCTURE AND ALGORITHM for beginners
DATA STRUCTURE AND ALGORITHM for beginners
 
TataKelola dan KamSiber Kecerdasan Buatan v022.pdf
TataKelola dan KamSiber Kecerdasan Buatan v022.pdfTataKelola dan KamSiber Kecerdasan Buatan v022.pdf
TataKelola dan KamSiber Kecerdasan Buatan v022.pdf
 
Painted Grey Ware.pptx, PGW Culture of India
Painted Grey Ware.pptx, PGW Culture of IndiaPainted Grey Ware.pptx, PGW Culture of India
Painted Grey Ware.pptx, PGW Culture of India
 
9953330565 Low Rate Call Girls In Rohini Delhi NCR
9953330565 Low Rate Call Girls In Rohini  Delhi NCR9953330565 Low Rate Call Girls In Rohini  Delhi NCR
9953330565 Low Rate Call Girls In Rohini Delhi NCR
 
“Oh GOSH! Reflecting on Hackteria's Collaborative Practices in a Global Do-It...
“Oh GOSH! Reflecting on Hackteria's Collaborative Practices in a Global Do-It...“Oh GOSH! Reflecting on Hackteria's Collaborative Practices in a Global Do-It...
“Oh GOSH! Reflecting on Hackteria's Collaborative Practices in a Global Do-It...
 
Historical philosophical, theoretical, and legal foundations of special and i...
Historical philosophical, theoretical, and legal foundations of special and i...Historical philosophical, theoretical, and legal foundations of special and i...
Historical philosophical, theoretical, and legal foundations of special and i...
 

Well Test Design

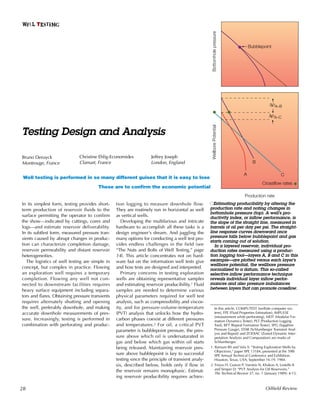
  • 1. WE LL TES TiNG Bottomhole pressure Bubblepoint ∆pA–B ∆pA–C Wellbore Potential Testing Design and Analysis Bruno Deruyck Christine Ehlig-Economides Jeffrey Joseph Montrouge, France Clamart, France London, England B A C Well testing is performed in so many different guises that it is easy to lose Crossflow rates These are to confirm the economic potential Production rate In its simplest form, testing provides short- tion logging to measure downhole flow. nEstimating producibility by altering the term production of reservoir fluids to the They are routinely run in horizontal as well production rate and noting changes in bottomhole pressure (top). A well’s pro- surface permitting the operator to confirm as vertical wells. ductivity index, or inflow performance, is the show—indicated by cuttings, cores and Developing the multifarious and intricate the slope of the straight line, measured in logs—and estimate reservoir deliverability. hardware to accomplish all these tasks is a barrels of oil per day per psi. The straight- In its subtlest form, measured pressure tran- design engineer’s dream. And juggling the line response curves downward once sients caused by abrupt changes in produc- many options for conducting a well test pro- pressure falls below bubblepoint and gas starts coming out of solution. tion can characterize completion damage, vides endless challenges in the field (see In a layered reservoir, individual pro- reservoir permeability and distant reservoir “The Nuts and Bolts of Well Testing,” page duction rates measured using a produc- heterogeneities. 14). This article concentrates not on hard- tion logging tool—layers A, B and C in this The logistics of well testing are simple in ware but on the information well tests give example—are plotted versus each layer’s wellbore potential, the wellbore pressure concept, but complex in practice. Flowing and how tests are designed and interpreted. normalized to a datum. This so-called an exploration well requires a temporary Primary concerns in testing exploration selective inflow performance technique completion. Flowing any well not con- wells are obtaining representative samples reveals individual layer inflow perfor- nected to downstream facilities requires and estimating reservoir producibility.1 Fluid mances and also pressure imbalances heavy surface equipment including separa- samples are needed to determine various between layers that can promote crossflow. tors and flares. Obtaining pressure transients physical parameters required for well test requires alternately shutting and opening analysis, such as compressibility and viscos- the well, preferably downhole, and making ity, and for pressure-volume-temperature In this article, COMPUTEST (wellsite computer sys- accurate downhole measurements of pres- (PVT) analysis that unlocks how the hydro- tem), FPE (Fluid Properties Estimation), IMPULSE (measurement while perforating), MDT (Modular For- sure. Increasingly, testing is performed in carbon phases coexist at different pressures mation Dynamics Tester), PLT (Production Logging combination with perforating and produc- and temperatures.2 For oil, a critical PVT Tool), RFT (Repeat Formation Tester), SPG (Sapphire parameter is bubblepoint pressure, the pres- Pressure Gauge), STAR (Schlumberger Transient Anal- ysis and Report) and ZODIAC (Zoned Dynamic Inter- sure above which oil is undersaturated in pretation Analysis and Computation) are marks of gas and below which gas within oil starts Schlumberger. being released. Maintaining reservoir pres- 1. Barnum RS and Vela S: “Testing Exploration Wells by Objectives,” paper SPE 13184, presented at the 59th sure above bubblepoint is key to successful SPE Annual Technical Conference and Exhibition, testing since the principle of transient analy- Houston, Texas, USA, September 16-19, 1984. sis, described below, holds only if flow in 2. Freyss H, Guieze P, Varotsis N, Khakoo A, Lestelle K and Simper D: “PVT Analysis for Oil Reservoirs,” the reservoir remains monophasic. Estimat- The Technical Review 37, no. 1 (January 1989): 4-15. ing reservoir producibility requires achiev- 28 Oilfield Review
  • 2. ing stable flow rates at several choke sizes ity—and it can determine the producing everywhere, eventually reaching the reser- and then determining the productivity index zone’s permeability-thickness product, kh. It voir pressure that drives production. from the slope of the flow versus drawdown can see to the limits of the reservoir indicat- The reservoir engineer follows this chain pressure data (previous page ). ing the probable shape (but not orientation) of events by measuring the pressure The type of oil as determined by a sample of the reservoir boundaries and can show buildup, or transient, and through analysis and the ability of the well to produce are whether the primary recovery mechanism is determines information about the reservoir the first steps toward commercial exploita- from water or gas-cap support. This infor- from near the wellbore to its limits. An anal- tion. If well productivity is less than mation becomes crucial in the appraisal and ogous chain of events occurs if instead of expected, then wellbore damage may be production stages of field development shutting in the well, the well is opened and the cause. This is the next concern in testing when engineers combine testing interpreta- allowed to flow. Again, it is oil near the exploration wells. Estimating the near-well- tion results with seismic and geologic data wellbore that first senses the disturbance, bore condition to perform necessary reme- to refine their understanding of the reservoir. but it is only a matter of time for oil deeper dial action and ultimately to plan a well How does transient pressure testing work? in the reservoir to respond and begin flow- completion strategy for the field is accom- Imagine first an oil well in stable production ing too. Drawdown pressure measurements plished from the transient analysis part of a with a certain pressure drawdown between to track these events practically mirror the well test. the far limits of the reservoir and the well. buildup response. In fact, transients can be Transient analysis, however, reaches Now shut in the well. In the formation, a obtained simply by increasing or decreasing deeper than just the near-wellbore region. sort of concertina effect takes place (below). the flow rate. Today, it contributes so much to characteriz- Oil near the wellbore is the first to sense the Transient testing depends on accurate ing the reservoir that engineers increasingly shut-in and gets stopped in its tracks as it pressure measurements taken long enough refer to well testing as reservoir testing. tries to push more oil ahead of it, getting after the flow rate change to observe what Analysis can indicate the likely producing compressed in the process. Then, the shock the test was designed to detect. Impulse test- mechanism of the formation—for example, is felt farther away as news of the shut-in, so ing, for example, measures the transient that how much production comes from frac- to speak, travels to the outer regions of the occurs as a well is perforated, allowed to tures, how much from intergranular poros- reservoir. Gradually, the pressure builds up produce for a short time and then shut in. sight of its two real purposes. of a discovery well and to maximize the cost efficiency of production in a developing or mature field. Integrated with other measurements, well tests help provide the basis of reservoir characterization. Fracture Sealing fault nPlan view showing the movement of wave fronts of a pressure transient progressing away from a well. This shows a hydraulically fractured well drilled near a sealing fault. Once wellbore storage disappears, the tran- sient moves into the formation along linear paths perpendicular to the fracture. Farther from the well, the transient moves radially from the borehole. On hitting the sealing fault, the transient begins reflecting back toward the borehole. April 1992 29
  • 3. The primary target is the near-wellbore Impulse Conventional Interference region (right ).3 The goal is to assess forma- tion damage and, if necessary, perform stim- ulation. Tests last just an hour or two. In a conventional test conducted to investigate reservoir boundaries, often called a limit test, the transient must be long enough for the pressure disturbance to reach the boundaries and then create a measurable response in the well. How long this takes depends on formation and fluid characteris- tics. In particular, the lower the formation permeability, the more time is needed—tests can continue for days. Longest lasting are interference tests, in which the effect of a transient created in one well is observed in another, yielding information about reser- voir transmissivity and storativity. The analysis and interpretation of well tests have evolved remarkably since the technique became established in the 1930s. Today, a unified methodology has devel- Flow oped to obtain the maximum information from any transient.4 The conventional test on a new well comprises two flow periods and two shut-ins (next page). The first flow period, perhaps an hour long, is designed to Pressure clean up the near-wellbore region and give the field crew time to manipulate chokes to establish a practical, stable flow rate. The well is then shut in and pressure builds up to reservoir pressure, an important parame- Time ter for the reservoir engineer. Then begins a long flow period, followed by a shut-in last- nThree types of well testing: Impulse, conventional and interference. Impulse testing ing at least 1.2 to 1.5 times as long. This last measures the transient caused by a very brief flow, typically just as the well is perfo- step generates the transient designed to rated. Results yield skin and permeability and may indicate if remedial stimulation is required. Conventional well testing measures the shut-in transient after a lengthy flow yield the reservoir’s secrets. Of course, there period and is often used to detect reservoir limits. Interference testing measures the are many variants on this theme (see “Text- transient in a well caused by one or more flow pulses in a nearby well. Results yield book Well Test from the Congo,” page 33). details about interwell transmissivity and storativity. 3. Ayestaran L, Ayoub J, Campbell J, Fairhurst D, Herrera The basic data obtained are change in bated if well pressure toward the top of the IC, Munsell S and Sneed BJ: “IMPULSE Testing,” The pressure, ∆p, versus elapsed time since the well drops below bubblepoint and part of Technical Review 36, no. 4 (October 1988): 37-45. transient was initiated, ∆t. In traditional the well is filled with compressible gas. 4. For a review: analysis, ∆p is plotted against the logarithm Wellbore storage is substantially reduced by Horne RN: Modern Well Test Analysis: A Computer- Aided Approach. Palo Alto, California, USA: of (tp + ∆t )/∆t , a dimensionless variable in shutting in the well downhole, minimizing Petroway, Inc, 1990. which tp is the duration of the flow period. the volume of fluids that contribute. For the development of well test analysis: This is the Horner plot—( t p + ∆ t )/∆ t is As wellbore storage dissipates, the tran- Ramey HJ Jr: “Advances in Practical Well Test Analy- called Horner time (next page)—and the sient begins to move into the formation. sis,” paper SPE 20592, presented at the 65th SPE Annual Technical Conference and Exhibition, New transient is analyzed by tracing the Pressure continues building up, but at a Orleans, Louisiana, USA, September 23-26, 1990. progress of the data from right to left. slower rate as the transient moves far 5. Bourdet D, Whittle TM, Douglas AA and Pirard YM: First comes wellbore storage, which refers enough to achieve radial flow toward the “A New Set of Type Curves Simplifies Well Test to the obfuscating role of the wellbore fluid wellbore. This is the so-called radial-flow Analysis,” World Oil 196 (May 1983): 95-106. Bourdet D, Ayoub JA and Pirard YM: “Use of Pressure when a transient is initiated. The moment a regime that appears as a straight line trend Derivative in Well Test Interpretation, paper SPE well is shut in or allowed to flow, fluids in on the Horner plot. The radial-flow regime 12777, presented at the 1984 California Regional the wellbore must first compress or expand is crucial to quantitative interpretation, since Meeting, Long Beach, California, USA, April 11-13, 1984. before formation fluids can react. If flow is it provides values for kh and skin, S, a mea- controlled from the surface, the entire well’s fluids contribute to wellbore storage and the effect can dominate the pressure transient for hours afterward. The effect is exacer- 30 Oilfield Review
  • 4. sure of the extra pressure drop caused by most complex series of drawdowns and A pressure transient breaks into several wellbore damage. Skin takes positive values buildups, providing that the radial-flow regimes on the log-log plot, each seeing in a damaged well when pressure drop near regime is present in the response. deeper than the last. The first regime typi- the wellbore is greater than expected and Although the Horner plot is acceptable for cally reflects wellbore storage, during which negative values when stimulation creates interpreting the radial-flow regime of easy- both the pressure and derivative curves less pressure drop. Next, the transient to-interpret tests, a straight-line trend is often overlay and increase along a straight line of encounters the limits of the reservoir and difficult to pick out. Alternatively, there may unit slope. As wellbore fluids stabilize, pres- pressure departs from its straight-line radial- be several straight-line trends, of which only sure continues building up, but at a slower flow response. one represents radial flow. Also, the plot rate. The derivative curve swings down, The definition of Horner time is based on fails to provide ready insight into the nature eventually flattening out as the transient a step change in flow rate, with one flow of reservoir limits. As pressure measure- moves far enough from the wellbore to period followed by a buildup. In actual ments improved in accuracy, it was this achieve radial flow. Since the radial-flow tests, there are always at least two prior flow aspect that increasingly engaged the atten- regime is a straight-line trend on the Horner periods, often many more, and each affects tion of reservoir engineers. The solution, dis- plot, the derivative curve on the log-log plot the pressure response after it occurs. Never- covered in in the early 1980s, was a double is constant and traces a horizontal line. The theless, their cumulative effect can be deter- logarithmic, or log-log, plot of two sets of interpreter’s first task always is to identify mined using the superposition principle, data versus ∆t (below).5 One set is simply this derivative plateau, but this may require which states that transients occurring ∆p, the other is the gradient, or derivative, waiting a long time in tests dominated by sequentially simply add up. This results in of the response on the Horner plot. The wellbore storage (page 34, top). generalized Horner time that takes into virtue of the log-log plot is that reservoirs Lengthy wellbore storage can totally mask account the flow rates and flow times for all similar in construction but perhaps differing earlier flow regimes that occur for certain previous flow periods. Using generalized in thickness, porosity and permeability give borehole-formation configurations and for- Horner time, the Horner plot retains its rise to similar looking responses and can be mation types, causing distinct perturbations validity in determining kh and skin for the recognized as belonging to a class. (continued on page 34) Data 1st Flow 1st 2nd Flow 2nd Buildup Buildup Pressure Horner Plot Limits Radial flow Time Wellbore ∆p nElements of a conventional two-stage buildup tran- storage sient test. Testing engineers use the first flow period to clean up formation damage and adjust the choke to gauge the producing capacity of the well. The first buildup provides a first estimate of reservoir pressure. Then begins a long flow period, followed by a longer buildup. Analysis of the transient measured during this (tp + ∆t )/∆t second buildup reveals details of the near-wellbore Log-Log Plot region, formation characteristics such as permeability, and distant limits of the reservoir. Traditional analysis centered on the Horner plot (middle), in particular the straight-line trend that sig- ∆p and Derivative nals radial flow. Today, the log-log plot (bottom) of ∆p Wellbore and the derivative, the slope of the Horner plot, is used storage to first diagnose the various flow regimes of the tran- sient. Then, specialized plots such as the Horner plot are used to estimate specific parameters such as per- Limits Limits meability, skin and reservoir pressure. Radial flow ∆t April 1992 31
  • 5. 5 Five pressures, one obtained in surface readout and four in memory mode, are compared after normalization for different gauge depths. Agreement is within 12 psi, well within bounds of gauge technology. 6 During the buildup, the 104 measured pressure transient (data 3065 points) is compared at the wellsite to S = 20 Surface readout the design (solid lines), which considered ∆p and Derivative, psi SPG gauge a range of skin values between –3 and 5 Qtz. gauge 2 20. A value of –3 corresponds to a 103 0 Pressure, psi stimulated formation, 20 to a damaged one. Finding skin was crucial because –3 it determined the necessity of an acid job. Overlaying the data on the design 102 shows skin to be between 0 and Qtz. gauge 1 5—in fact, it was calculated at 1. This Strain gauge indicated that an acid job would 3035 probably benefit production. 19 19.5 20 Permeability is less important here, 101 Time, hr because it is well known in the area— 10-4 10-3 10-2 10-1 100 101 100 md was assumed for the design, Elapsed time, hr 85 md was estimated from the data. 2 Downhole pressure jumps to the reservoir pressure level 4800 and then drops as the well is opened to clean up perforation 9 The well is shut in as the acid job is prepared and Pressure, psi debris. performed. 3 The well is shut in so the surface readout device can be 11 The well is shut in so the lowered into the hole. surface readout device can be lowered again and hooked into the drillstem test tool. Flow rate, bopd 1000 10 The well is flowed back to clean up after the acid job. 1000 0 0 10 20 30 40 50 Time, hr 60 1 The test begins with under- 13 Comparison at wellsite between balanced perforation to 8 A short flow period BOPD/psi pre- and post-acid buildups using minimize wellbore damage during which a 0 5 surface pressure readout data. using tubing-conveyed production logging 2035 Using specialized analysis, the data perforating guns slung below profile is made, Perfs. indicates pre-acid skin to be 1, and the drillstem test tool. the tool passing post-acid skin to be –2, a substantial through the fullbore 2040 improvement. Limest. drillstem tool to the Because the post-acid drawdown Depth, m 4 With pressure now available newly perforated and buildups are comparitively longer, at the surface (red curve), a reservoir formations 2045 the data sees further into the 6-hour flow period begins, below. The flow profile reservoir. After the radial-flow followed by a slightly longer shows good production regime plateau, the post-acid Sandstone buildup. from the sandstone 2050 derivative goes up and then down, but not so good from eventually becoming noisy as gauge the overlying limestone, resolution is coming into play. This is 7 Once the radial-flow regime confirming that of the buildup is confirmed, 2055 the time to halt the test. production would the surface readout device is definitely benefit pulled out of the hole. from an acid job. Pressure data change color, from surface readout to downhole memory mode. 32 Oilfield Review
  • 6. Textbook Well Test from the Congo Gilles Bourdarot This textbook case study comes from an Elf exploration well in the Congo. The 2200-m [7218-ft] Alain Desplanques deep reservoir comprises a limestone overlying a sandstone, both having 20 to 22% porosity. The Elf Congo well test uses all the modern techniques—tubing-conveyed perforating, production logging and Pointe-Noire, Congo sampling through fullbore drillstem equipment, surface readout and wellsite validation—and is designed to accomplish two goals: Mike Pearson One is to estimate near-wellbore damage, reducing it if necessary with a matrix acidization and Montrouge, France then checking that the acid cleanup worked—all without removing the drillstring from the hole. This was intended not only to benefit production in the well, but also to help plan a completion strategy for field development. The other goal was to investigate reservoir volume and identify reservoir boundaries. The record of surface oil flow rate and downhole pressure for the 130-hour test tells most of the story—follow the annotations in sequence. The surface oil flow rate data points are derived from measuring outflows from the surface separators. The data are stored in the COMPUTEST wellsite computer system. The lines represent averaged values for the duration of a flow period. The green pressure curve represents data stored in downhole memory throughout the test and then read out after retrieving the drillstring. In fact, four pressure gauges were used in this downhole memory mode: one strain gauge, two quartz gauges and one SPG Sapphire Pressure Gauge. The red curve represents pressure data obtained with the surface readout device hooked into the drillstem tool and read in real time at the surface. Over 75,000 17 The sampler is BOPD/psi pressure data points make up the curves in the plot. then pulled and a 0 5 second production 2035 Now go to 1 . logging profile is made Perfs. with the well flowing 16 A fluid sampler is run in on at a higher rate. 2040 Limest. 12 A long, 24-hour flow period wireline, through the fullbore Comparing pre- and Depth, m and a buildup lasting almost post-acid flow profiles, drillstem test tool to position two days then followed. This was the acid job can be 2045 opposite the producing formations. to confirm the effectiveness of the seen to have The well is allowed to flow acid job and to investigate successfully stimulated gently to preserve bottomhole Sandstone reservoir volume and boundaries. the limestone. 2050 pressure above bubblepoint while sampling takes place. 2055 14 Toward the end of the buildup, the surface readout device is pulled out of the hole. 70 80 90 100 110 120 130 101 15 The second buildup was interpreted using data measured in downhole ∆p and Derivative, psi/BOPD 103 memory mode and thus covering the buildup to its very end. The data were ∆p and Derivative, psi analyzed off-site, after the drillstring 100 Pre-acid buildup was pulled. 102 This match (lines) is based on a no-flow boundary and a constant- Normalized pressure boundary (possibly the 10-1 water table). Another good match 101 Post-acid buildup to the data was obtained by assuming a composite radial model. Only the reservoir engineer in cooperation with geologist and 100 10-2 geophysicist can decide which is 10-3 10-2 10-1 100 101 102 10-3 10-2 10-1 100 101 102 more appropriate. Elapsed time, hr Elapsed time, hr In five days, with only one pipe trip into the hole, this properly designed and executed well test has brought the exploration well to maximum potential, determined formation permeability, provided representative samples for PVT analysis, investigated far-reservoir boundaries, and set in place a completion strategy for development wells of the field. 33
  • 7. nReduction of Impermeable Boundary wellbore storage with downhole Well shut-in. The log-log Downhole shut-in plot compares two 100 well tests, one shut in at the surface, the other shut in ∆p and Derivative, psi downhole. In the surface shut-in test, 10-1 wellbore storage Surface shut-in Partially Sealing Fault masks the radial- flow plateau for Well over 100 hours (4 days) (square data points). The 10-2 plateau emerges clearly in the down- hole shut-in data after just one hour (triangular data 10-3 points). Intersecting Impermeable Boundaries 10-2 10-1 100 101 102 (From Joseph et al, Time, hr reference 6.) Well on the derivative response. The signs are the special case in which the test is long varied (next page ). A partially penetrated enough to reach all the no-flow boundaries, formation produces a linear trend on the thus forming a closed system. Examples of derivative curve with a slope of –1/2. In wells no-flow boundaries include sealing where the formation is strongly layered or faults—perhaps several of them—pinchouts, Parallel Impermeable Boundaries naturally fractured, the derivative tends to and channels. Because no-flow boundaries dip before it rises to the radial-flow plateau. reflect the transient back toward the well, If wellbore storage is not too dominating, the they cause ∆p to rise at higher than its nor- transient can be analyzed to pinpoint the mal radial-flow rate, so the derivative curve Well most likely explanation. jumps to a higher level. A sealing fault The last regime on the log-log plot occurs causes the plateau value to double. With when the pressure transient has travelled far two intersecting sealing faults, the jump is from the well and encounters the reservoir correspondingly higher. If a fault is partially Truncated Channel or drainage-area limits. Testing theorists sealing, the derivative curve starts to jump have worked out the transient response to a but then falls back to its radial-flow value. catalog of boundary geometries ( right ). In Constant-pressure boundaries, like a gas most cases, the transient responses alone do cap or aquifer, allow the pressure transient Well not offer enough differentiation to enable to flatten out at the boundary pressure, so the interpreter to definitively establish the the derivative takes a nosedive, which is boundary type. The choice of the type as instantly recognizable. In a closed system, well as the orientation of the boundary pressure is completely contained within the geometry must be guided by geologic, seis- reservoir. How this affects the ∆ p and Pinchout mic and log data. derivative curves depends on whether the Well There are three categories: no-flow transient is a drawdown or buildup. In boundary, constant pressure boundary and drawdown, both curves track a line of unit slope, again an easily recognizable effect. In buildup, the derivative curve starts moving toward the line of unit slope but takes a nosedive before reaching it, somewhat simi- lar to the constant-pressure boundary case. nA representative selection of no-flow These reservoir models are simpler than boundaries studied by well-test theorists. nature generally allows—in reality, a mix- Any of these may appear in the late-time ture of responses should be expected. portion of a transient’s diagnostic log-log Thanks to the superposition principle, how- plot. The associated parameters defining the boundary may then be estimated by ever, responses may be combined to pro- regression analysis. duce a realistic transient response for even the most complex situation. Simulating data, though, is the easier forward task. More dif- 34 Oilfield Review
  • 8. Log-log Horner Specialized Flow Regimes Wellbore ∆p, Derivative storage Radial ∆p ∆p flow Other Time Horner time Function of time Homogeneous Reservoir Wellbore storage coefficient ∆t Partially Penetrating Well Infinite Conductivity Vertical Fracture (Fracture half-length)2 × matrix permeability ∆t Finite Conductivity Vertical Fracture Fracture permeability × fracture width 4 Sealing Fault ∆t nResponse of log-log plot (left column) to several common reservoir systems, show- Constant Pressure ing different flow regimes (see legend). Boundary The log-log plot is used by analysts to diagnose the flow regimes present in the transient. Once regimes are identified, the Horner plot (semi-logarithmic) and other specialized plots (linear) are used to eval- uate parameters characterizing the system. Linear Channel Matrix permeability × (channel width)2 ∆t Dual-Porosity 35
  • 9. ficult for the analyst is the inverse procedure Using a workstation, the reservoir engi- established in the second buildup to predict of finding the best model to match actual neer interacts with a computer program, pressure response throughout all four peri- test data (below ).6 such as STAR Schlumberger Transient Anal- ods of the test and confirms that the model For the traditional test comprising two ysis and Report and ZODIAC Zoned satisfactorily accounts for all data. This may flow periods and two buildups, transient Dynamic Interpretation Analysis and Com- result in more parameter adjustment analysis focuses on the second buildup. The putation programs,7 to build a comprehen- because every period must now be matched first step is to identify the various regimes on sive model using all the parameters found simultaneously, even though the second the log-log ∆p and derivative-curve plots for the various flow regimes, predict what flow period is planned intentionally long to and then choose the most likely model for the entire transient should look like, and minimize the influence of previous periods. each. Estimation of model parameters is compare the results with the data. In this In some cases, interference from earlier then made using specialized plots that allow forward modeling process, the interpreter well manipulations may obscure key a focused analysis of each flow regime (pre- tweaks parameters, either manually or auto- regimes of the transient being analyzed. vious page ). For example, wellbore storage matically using a nonlinear regression Interpreters then resort to a process called in the early data is determined from the scheme, and perhaps alters the choice of desuperposition that attempts to isolate the slope of the straight-line portion of a linear model for one of the regimes to obtain the transient from earlier ones and in particular ∆p versus ∆t plot. Confirmation and charac- best possible fit. There may be several com- reform the given transient’s data to mimic terization of a vertical, high-conductivity binations of models that match the data how the reservoir would have reacted if the fracture, recognized by a half-slope deriva- equally well. In this case, other data must flow rate change had been an isolated, per- tive trend on the log-log plot, come from a be sought to decide which model is the fect step.8 plot of ∆ p versus ∆ t . The radial-flow most appropriate (next page ). Designing well tests involves many of the plateau is best analyzed using the general- The final interpretation step, called history same steps the interpreter uses. This is ized Horner plot. And so on. matching or verification, uses the model because once a test has been proposed, both the pressure data and the data’s inter- pretation can be simulated to show that the Raw data test as designed meets its goals—design sim- ulation requires estimates of formation and fluid parameters from nearby wells or the well in question. By predicting the likely shape of the log-log ∆ p and derivative Preprocessing curves, the engineer can demonstrate the feasibility of detecting and characterizing the anticipated reservoir features. For exam- ple, design simulation ensures that wellbore Openhole logs storage does not smother the feature being PVT data Model diagnosis sought and guarantees a test that is long Production logs enough to view suspected reservoir bound- aries. Another important feature of simula- tion is determining the accuracy and preci- sion required of the pressure gauges. Specialized plots The design phase not only maps out the mechanics of a test, but also ensures that, once underway objectives are met. For example, the progress of the planned tran- sient can be followed at the wellsite and Parameter estimation compared with that forecast during the design. To avoid the costly mistake of rig- ging down before the transient indicates a desired feature, wellsite validation of data during the test remains a must. This is best History matching accomplished with surface readout of downhole gauges and enough computing power at the surface to produce appropriate plots, notably the log-log diagnostic plot. If the reservoir response is quite different from Results that assumed in the design, wellsite diagno- sis permits an instant correction of the job, perhaps a lengthening of the transient, to nThe order of business in pressure transient analysis. 36 Oilfield Review
  • 10. Sealing Fault ensure optimum use for the data. In certain 101 cases, real-time readout is not feasible and downhole recording must be used. Data validation can still be performed onsite right ∆p and Derivative after retrieving the gauges. Integral to well test design is selection of 100 hardware, which involves many options. To minimize wellbore storage, should the well be shut in downhole rather than at surface? In a low producer, will the act of shutting in actually kill the well? How sensitive must the pressure gauges be? To some extent, these 10-1 questions are decided by the operator’s stan- Two Intersecting Perpendicular Faults 101 dard practices, the current status of the hole, the configuration of the downhole hardware and, not least, safety considerations. The options have expanded in recent ∆p and Derivative years. While drillstem test (DST) equipment has always guaranteed downhole shut-in in 100 new wells, downhole shut-in devices for completed wells did not become commer- cial until the early 1980s. Pressure gauges have evolved from crude mechanical devices to quickly reacting, highly accurate 10-1 quartz gauges. Perhaps the most unexpected Dual-porosity Model innovation is a downhole flow measurement. 101 Traditional well testing theory dispensed with a flow measurement because it assumed constant wellbore storage, ∆p and Derivative enabling flow to be estimated from early pressure data. But reality is less predictable. 100 Wellbore storage often varies as the fluids in the wellbore change during the test, and a downhole flow measurement in fact offers a valuable complement to conventional pres- sure data. Downhole flow measurements are cur- 10-1 rently performed using production logging Dual-permeability Model 101 6. Joseph J, Ehlig-Economides CA and Kuchuk F: “The Role of Downhole Flow and Pressure Measurements in Reservoir Testing,” paper SPE 18379, presented at the SPE European Petroleum Conference, London, ∆p and Derivative England, October 16-19, 1988. Ehlig-Economides CA, Joseph JA, Ambrose RW Jr and Norwood C: “A Modern Approach to Reservoir Test- 100 ing,” Journal of Petroleum Technology 42 (December 1990): 1554-1563. 7. The newer ZODIAC program includes all the features of the older STAR program. 8. Ehlig-Economides CA, Ambrose RW and Joseph JA: “Pressure Desuperposition Technique for Improved Late-Time Transient Diagnosis,” paper SPE 20550, 10-1 presented at the 65th SPE Annual Technical Confer- 10-1 100 101 102 103 ence and Exhibition, New Orleans, Louisiana, USA, Time September 23-26, 1990. nFinding the best model to fit the data. In this case, four scenar- ios fit quite well, but the dual-permeability model fits best. Dual permeability means a two-layered formation with a different permeability in each layer. April 1992 37
  • 11. tools and therefore not deployable when downhole shut-in is planned. The most ∆p and Derivative common uses are to measure transients caused by either shutting in or altering the flow rate at the surface—the tool, entered into the well through a conventional riser and lubricator, is suspended just above the producing zone. A drawback of the current technology is the threshold and resolution of the spinner in the logging tool that mea- Time Model sures flow. Well testing experts dream about a robust flow measurement incorporated T into the DST tool, enabling continuous flow P(t) = 0 q(τ) p(t-τ) dτ measurements in newly drilled wells. If flow measurements are at hand, how does that change testing analysis? The nec- essary theoretical ground was broken in the Pressure 1980s. The underlying principle is, once again, superposition.9 Suppose the pressure response to a unit step change in flow is p(t – t 0 ), where t 0 is when the step change occurs. Then the pressure response, P(t ), to a gradual change in downhole flow rate, Flow rate q (t ), may be computed by approximating the gradual change with a series of stair steps, then considering each step as provid- Time ing a minitransient, and finally through the superposition principle summing all the nThe convolution integral that converts pressure response to a unit step change in flow, minitransients (left ). As the steps are made p(t), and actual measured flow rate, q(t), into measured pressure response, P(t). Convo- lution revolutionizes transient analysis when downhole flow measurements are avail- smaller, this sum becomes the convolution able, for example as measured by production logging in a flowing test. The mathemat- integral: ical manipulation virtually wipes out wellbore storage, leaving later portions of the T transient clearly visible. P ( t ) = q (τ) p (t– τ ) d τ . nAn example 0 showing wellbore 103 storage virtually During a test, downhole pressure gauges eliminated using measure P (t ) and a flowmeter measures q(t ). Convolution derivative Pressure change the convolution But p(t ) is what the interpreter wants. Get- derivative. The ∆p and Derivative, psi transient was intro- ting at it requires the reverse process of 102 Pressure derivative duced by chang- deconvolution, which unfortunately is a ing the well’s pro- rather unstable numerical procedure. More duction rate and commonly, interpreters favor a procedure 101 downhole flow was measured using called logarithmic convolution that converts production logging. the two measurements more easily into something that fits existing analytical tech- 100 niques (left ). Logarithmic convolution is a mathemati- cal trick in which a form for p ( t ) is assumed—usually the response for infinite- 10-1 acting radial flow—that simplifies the above 10-5 10-4 10-3 10-2 10-1 100 101 convolution integral to a simpler expression Time, hr involving a rate-normalized pressure P(t )/q (t ), written J (t ), and a new time-scale called sandface rate convolution time, tsfrc . J (t ) and its derivative with respect to tsfrc offer the same diagnostic power as the con- ventional well testing analysis described earlier with the advantage that most of the wellbore storage is removed. 38 Oilfield Review
  • 12. There are several advantages to testing a A B C well with downhole pressure and flow mea- Surface flow rate surements under drawdown—and one dis- advantage. The disadvantage is that reservoir shut-in pressure is not measured. The advan- tages are: •in producing wells, little production is lost A since the well is never shut-in. •in poor producers, production is not killed as may occur during a shut in. •in layered reservoirs, testing under draw- down reduces the possibility of crossflow Downhole between producing layers, while this can C easily occur in a buildup test complicating the interpretation. Pressure The technique’s most popular application in layered reservoirs, though, is in analyzing individual layer kh and skin values.10 This involves measuring a series of tran- B Flow sients created by changing the production rate, one for each layer with the production logging tool situated at the top of the layer (right ). The amount of data acquired is huge and can be analyzed in several ways with A B C varying degrees of sophistication. The key, Time however, is to first analyze the transient nSequence of downhole pressure and flow transients measured using a production log- measured with the tool situated just above ging tool in a layered reservoir test. A separate transient is measured with the tool posi- the bottom layer, yielding that layer’s reser- tioned at the top of each zone. Analyzing the transients yields individual zone perme- voir properties. Then, a second transient is ability and skin values. measured with the tool situated above the next layer, revealing reservoir properties of innovation provides a solution. Samples of 9. Meunier D, Wittmann MJ and Stewart G: “Interpreta- the new layer and bottom layer combined. extraordinary reliability may now be tion of Pressure Buildup Test Using In-Situ Measure- Since reservoir properties for the bottom obtained from any number of zones using ment of Afterflow,” Journal of Petroleum Technology 37 (January 1985): 143-152. layer are already estimated, the transient the new wireline-conveyed MDT Modular 10. Kucuk F, Karakas M and Ayestaran L: “Well Test can be analyzed to reveal just the new Formation Dynamics Tester, but this has to Analysis of Commingled Zones Without Crossflow,” layer’s properties. The process continues up be planned in advance because the sam- paper SPE 13081, presented at the 59th SPE Annual Technical Conference and Exhibition, Houston the well. pling takes place in open hole (see “The Texas, USA, September 16-19, 1984. Layered reservoir testing (LRT) was origi- MDT tool: A Wireline Testing Break- Ayestaran L, Ehlig-Economides C, Shah P, Kuchuk F, nally conceived to investigate production through,” page 58). Nicolson B and Wittmann M: “Layered Reservoir Testing,” The Technical Review 35, no. 4 (October wells. Recently in offshore Congo, AGIP In addition to convolution and layered 1987): 4-11. used the technique to evaluate a layered reservoir testing, there are other advantages reservoir encountered by an exploration to supplementing conventional pressure well. Conventional testing of individual pay data with production logging measure- zones in an exploration well would nor- ments. A flow profile run during stabilized mally call for a separate DST-perforation run production or shut-in can pinpoint where for each zone. But using layered reservoir production is coming from and provide testing, AGIP obtained reliable kh, skin and invaluable data on crossflow between productivity index values for individual zones. The information may directly influ- zones with only one trip in the hole, at a ence testing interpretation. For example, if a considerable cost savings (see “Exploration zone is producing only from its upper part, Layered Reservoir Testing in the Congo,“ a portion of the transient will react as if the next page). well were only partially completed. The The drawback of using an LRT in the diagnosis must be adjusted accordingly. The exploration setting is that production from fluid density measurement in production different zones commingles, ruling out rep- logging also plays a role by indicating resentative sampling from different pay whether gas is coming out of solution, giv- zones. Fortunately, a recent technological ing a warning that a test may be occurring at below bubblepoint conditions. Perhaps the most valuable contribution of downhole flow measurements is in testing (continued on page 45) April 1992 39
  • 13. Exploration Layered Reservoir Testing in the Congo Luigi Piero Augustine Alagoa AGIP Congo Pointe-Noire, Congo Pointe-Noire, Congo AGIP’s innovative use of layered reservoir testing RFT Pressure Lower layer (LRT) in an exploration well occurred offshore Upper layer Pressure potential, bar Congo. The goal of the test was to evaluate two Composite 308 producing layers only a few meters apart with only one trip into the hole, a much less costly 300 undertaking than the usual two trips. The LRT technique was originally developed for testing 292 production wells, in which several layers produce commingled—in this case, LRT is a must to eval- uate each layer’s dynamic properties. Here, AGIP 0 10 20 30 40 extended the method to the exploration environ- Bottomhole flow rate, m3/hr ment, where openhole data suggest several pay nSelective inflow performance plot for the two reservoir layers, showing the lower zones quite close to each other. nReservoir geometry near the two layers The discovered field is an elongated structure layer to be easily the more productive and the reservoir pressure corrected to a investigated by a layered reservoir test in depth datum of 2735 m to be the same in AGIP’s Congo exploration well. bounded by two faults forming a V shape (left). both layers—315 bars. The well penetrates several reservoirs. Five tests were performed in the well, two using the LRT in. tubing-conveyed perforating (TCP) guns to technique. Each LRT test looked at two distinct enhance cleanup and control perforation damage. layers. This example presents results from the The test began with a flow period to clean up shallower pair. the well, then a shut-in during which a production The bottom layer is a 17-m [56-ft] thick sand- logging profile was recorded. The well was then stone/limestone mix of 26% porosity, while the opened on a 3/8-in. choke, and transient pressure top layer is a 7-m [23-ft] thick limestone of 20% and flow measurements were recorded with the porosity. The layers are separated by about 4 m production logging tool positioned above the top [13 ft] of silts. The well was completed with 7-in. zone (above). After flow stabilized, a second pro- casing and perforated underbalanced with 4 1/2- duction logging profile showed that 95% of pro- duction came from 10 m [33 ft] of the bottom layer and just 5% from the top layer. The tool was then moved to the top of the bottom zone and a new transient measured after the choke was increased to 1/2 in. The choke was finally increased to 3/4 in. and a final transient mea- sured with the tool back above the top zone. First, the flow profiles were analyzed to obtain the inflow performance of and reservoir pressure in each layer. Plots of pressure normalized to a 40 Oilfield Review