The use of web analytics for digital-marketing-pe 2015 industrial-marketing-
•
1 like•255 views

article

Recommended
Recommended
More Related Content
What's hot
What's hot (20)
Similar to The use of web analytics for digital-marketing-pe 2015 industrial-marketing-
Similar to The use of web analytics for digital-marketing-pe 2015 industrial-marketing- (20)
More from adnan haidar
Recently uploaded
Recently uploaded (20)
The use of web analytics for digital-marketing-pe 2015 industrial-marketing-
- 1. The use of Web analytics for digital marketing performance measurement☆ Joel Järvinen ⁎, Heikki Karjaluoto 1 School of Business and Economics, University of Jyväskylä, PO Box 35, FIN-40014, University of Jyväskylä, Finland a b s t r a c ta r t i c l e i n f o Article history: Received 16 November 2013 Received in revised form 13 November 2014 Accepted 14 November 2014 Available online 21 April 2015 Keywords: Case study Digital marketing Industrial business Performance measurement Web analytics This study proposes that the benefits gained from marketing performance measurement are determined by how an organization exploits the metrics system under specific circumstances. For this purpose, the authors review performance measurement literature and apply it to the use of Web analytics, which offers companies a metrics system to measure digital marketing performance. By performing an in-depth investigation of the use of Web an- alytics in industrial companies, the study shows that an organization's efforts to use marketing metrics systems and the resulting outcomes cannot be understood without considering the reasoning behind the chosen metrics, the processing of metrics data, and the organizational context surrounding the use of the system. Given the con- tinuously growing importance of digital marketing in the industrial sector, this study illustrates how industrial companies characterized by complex selling processes can harness Web analytics to demonstrate how digital marketing activities benefit their businesses. © 2015 Elsevier Inc. All rights reserved. 1. Introduction The role of digital marketing2 (DM) in a firm's marketing strategy has been expanding in the industrial sector, as evidenced by industrial firms' increasing investments in DM activities, which currently account for approximately one-quarter (26%) of industrial firms' total marketing budgets (Gartner, 2013). In addition to cost effectiveness and changes in customer behavior, investments in DM are motivated by its results being more easily measured compared with those of traditional market- ing (Hennig-Thurau et al., 2010; Pickton, 2005; Wilson, 2010). As cus- tomers are increasingly interacting with companies through digital channels, marketers have realized the need to track these interactions and to measure their performance (Chaffey & Patron, 2012). For this purpose, firms must adopt Web analytics (WA), defined as “the measurement, collection, analysis and reporting of Internet data for the purposes of understanding and optimizing Web usage” (Web Analytics Association, 2008, p. 3). In this study, WA refers to a tool that collects clickstream data regarding the source of website traffic (e.g., e-mail, search engines, display ads, social links), navigation paths, and the behavior of visitors during their website visits and that presents the data in a meaningful format. The WA data are used to understand online customer behavior, to measure online customers' responses to DM stimuli, and to optimize DM elements and actions that foster customer behavior that benefits the business (Nakatani & Chuang, 2011). Although it is limited to the digital environment, the use of WA is an important developmental step toward measurable marketing. As the role of the digital world expands through increased digital media con- sumption and the integration of the online and offline worlds, the pro- portion of marketing actions covered by WA is growing. Many offline marketing actions already include digital elements that can be tracked by WA. Examples include quick response (QR) codes embedded in print and outdoor media and augmented reality applications used in, e.g., product demonstrations at trade shows. Additionally, firms can de- sign offline campaigns to drive traffic to digital channels and to measure their impact on website customer behavior. However, firms' ability to harness WA to improve marketing performance remains limited. In a recent survey of 1000 U.S. marketers, three of four marketers believed that measuring DM performance was important, but less than one- third (29%) thought they were doing it well (Adobe, 2013). WA is used by more than 60% of the top 10 million most popular websites around the globe (Web Technology Surveys, 2014). In addition to the value of the data that WA produces, the high adoption rate is driven by the fact that some WA tools, such as Google Analytics, can be acquired and utilized free of charge. Despite the high adoption rate, academic research on WA remains limited, and much of the research re- sults reveal a discouraging picture of its use. On average, WA is utilized on an ad-hoc basis, the metrics data are not used for strategic purposes, and the benefits of the usage remain unclear (Hong, 2007; Järvinen, Töllinen, Karjaluoto, & Jayawardhena, 2012; Welling & White, 2006). Industrial Marketing Management 50 (2015) 117–127 ☆ Submission declaration: This full-length manuscript is not under consideration for publication elsewhere, and its publication is approved by all of its authors. ⁎ Corresponding author. Tel.: +358 40 805 3542; fax: +358 14 260 2021. E-mail addresses: joel.jarvinen@jyu.fi (J. Järvinen), heikki.karjaluoto@jyu.fi (H. Karjaluoto). 1 Tel.: +358 40 576 7814; fax: +358 14 260 2021. 2 Digital marketing refers to marketing that uses electronic devices and channels to sup- port marketing objectives. In this study, digital marketing includes marketing via websites, search engines, online advertisements, e-mail and social media channels. Digital market- ing is considered to be a synonym for electronic marketing. http://dx.doi.org/10.1016/j.indmarman.2015.04.009 0019-8501/© 2015 Elsevier Inc. All rights reserved. Contents lists available at ScienceDirect Industrial Marketing Management
- 2. In contrast, a few case studies demonstrate that measuring and optimiz- ing DM performance measurement with WA have improved the effi- ciency of marketing actions and subsequently increased sales revenue (Phippen, Sheppard, & Furnell, 2004; Wilson, 2010). Hence, the evi- dence regarding the benefits of exploiting WA for DM performance measurement is contradictory. In addition, whether performance measurement and the use of mea- surement data in decision making result in improved firm performance or other business benefits is generally disputed in the literature. For in- stance, Franco and Bourne (2004) analyzed 99 published papers regard- ing performance measurement and concluded that more rigorous research methods were associated with a lower likelihood of perfor- mance measurement having a positive impact on firm performance. By contrast, various marketing studies have shown that the use of mar- keting performance measurement data in marketing decisions has pos- itive performance implications (e.g., Kannan, Pope, & Jain, 2009; Lodish, Curtis, Ness, & Simpson, 1988; Mintz & Currim, 2013; Natter, Mild, Wagner, & Taudes, 2008; Silva-Risso, Bucklin, & Morrison, 1999; Zoltners & Sinha, 2005). However, in practice, many marketing man- agers remain skeptical toward the use of performance measurement data and instead rely on intuition and experience in decision making (Germann, Lilien, & Rangaswamy, 2013; Lilien, 2011). This perspective is also supported by scientific evidence. Heuristics studies demonstrate that less information may in fact result in more accurate and efficient decision making than extensive analysis of past data because heuristic rules can be used to manage uncertainty more efficiently and robustly than rules based on a broader use of information (Gigerenzer & Brighton, 2009; Guercini, 2012; Guercini, La Rocca, Runfola, & Snehota, 2014). Given this contradictory evidence, this study proposes that per- formance measurement or the use of WA for DM performance measure- ment does not inherently improve performance. Rather, the benefits gained are determined by how companies exploit the system under specific contextual circumstances. Against this backdrop, this study has three aims. First, it advances marketing performance measurement theory by elucidating how orga- nizations can design and apply marketing metrics systems in a way that creates business benefits. Second, although previous findings demon- strate that WA is more beneficial in businesses in which transactions are processed online (Järvinen, Töllinen, Karjaluoto, & Platzer, 2012), this study demonstrates how industrial companies characterized by a long-duration selling process and an emphasis on face-to-face interac- tion with customers (Webster, Malter, & Ganesan, 2005) can use WA for DM performance measurement. Third, at a time when new analytics tools and technologies are providing marketers with a rapidly increas- ing volume of digital data regarding online customer behavior (Deighton & Kornfeld, 2009; McAfee & Brynjolfsson, 2012; Russell, 2010), this study examines the limitations of relying on such data and emphasizes the future challenge of achieving a holistic understanding of customers and marketing performance. To reach our research objectives, we perform an in-depth investiga- tion of a company that has experienced remarkable benefits from the use of WA and compare the company's WA use with that of two other companies that have not gained notable benefits despite their active use of WA. The differences in the use of WA are examined in three di- mensions: the selection of WA metrics, the processing of WA data, and the organizational context of WA use (adapted from Pettigrew, Whipp, & Rosenfield, 1989). A similar approach has been used in the perfor- mance measurement literature (Bourne, Kennerley, & Franco-Santos, 2005; Bourne, Neely, Platts, & Mills, 2002; Bourne et al., 1999; Martinez, Pavlov, & Bourne, 2010). However, this study extends Pettigrew et al.'s (1989) model by demonstrating how it can be applied in marketing per- formance measurement research. The remainder of the article is organized as follows: We begin by explaining how the dimensions of Pettigrew et al.'s (1989) model are adapted for the purposes of this study. Thereafter, we review and divide the existing findings regarding performance measurement under the adapted dimensions and discuss how the findings are related to evidence derived from the WA research. In the methodology section, we justify the rationale for using a case study approach and describe the data collection and analysis methods that are used in this study. Subsequently, we present the cross-case findings. Finally, we discuss the theoretical contributions and managerial implications of the study, its limitations, and avenues for future research. 2. Framework for investigating the use of performance metrics systems Research on DM performance measurement with WA is scarce and theoretically underdeveloped. Therefore, we consider a broader per- spective for the literature review and combine findings from perfor- mance measurement and marketing performance measurement literature. We show that the existing findings regarding the use of per- formance measurement systems are often parallel to available anecdot- al evidence regarding the use of WA for DM performance measurement. The literature review is structured according to the three dimensions of Pettigrew et al.'s (1989) framework, which was originally designed to investigate strategic change in organizations. The key idea of the frame- work is that the content of change, the process of implementing change and the organizational context in which the change occurs are interre- lated. Thus, strategic change can only be understood by investigating all three dimensions. Specifically, content (i.e., the what of change) refers to the particular areas of transformation under examination. Process (i.e., the how of change) refers to the frameworks, patterns, actors, and tools that transition the organization from its present to a fu- ture state. Context (i.e., the why of change) refers to the organization's internal context (i.e., antecedent conditions, resources, capabilities, structure, leadership, dominating frames of thought, culture, and poli- tics) and the external environment (i.e., the economic, business, and po- litical environment and social and economic trends) in which change occurs. Pettigrew et al.'s (1989) framework was selected as a guide for this study because it provides a sound structure for organizing disparate findings from the performance measurement literature to develop a ho- listic understanding of the elements that affect the firm's ability to de- sign and exploit a marketing metrics system. The framework has been adopted in a number of studies on the use of performance measurement systems, all of which have concluded that the content, process, and con- text of performance measurement affect the outcome of the system (Bourne et al., 1999, 2002, 2005; Martinez et al., 2010). In these studies, the dimensions have been adapted to better harmonize with perfor- mance measurement research and the precise research questions. Therefore, the following definitions are formulated by combining and summarizing the core idea of each of Pettigrew et al.'s dimensions in previous performance measurement studies (e.g., Bourne et al., 2005; Martinez et al., 2010): Performance measurement content refers to the actual metrics system that is developed, including what is being measured, what metrics are selected, and how they are structured as a complete metrics system. Performance measurement process refers to the process through which the performance data are refined and managed. Performance measurement context refers to the internal and external organizational contexts in which the use of a metrics system occurs. For the purposes of this study, we use these definitions and extend their use to address marketing metrics and WA metrics systems. However, regarding the performance measurement context, this study exclusively focuses on the internal context, and therefore, the external context is outside the scope of this research. 118 J. Järvinen, H. Karjaluoto / Industrial Marketing Management 50 (2015) 117–127
- 3. 2.1. Performance measurement content The exact design of an effective metrics system is likely to depend on the particular organization in question. Thus, there are no clear stan- dards for building a metrics system that would fit the needs of all orga- nizations. However, research indicates that to develop a successful metrics system, organizations should focus on aligning metrics and strategy, as well as the definitions, dimensions, and structure of the metrics (Table 1). The WA literature has focused on the extent of WA metrics use by organizations and the types of metrics that organizations have adopted (Hong, 2007; Phippen et al., 2004; Welling & White, 2006). As indicated in the performance measurement and marketing performance mea- surement literature, aligning WA metrics with a DM strategy and busi- ness objectives has been demonstrated to be a viable method to increase the benefits of WA use in certain cases (Phippen et al., 2004; Weischedel & Huizingh, 2006). However, little is known regarding the underlying reasons why organizations select certain WA metrics and ignore others. Marketing performance measurement suffers from an emphasis on subjective measures, such as brand loyalty and customer satisfaction, which are difficult to link to financial metrics that mainly concern top management (Rust et al., 2004; Stewart, 2009). Seggie et al. (2007) argue that in addition to dissatisfaction toward subjective marketing measures, the power of the Internet will diminish the importance of subjective measures and increase the importance of objective measures. Indeed, one of the advantages of WA is that it offers a variety of objec- tive, standardized, and quantitative metrics that are relatively easy to communicate to senior management. However, the plethora of metrics complicates WA usage because it is difficult to decide which metrics are the most critical to implement (Phippen et al., 2004; Weischedel & Huizingh, 2006; Welling & White, 2006). Firms should begin WA met- rics selection by identifying the key performance indicators3 (KPIs) and differentiating them from other granular metrics (Chaffey & Patron, 2012). However, little is known regarding how companies re- solve the challenge of compiling a comprehensive yet manageable set of WA metrics. Moreover, whether quantitative WA metrics can substi- tute for subjective marketing measures, which are qualitative in nature, remains unclear. 2.2. Performance measurement process Various studies have investigated how performance measurement systems are implemented and how data are processed at the operation- al level. As a result, the following key phases of the performance mea- surement process have been identified: data gathering, data analysis and interpretation, result reporting, taking action, and updating the metrics system (e.g., Bourne, Mills, Wilcox, Neely, & Platts, 2000; Bourne et al., 2005). Table 2 summarizes the research findings related to each of these phases. Gathering reliable data for metrics systems is challenging (Eccles, 1991; Lynch & Cross, 1991; Nemetz, 1990; Stewart, 2009). Thus, an ad- vantage of WA metrics is that the collection of WA data can be standard- ized and automated (Russell, 2010). For this reason, data gathering is not expected to be a major obstacle to the use of WA data. Instead, in line with the performance measurement literature, WA data are useless without proper analysis and interpretation (Chaffey & Patron, 2012; Court, Gordon, & Perrey, 2012; Phippen et al., 2004). Clearly, the analy- sis and interpretation phase is a prerequisite for gaining insight and improving current DM practices. Therefore, this phase is presumed to have a major influence on the benefits gained from WA. Reporting the measured marketing performance outcomes to exec- utives leads to favorable managerial attitudes and behavior toward marketers (Curren et al., 1992; Pauwels et al., 2009). Presumably, reporting DM performance to executives similarly results in positive outcomes. However, how reporting should be organized and how de- tailed the information that management is willing to receive from DM results remain unclear. In addition, as coordination and clear responsi- bilities are commonly key factors in successful performance measure- ment processes (Eccles, 1991; Simons, 1991), one key consideration concerns how responsibilities should be shared and coordination per- formed regarding WA data. 2.3. Performance measurement context Research on the internal performance measurement context has identified various factors that influence the use of performance mea- surement systems. These factors include analytics skills and resources, information technology infrastructure, senior management commit- ment, leadership, and organizational culture (Table 3). The literature has emphasized the importance of expertise and ana- lytics skills in selecting suitable WA metrics and analyzing WA data for gaining meaningful insight (Chaffey & Patron, 2012; Court et al., 2012), which is also commonly mentioned in marketing performance mea- surement studies (Germann et al., 2013; Lenskold, 2002; O'Sullivan & Abela, 2007; Patterson, 2007). In addition to expertise and analytics skills, the role of management in the use of WA has been discussed, as senior management can be held responsible for investing in recruit- ment, training, and suitable information technology infrastructure (Chaffey & Patron, 2012). Furthermore, the use of analytics is more ef- fective when the organizational culture favors data-driven decision making, cooperation, and information sharing, which often requires ef- fective change management practices (Davenport, 2013; McAfee & Brynjolfsson, 2012). Regarding the information technology infrastruc- ture, anecdotal evidence suggests that one of the primary advantages of WA tools is that they can be synchronized with other enterprise soft- ware, such as customer relationship management (CRM) and social analytics software (Digital Marketing Depot, 2014). However, the inte- gration of WA tools with other information technology platforms has not yet been explored in the academic literature. 3. Methodology For this paper, the case study approach was selected as the research strategy. According to Yin (1981), the case study approach is favored when the study investigates a contemporary phenomenon in its real- life context and when the boundaries between phenomenon and con- text are not evident. In this study, WA is a contemporary phenomenon because the technology has gained wider attention only during the last decade and because the academic research on WA is still in its infan- cy. In addition, this study aims to elucidate the underlying reasons for firms' varying benefits from WA, which can only be achieved through in-depth investigation of selected organizations. The study was conducted as part of a two-year DM research project that was supported by seven large industrial firms and seven service providers, such as DM agencies. During preliminary discussions with the participating companies, we found that DM performance measure- ment emerged as a top-priority research theme and that multiple com- panies had already used WA for this purpose. Studying WA for DM performance measurement specifically in large industrial companies provided a fruitful research setting because the use of WA in industrial companies has not yet gained much interest in the academic literature. Furthermore, generally, marketing performance measurement is partic- ularly challenging in industrial settings, which are characterized by complex, long-lasting selling processes that render demonstrating the 3 In the DM context, KPIs are defined as metrics that indicate the firm's overall DM per- formance in relation to its most important DM goals. The KPIs are supplemented with oth- er more granular metrics that are used to evaluate the effectiveness and efficiency of specific DM activities that support the overall DM performance measured by the KPIs (Chaffey & Patron, 2012). 119J. Järvinen, H. Karjaluoto / Industrial Marketing Management 50 (2015) 117–127
- 4. impact of DM on business performance difficult (Webster et al., 2005). In contrast, large industrial companies are more active users of DM mea- surement than small and medium-sized firms (Järvinen, Töllinen, Karjaluoto, & Jayawardhena, 2012), which implies that larger compa- nies are more likely to have the resources and knowledge required for the successful use of WA. Therefore, by investigating large industrial companies, we expected not only to identify challenges in the use of WA but also to find insights and solutions for overcoming these challenges. Three of seven industrial companies that participated in the research project reported actively using WA for DM performance measurement, and all three were willing to participate in the study. These three com- panies were largely similar in terms of digital marketing activities and channels in use. That is, all of the companies used a company website, campaign websites, search engine marketing (which encompassed both organic and paid search), display advertising, e-mail newsletters and social media (primarily Twitter, LinkedIn, Facebook and YouTube) to achieve digital marketing goals. From this perspective, the opportuni- ties to use WA for DM performance measurement did not differ among the case companies. Two of the firms (which are identified in this re- search by the aliases Machinery and Paper) stated that they were not satisfied with their current use of WA and had gained only minor bene- fits thus far. In contrast, the third firm (i.e., Steel) reported that it was highly satisfied with its WA use and that it had experienced substantial improvements in DM performance by using WA. Against this back- ground, we created a comparative study design in which we compared the differences in the use of WA among the companies to discover the reasons for the varying benefits that were experienced. More specifically, our empirical study design follows the literature review and includes the performance measurement content, process, and con- text dimensions of WA use. Regarding the context dimension, we limit- ed our study focus to the internal context and concentrated on internal organizational factors related to WA use. Excluding the external context was justified because the case companies were in many ways similar from the external context perspective, sharing the same political, cultural, and social background and operating largely in the same market areas. The details of the three case companies are presented in Table 4. The primary data collection method was interviews. The target group for the interviews was digital marketers who were or had been involved with DM performance measurement and the use of WA. The management in each company performed the actual selection of the key respondents based on the candidate respondent's role in DM perfor- mance measurement tasks. Ultimately, we conducted four to five inter- views in each case company (14 in total). After these interviews, the data were determined to be saturated and representative given that fewer than 20 employees in each company were involved with DM per- formance measurement. The average length of the interviews was 55 min, and all the interviews were audio recorded with the permission of the interviewees. The interviews did not include rigidly formulated questions but were open-ended in nature and only guided by six themes: (1) DM strategy and objectives, (2) DM activities and channels, (3) DM performance measurement tools and practices and the role of WA use, (4) WA metrics selection, (5) WA data processing and reporting, and (6) opportunities and challenges in DM performance measurement and the use of WA. In addition to these guiding themes, Table 2 Research findings regarding the performance measurement process. Process phase Performance measurement Marketing performance measurement Data gathering A multitude of methods to capture performance data; the challenge is to obtain accurate, standard, and objective data (Eccles, 1991; Lynch & Cross, 1991; Nemetz, 1990). Marketers have difficulties in gathering reliable and objective data (Stewart, 2009). Data analysis and interpretation The value of performance data depends on how the information is analyzed and interpreted (Eccles, 1991; Hill, Koelling, & Kurstedt, 1993; Lynch & Cross, 1991; Neely & Bourne, 2000). A key challenge in processing marketing performance data is to refine it to actionable insights (McGovern et al., 2004; Pauwels et al., 2009). Results reporting Standardized and regular reporting leads to better performance (Bourne et al., 2005; Hacker & Brotherton, 1998). Reporting marketing performance to executives positively influences managerial satisfaction, attitudes, and behavior toward marketers (Curren, Folkes, & Steckel, 1992; Pauwels et al., 2009). Taking action Improving performance necessitates that performance data are utilized for taking corrective action toward existing practices (Forza & Salvador, 2000; Lebas, 1995; Lynch & Cross, 1991). Acting on the basis of marketing performance measurement data results in positive performance implications (Kannan et al., 2009; Lodish et al., 1988; Silva-Risso et al., 1999). Updating the metrics system Modifying and updating the metrics system is vital to reflect changes in strategic objectives and targets (Bourne et al., 2000; Johnston, Brignall, & Fitzgerald, 2002; Lingle & Schiemann, 1996; Neely et al., 2000; Wouters & Sportel, 2005). Non-existing Table 1 Research findings regarding performance measurement content. Content issue Performance measurement Marketing performance measurement The alignment of metrics and strategy Performance measurement should be based on firm strategies and business objectives (Bourne, Neely, Mills, & Platts, 2003; Eccles, 1991; Kaplan & Norton, 1996; McCunn, 1998; Neely & Bourne, 2000). The selection of metrics should be based on marketing strategy and objectives (Ambler, 2000; Ambler, Kokkinaki, & Puntoni, 2004; Clark, 2001; Lamberti & Noci, 2010; Morgan, Clark, & Gooner, 2002). Definitions of metrics Clearly defined performance metrics help firms avoid common misunderstandings (Bourne & Wilcox, 1998; Neely, Richards, Mills, Platts, & Bourne, 1997; Neely et al., 1996; Schneiderman, 1999). Determining the marketing contribution to business outcomes requires that the metrics that are used are clearly defined (Ambler, 2000; Lehmann, 2004; Webster et al., 2005). The dimensions of metrics Metrics systems should be multi-dimensional or “balanced”, including financial and non-financial, internal and external, leading and lagging metrics (Bourne et al., 2003; Eccles, 1991; Kaplan & Norton, 1992, 1996; Keegan, Eiler, & Jones, 1989; Lingle & Schiemann, 1996; Neely et al., 1996). To create a thorough understanding of marketing performance, the selected metrics should reflect short- and long-term as well as financial and non-financial results (Ambler & Roberts, 2008; Clark, 1999; O'Sullivan & Abela, 2007; Rust, Ambler, Carpenter, Kumar, & Srivastava, 2004; Seggie, Cavusgil, & Phelan, 2007). The structure of metrics Mangers must understand the interrelationships between metrics and condense the metrics in a manageable system by omitting metrics that are less critical or overlapping (Lipe & Salterio, 2000, 2002; Neely et al., 2000). Marketers need a comprehensive but manageable set of performance metrics, which requires that they understand the interrelationships between metrics and that they are able to focus on the critical ones (Clark, 1999; McGovern, Court, Quelch, & Crawford, 2004; O'Sullivan & Abela, 2007; Pauwels et al., 2009). 120 J. Järvinen, H. Karjaluoto / Industrial Marketing Management 50 (2015) 117–127
- 5. we kept the interviews as open-ended as possible and allowed the in- terviewees to freely raise any issues that they thought were relevant to the topic. To complement the data from interviews (and increase the validity of the study), two workshop sessions were organized to allow for infor- mal group discussions on the key respondents' opinions and experi- ences regarding the research topic. The participants in the workshops included the same individuals who participated in the interviews and representatives with an interest in the topic from other companies that participated in the DM research project. However, in the analysis of workshop sessions, we included only the comments made by the in- terviewees. The topics of the workshop sessions were open in nature but were designed based on the interviews, as we pursued issues that multiple interviewees' had considered particularly challenging or im- portant in the interviews. For example, many interviewees noted the difficulty of deciding what WA metrics to select and what metrics to ig- nore, so we tried to elaborate this issue by asking the participants to share their thoughts and rationale for making metrics selection deci- sions. The data gathering in the workshops was conducted such that one researcher participated by raising topics to discuss while two other researchers observed and took notes of comments and reactions by the participants of the case companies. Finally, e-mail exchanges were used in the data collection where an interview request was declined. The analysis of the case data followed a three-step thematization process comprising condensing the data, displaying the data, and drawing and verifying conclusions (Miles, Huberman, & Saldaña, 2013, pp. 12–14). First, the audio-recorded interviews were transcribed and combined with notes from the workshop discussions and e-mail ex- changes, after which the data were reviewed several times. Second, con- tent analysis was performed by descriptive coding to create relevant categories (such as metrics selection, data gathering, analytics skills) followed by second-cycle coding in which the descriptive codes were grouped according to the content, process, and context of WA usage (Miles et al., pp. 74, 86–93). After a carefully conducted process of cod- ing and recoding the data, we reviewed the cases individually and com- piled case descriptions based on this review process. Thereafter, a comparative analysis was conducted to examine the differences and similarities across the individual case findings. Finally, to verify the study results, our interpretations were presented in final meetings with each firm where key respondents were invited to comment on the study's findings and conclusions. Against this background, the re- sults obtained by the researchers were reliable in terms of managerial relevance. 4. Findings The case companies substantially differed in terms of their satisfac- tion toward and benefits gained from the use of WA. The participants from Machinery and Paper considered WA to make their DM more mea- surable but noted that the greatest benefit was being able to track how many people visit their website and how much traffic different Table 3 Research findings regarding the internal performance measurement context. Internal context factor Performance measurement Marketing performance measurement Analytics skills and resources Designing and implementing a performance measurement system requires sufficient skills and human resources (Kennerley & Neely, 2002). Analytics skills and knowledge of measurement techniques are necessary for the use of marketing performance data (Germann et al., 2013; Lenskold, 2002; O'Sullivan & Abela, 2007; Patterson, 2007). Information technology infrastructure Suitable information technology infrastructure improves the integration and accessibility of performance data (Bititci, Nudurupati, Turner, & Creighton, 2002; Bourne et al., 2002; Eccles, 1991; Lingle & Schiemann, 1996; Marchand & Raymond, 2008; Nudurupati & Bititci, 2005). Sophisticated information technology infrastructure supports the exploitation of marketing metrics data (Germann et al., 2013). Senior management commitment Management commitment encourages the implementation and active use of a performance measurement system (Bititci et al., 2002; Bourne et al., 2000, 2002; Nudurupati & Bititci, 2005). Support from top management in terms of attention, budget, and human resources is necessary for the successful deployment of marketing performance data (Germann et al., 2013; O'Sullivan & Abela, 2007; Patterson, 2007). Leadership Communicating benefits and reassuring and motivating people toward using a performance measurement system decreases the resistance toward the system (Hacker & Brotherton, 1998; Kaplan & Norton, 1996; Kennerley & Neely, 2002). Non-existing Organizational culture Creating a culture that embraces the use of performance data in managing a business is beneficial; performance data must be used to encourage learning and improvement rather than to punish and blame (Bourne et al., 2002; Kennerley & Neely, 2002; Neely & Bourne, 2000). An organizational culture that encourages the use of metrics data in marketing decision making contributes to its effective usage (Germann et al., 2013; Patterson, 2007). Table 4 Background information of case companies and interviewees. Company code name Machinery Paper Steel Ownership Public limited company Public limited company Public limited company Main industry Industrial goods Paper Steel Annual revenue USD 5+ billion USD 10+ billion USD 3+ billion Number of employees ca. 20.000 ca. 20.000 ca. 10.000 Headquarters Finland Finland Finland Market reach Global Global Primarily Europe Interviewees and their positions (names have been changed) David: team leader of digital communications Richard: expert in digital communications Charles: customer data expert in digital marketing Susan: communications expert in digital communications Betty: expert in digital communications Joseph: director of digital marketing Lisa: communications expert in branding Helen: communications manager of Web services Thomas: campaign manager of digital marketing Nancy: team leader of branding Sandra: team leader of Web services Donna: content and SEO manager of digital marketing Karen: manager of marketing concepts Carol: customer analyst of digital marketing 121J. Järvinen, H. Karjaluoto / Industrial Marketing Management 50 (2015) 117–127
- 6. marketing actions attract to the website. In comparison, Steel's partici- pants reported multiple major benefits from using WA: First, Steel's marketers are now able to measure financial outcomes of DM and dem- onstrate their contribution to top management. As a result, the digital marketers' influence in the company, as well as their budget, has in- creased. Second, the marketers are much more aware of the relative ef- fectiveness of various DM channels and actions to attract visitors to their website. Third, Steel's marketers have a better understanding of the type of content that attracts potential customers to interact with the company and which customer actions at the website indicate customer interest in the company's offerings. Overall, Steel's marketers can em- ploy this information for planning new DM actions and modifying existing actions to improve performance. Steel's DM performance had been improving month by month as measured by the website traffic, sales leads,4 revenue, and profits generated. Lately, digital marketing has been systematically invested in. You can clearly see direct monetary and human resource investments as well as the top management commitment to this thing. With the help of an- alytics, the management and sales teams have undoubtedly noticed that our digital services, website, and all our activities have a powerful impact, and the change has been radical in the last few years. The budget is still bigger for offline marketing, but the digital marketing budget has multiplied. Last year, I think we more or less tripled our budget. [(Joseph, director of digital marketing, Steel)] 4.1. Web analytics measurement content In the design of the content of a WA metrics system, two distinctive approaches were identified: Steel built its metrics system by consider- ing its top priority marketing goals and by including WA metrics that would indicate how their DM activities support the achievement of these goals. By contrast, Machinery and Paper primarily included the metrics that were easily available and that provided information that is considered to be meaningful for DM performance. Steel's study participants continuously emphasized that all of their efforts in digital channels are primarily aimed at increasing sales. Acknowledging the complex purchase process in the metal industry, the company has designed a WA metrics system that measures the pur- chase process at three levels: traffic generation to the website, user be- havior and interaction on the website, and revenue and profits gained through online sales leads (Table 5). By measuring these different levels, Steel hopes to examine the different stages of the customer's path to pur- chase and to improve its understanding of how DM influences the customer's buying behavior. In addition to setting specific metrics for the different stages of the customer's path to purchase, the metrics are classified in KPIs that indicate the overall performance at each level of the purchase process and other metrics that are linked with KPIs and provide more specific information on how to define overall performance. The second most important goal for Steel's DM activities is to en- hance customer relationships by providing customer service through digital channels. All of the respondents mentioned providing superior service for existing customers as a vital goal for their DM activities. However, the respondents noted that because of its qualitative nature, measuring service quality with WA is difficult. Therefore, they must rely on customer surveys and informal feedback. The third goal established for Steel's DM is to improve brand aware- ness and image. However, the importance of this goal slightly differed between the participants. The major arguments against improving brand awareness and image were that brand is less important in the metal industry relative to other industries and that reliably measuring brand awareness and image is impossible. One participant mentioned that they focus on increasing sales because of difficulties of measuring brand awareness and image. I admit that it is a little bit shortsighted to measure digital marketing performance by comparing costs to produce a sales lead resulting in sales with monetary value. Investing in brand building might yield even better results in the long run, but then again, lead generation metrics make it easy to justify the costs of a campaign and show its direct monetary value. [(Thomas, campaign manager of digital marketing, Steel)] In comparison with Steel, Machinery and Paper encountered more difficulties in designing a holistic WA metrics system. The participants from both companies easily recalled various WA metrics that they use (Table 6) but had more difficulty justifying the selection of those partic- ular metrics. Machinery and Paper have adopted numerous similar met- rics to those used by Steel. However, unlike Steel, they have no clear structure that defines the practical significance of the selected metrics and their relative importance. The reason for this difficulty is partly the result of Paper's and Machinery's inability to specify and prioritize their DM goals, which range from increasing sales and improving brand image to strengthening service processes, creating meaningful content and fostering customer dialogue. In the absence of clearly de- fined DM goals, it is unfeasible for Paper and Machinery to design a met- rics system that would reflect their ultimate DM performance. Furthermore, although Machinery and Paper measure the genera- tion of sales leads, they do not follow how many of these leads result in transactions. Thus, they are unable to link their DM activities with fi- nancial outcomes. We have been planning and working with [digital] measurement issues, but it is always challenging to decide which metrics to include and which not to include. As in all marketing themes, it is particularly challenging to find financial metrics that show our return on investment. We would really need a comprehensive metrics set that we could use to demonstrate the value of our work in monetary terms. For now, we haven't been able to develop a proper system. [(Nancy, team leader of branding, Machinery)] 4.2. Web analytics measurement process Steel had outlined a clear process and clear responsibilities for their use of WA data (Fig. 1). The WA data are automatically collected with Google analytics and a specific online survey (E-space) that randomly targets website visitors with a short survey regarding their website ex- perience. Steel uses these survey data to identify the types of visitors who visit their website and to evaluate how well the website serves dif- ferent customer and other stakeholder needs. Google analytics forms the core of Steel's WA measurement, as it enables them to measure the effectiveness of specific digital marketing activities and to connect these activities with the generation of sales leads. The generated leads are stored in the CRM system (sales force automation), which allows the company to track whether the leads resulted in sales. With the CRM system, Steel is also able to follow the generated leads over time and to determine how they react to various marketing inputs. All customer-related data from digital surveys to campaigns goes directly into our CRM system under a specific customer profile. Leads from a certain campaign are automatically directed to the correct salespersons, and we can follow the yield of such a campaign in real time. [(Charles, customer data expert in digital marketing, Steel)] Although data gathering is automated, it is supervised by Steel's cus- tomer data expert and campaign manager whose main responsibilities 4 A sales lead is a website visitor who displays interest in the company's products or ser- vices and leaves his or her contact information. The definition applies to all three studied companies. 122 J. Järvinen, H. Karjaluoto / Industrial Marketing Management 50 (2015) 117–127
- 7. are to analyze and interpret the data and to draw insights from the data. The DM director coordinates the data analysis, makes detailed inquiries regarding the interpretations, and offers weekly feedback to the team based on the results. Finally, the director summarizes the KPIs and key insights and presents them in a monthly meeting with senior management. Based on the results, management offers feedback to the DM director, who disseminates the information to his team. Such a systematic measurement and reporting process does not exist at Paper or Machinery. On the contrary, the absence of a systematic approach in the deployment of WA was widely discussed in the inter- views and workshops. The respondents from both firms explained that in the course of implementation, they had failed to develop a pro- cess to systematically analyze and report the WA data. The responsibil- ities were considered unclear, and the reporting had been ad hoc. One respondent noted: Honestly, I think that only successful campaigns are reported, because we lack systematic reporting. [(Helen, communications manager of Web services, Paper)] The measurement tools of Paper and Machinery were partly the same as those of Steel. Both companies used Google analytics and online survey applications similar to E-space. However, without a systematic measurement, analysis and reporting process in place, Paper and Machinery were unable to effectively use these tools. Another key dif- ference in comparison with Steel's use of WA was that Machinery and Paper were not able to integrate WA and CRM data. Consequently, the WA data of Paper and Machinery resided in a separate database, which made tracking leads over time and obtaining customer-level insights impossible. 4.3. Web analytics measurement context 4.3.1. Analytics skills and resources Marketers' analytics skills in using WA were found to be inadequate at both Paper and Machinery. Although the study participants rarely mentioned skills as a major obstacle, their lack of skills was apparent from their inability to understand the opportunities offered by WA and to tailor its usage to performance measurement. The selection of metrics for company needs was commonly mentioned as a challenge, and the failure to understand marketing strategy often undermined the selection process. The interviewees' responses showed that when the marketing strategy and key objectives are unclear or abstract, trans- ferring them to actionable WA metrics becomes difficult. In addition to the lack of skills, another related problem at Paper and Machinery was the insufficient human resources dedicated to the use of WA. The re- spondents complained that daily routines occupied so much of their time that they had little time to determine how they could make the most of WA. The same pitfalls in skills and resources were not found at Steel. The study participants from Steel had a clear understanding of their DM strategy, and the WA data were used to measure DM perfor- mance in relation to the strategic objectives and to optimize DM activi- ties to continually improve performance. 4.3.2. Information technology infrastructure Information technology infrastructure was not identified as a major issue for the use of WA at any of the case companies. The study partici- pants from Steel reported that synchronizing WA data with CRM soft- ware was straightforward and that this practice enabled them to tailor their DM actions for specific customers based on their website behavior. Although Paper and Machinery had not linked WA data with CRM, none of the respondents from these companies mentioned this issue as a challenge. The participants were either unaware of this opportunity or did not consider it to be a key issue. Integrating WA data with social an- alytics software was not a topical issue for the studied companies be- cause none of them had significant experience in using such software. Currently, the studied companies were satisfied with the information that their WA tool provided regarding social media performance, that is, how much traffic social media attracted to the website and the subse- quent outcomes. 4.3.3. Senior management commitment The level of senior management commitment to DM and the use of WA substantially varied between Steel and the other companies. At Steel, senior management commitment is evidenced by considerable in- vestment in recruiting an expanding team of specialists to operate the firm's DM and the allocation of substantial monetary resources to DM activities. In addition, the senior management demonstrated substantial interest in the results generated by establishing clear reporting criteria Table 6 Selected Web analytics metrics of Machinery and Paper. Machinery Paper • Traffic volume to website • Number of website visits • Traffic volume to website from search engines/paid online advertisements/ e-mail/social media • Number of unique visitors • Unique website visitors • Sources of website traffic • Page views per visit • Average time spent on website • Time spent on website • Click-through ratea from paid online advertisements • Top pages on website (pages with the most views) • Product demonstration views (videos on website) • Sales leads • Page views on where-to-buy section • Sales leads a Click-through rate: the ratio of clicks to impressions of an online advertisement (e.g., display and search engine advertisements). Table 5 Steel's Web analytics metrics for the different stages of customers' path to purchase. Traffic generation to website Website behavior Revenue & profits Key performance indicators Key performance indicators Key performance indicators • Number of all website visits • Website visit growth (%) • Number of sales leads • Sales leads growth (%) • Conversion ratea • Sales revenue through sales leads • Profits through sales leads Examples of other metrics Examples of other metrics Examples of other metrics Number of website visits and website visit growth (%) driven per traffic source: • Campaign website • Organic search • Paid search • Display advertisements • E-mail • Social media (Twitter, LinkedIn, Facebook, YouTube) (Number of) • Visits in product information pages • Product information sheet downloads • Product comparison tool uses • Product video views • Visits in contact request form • Sales leads per traffic source • Number of sales leads that lead to a transaction • Percentage of sales leads that lead to a transaction • Average costs incurred per sales lead • Number of transactions per traffic source • Sales revenue per traffic source • Profits per traffic source • Costs per traffic source a Conversion rate: the percentage of visitors who take a desired action such as purchasing products, leaving a contact request, subscribing to newsletters, and downloading brochures. 123J. Järvinen, H. Karjaluoto / Industrial Marketing Management 50 (2015) 117–127
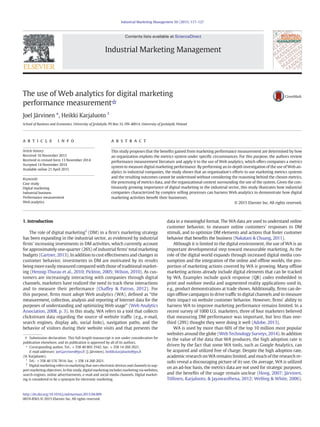
- 8. that the DM team must satisfy monthly and provided constant feedback based on the results. Although only a few participants from Machinery and Paper men- tioned limited budgets and other resources as an obstacle, senior management's low commitment to WA was evidenced by the lack of at- tention to DM performance measurement. In fact, the respondents from both companies reported that senior management had not made any requests to report the performance of DM activities. Moreover, the dig- ital marketers at Paper and Machinery felt that making DM measurable was solely in their own interests. To obtain senior management's per- spective on this issue, we approached the head of marketing and communications at each firm with an interview request. However, both of our requests were politely declined because of the leaders' (self-reported) limited understanding of DM and its performance measurement. 4.3.4. Leadership A lack of leadership was found to be one of the pitfalls in the use of WA at Machinery and Paper. Multiple employees were responsible for measuring DM performance to differing degrees. However, no one was certain who was in charge of the process. In comparison, Steel's DM director was clearly responsible for coordinating the DM perfor- mance measurement process. The director had assigned clear responsi- bilities for each member of his team and was actively participating in the analysis and interpretation of the WA data. In addition, he reported the results to senior management and disseminated the feedback from management to his team. The study data also indicated that Steel's DM team members trusted the director's expertise. For example, when the team members were un- sure about the answer to a question, they typically responded that Jo- seph (the director) would know the answer to the question. It was also mentioned that Joseph has been the company's chief DM advocate and that he initiated the digitization of Steel's marketing strategy. In fact, the interview and the workshop discussions clearly indicated that Joseph genuinely believed in the power of DM and that he was eager to demonstrate the results of his team's efforts. The interviews with other team members indicated that the director had managed to inspire other team members with the same enthusiasm, as was shown by their general belief that DM was finally enabling them to demonstrate the contribution of their daily work. 4.3.5. Organizational culture Two organizational culture issues identified in the case data clearly differentiated Steel's use of WA from that of Machinery and Paper. First, Steel's approach to DM decision making was largely data driven in the sense that it was exploiting WA data to evaluate and learn which DM activities performed best, and this information was used to optimize subsequent DM activities. In comparison, Machinery and Paper relied primarily on their intuition and perception of what activi- ties bring value to customers. The WA data were used as a supplemental source for DM decision making in situations where they wanted to get support for their decisions e.g., when they wished to know whether video clips on the website were receiving any attention. The second organizational culture condition that emerged from the data was related to cooperation and information sharing between the digital marketers. Cooperation was weakest at Machinery, whose DM team was split into branding and digital communications sections. The two sections of the team lacked awareness of one another's activities and a coherent view of DM performance measurement as a result of lim- ited information sharing. Although Paper's DM team is spread across multiple geographic locations, the team members regularly communi- cate and meet to ensure that everyone is aware of one another's tasks and activities. However, Steel's situation, in which the whole team works in the same building, was regarded as the best arrangement to foster cooperation because it enabled the team members to continuous- ly interact and to plan DM activities and measurement practices together. 5. Discussion The study findings provide a number of theoretical contributions. First, although an ample body of literature discusses the inability of Data gathering Website Campaign websites Search engines Online advertising E-mail Social media Results reporting Data analysis & insights Digital marketing activities Tools in use Process phase Actors & communications flow Google Analytics E-Space (online survey) Salesforce (CRM) Google Analytics E-Space (online survey) Salesforce (CRM) PowerPoint Data gathering is automated but supervised by customer data expert and campaign manager The digital marketing director reports the results to the management board Data are refined and interpreted by customer data expert and campaign manager Digital marketing team works together with specified channel responsibilities Corrective actions based on the results Google Analytics E-Space (online survey) Salesforce (CRM) Excel Feedback from the management board Feedback from the digital marketing director Fig. 1. Steel's digital marketing performance measurement process and tools in use. 124 J. Järvinen, H. Karjaluoto / Industrial Marketing Management 50 (2015) 117–127
- 9. marketers to demonstrate the contribution of marketing activities to business outcomes (Li, 2011; O'Sullivan & Abela, 2007; Rust et al., 2004; Stewart, 2009; Wiersema, 2013), this study shows that the ability to demonstrate marketing performance depends on the organization's content, process and context of the marketing metrics system in use. Specifically, the findings emphasize the importance of the following: 1) designing a manageable metrics system that demonstrates the progress toward marketing objectives, 2) establishing a process that fosters the effective use of metrics data within the organization, and 3) ensuring that the organizational context supports the use of the met- rics system. By investigating the use of marketing metrics systems multidimensionally, the study extends Pettigrew et al.'s (1989) frame- work by demonstrating how this framework can be applied to market- ing performance measurement research. As its second major theoretical contribution, this study is the first to demonstrate how industrial companies characterized by complex and lengthy selling processes can harness WA to improve their DM perfor- mance measurement practices. Whereas previous case studies have demonstrated the benefits of WA for measuring marketing performance in e-commerce businesses (Phippen et al., 2004; Wilson, 2010), this study demonstrates that the benefits gained from WA are not limited to those business sectors in which transactions can be processed online. Compared with traditional measurement methods, such as customer surveys and interviews, which are subjective and vulnerable to re- sponse bias, the advantage of WA is its ability to gather objective data on genuine online customer behavior and subsequent business out- comes. Although the actual purchase decision in the industrial sector is often made through personal selling, industrial marketers can use WA to measure, for example, which DM activities attract potential customers to interact with the company, how many sales leads are gen- erated and how many of these leads result in transactions. Consequently, industrial companies that use WA are in a better position to demonstrate the influence of marketing actions on business benefits. Moreover, in agreement with the previous marketing performance measurement lit- erature (O'Sullivan, Abela, & Hutchinson, 2009; Pauwels et al., 2009), the findings demonstrate that reporting the objective and standardized metrics provided by WA to top management increases the influence of industrial marketers in an organization. As its third theoretical contribution, this study illustrates the need for multiple methods in measuring overall marketing performance. The study findings support Seggie et al.'s (2007) assessment that the Internet will diminish the importance of subjective marketing measures and increase the importance of objective measures. However, there is no evidence that objective measures provided by WA would obviate the need for subjective measures. In addition to the fact that WA is largely limited to the digital environment, the study revealed two major weaknesses related to the use of WA data. First, the data provided by WA are backward-looking. That is, they present customer behavior and DM results in retrospect but are less helpful for evaluating the future intentions of customers. Second, WA data are exclusively quantitative and cannot be used to measure the fulfillment of qualitative objectives, such as enhancing brand image and increasing customer satisfaction or positive word-of-mouth that may be ultimately more important for a company with respect to, e.g., maintaining customer relationships. This deficiency is a significant disadvantage, particularly in industrial marketing, in which business relationships are especially important and in which businesses therefore require relationship-specific information to interact with customers (La Rocca & Snehota, 2011). In conclusion, relying solely on WA data may result in suboptimal or harmful marketing decisions. Thus, companies should only use WA data as a component of performance evaluation. This suggestion is supported by numerous studies that demonstrate that selected marketing metrics should reflect short- and long-term as well as financial and non-financial results (Ambler & Roberts, 2008; Clark, 1999; O'Sullivan & Abela, 2007; Rust et al., 2004; Seggie et al., 2007). 5.1. Managerial implications The study has three managerial implications for using WA. First, instead of adopting a variety of WA metrics, managers should primarily focus on designing a manageable metrics system that is linked to the firm's top priority marketing objectives. A vital part of this process is to identify and select firm-specific KPIs with respect to the major mar- keting objectives and to differentiate them from other secondary met- rics. By prioritizing the WA metrics, marketers can focus on the most important marketing objectives and avoid information overload. Once the KPIs are selected, the relevance of other metrics should be evaluated based on the information that they provide in relation to the KPIs. That is, the other metrics should be used to obtain more detailed information on why the overall performance measured by the KPIs is below or above the target. Generally, we recommend that managers create a WA met- rics system that illustrates the interrelationships among the metrics. Steel's metrics system that outlines the different stages of customers' path to purchase is an innovative way to construct a metrics system but is not the only way to do so. Second, to achieve optimal outcomes, managers must plan a system- atic process for managing WA metrics data. Because data gathering can be automated with WA and therefore can be relatively effortless, the largest obstacle in the WA measurement process is to analyze and inter- pret the data to gain meaningful insight and inform marketing deci- sions. Managers can advance the analysis and interpretation of the data by clarifying clear responsibilities for WA users and by appropriate- ly coordinating the process. In addition, managers should ensure that DM outcomes are reported to top management, as observed in Steel's case, where reporting KPIs convinced top management of the contribu- tion of DM to business performance and the feedback from the top man- agement to the digital marketers encouraged and motivated them to continuously develop their activities. Third, managers should ensure that the organizational context sup- ports the use of WA. They must ascertain that WA users have sufficient time and expertise to use the system and acquire new talent if neces- sary. Moreover, we recommend that managers play an active role in co- ordinating WA use and providing feedback regarding DM outcomes. When management has only limited interest in DM outcomes, digital marketers are not motivated to develop a proper metrics system and apply it. Finally, to foster active WA use, the WA users should have a suitable leader. The leader should be able to manage a variety of tasks in the WA use process, including sharing responsibilities with team members, coordinating and participating in the execution of tasks, and creating a culture that fosters cooperation, information sharing, and data-based decision making. 5.2. Limitations and future research The results of this study must be interpreted in light of its limitations. Notably, only three industrial companies were investigated. Thus, the generalizability of the study results may be diminished. By investigating companies from other sectors, we may have encountered other circum- stances that are relevant to WA use and that were not revealed by our case data. The study focused on the use of WA metrics systems, and it is unclear whether the findings are applicable to other marketing metrics systems. Although our findings were largely consistent with previous results re- ported in the marketing performance measurement literature, addition- al research is required to confirm the applicability of our framework to other settings. It is also noteworthy that the study did not examine the external context of organizations with respect to DM performance mea- surement. Future research should investigate how the external context of organizations influences the use of WA and other marketing metrics systems. In addition, the study discusses various benefits regarding the use of WA for DM performance measurement. However, given the 125J. Järvinen, H. Karjaluoto / Industrial Marketing Management 50 (2015) 117–127
- 10. qualitative nature of our study, we cannot demonstrate a causal rela- tionship between the benefits of WA use and firm performance. Finally, although WA is likely the most prominent new technology for DM performance measurement, many other analytics innovations exist, and more analytics innovations are emerging at an increasing pace. For example, the social media revolution has resulted in new so- cial analytics innovations that are used to measure and understand the social behavior of customers in the digital environment and its influence on the marketing performance of firms (Hoffman & Fodor, 2010; Peters, Chen, Kaplan, Ognibeni, & Pauwels, 2013). Although this study supports the perception that business marketers currently do not actively measure their social media performance (Michaelidou, Siamagka, & Christodoulides, 2011) and that they thus have limited in- terest in using social analytics, such attitudes will likely change with the increasing sophistication of analytics tools. Additionally, with the in- creasing use of analytics tools, the amount of data that can be used to evaluate marketing performance is rapidly increasing. Thus, a future challenge is to unify these “big data” in different forms, databases, and platforms to provide a complete understanding of how customers be- have in today's world and to assess marketing performance in this changing environment. Acknowledgements We would like to thank our reviewers for helpful feedback and en- couraging comments during the review process. It is also gratefully ac- knowledged that the preparation of this article was in part supported by the Finnish Funding Agency for Innovation (TEKES) research project funding. The corresponding author also owes thanks to Jenny and Antti Wihuri's Foundation for the financial support granted for his doctoral dissertation project. References Adobe (2013, September). Digital distress: What keeps marketers up at night? Available at: http://www.adobe.com/content/dam/Adobe/en/solutions/digital-marketing/ pdfs/adobe-digital-distress-survey.pdf (Accessed 28 July 2013) Ambler, T. (2000). Marketing metrics. Business Strategy Review, 11(2), 59–66. Ambler, T., Kokkinaki, F., & Puntoni, S. (2004). Assessing marketing performance: Reasons for metrics selection. Journal of Marketing Management, 20, 475–498. Ambler, T., & Roberts, J. (2008). Assessing marketing performance: Don't settle for a silver metric. Journal of Marketing Management, 24(7–8), 733–750. Bititci, U., Nudurupati, S., Turner, T., & Creighton, S. (2002). Web enabled performance mea- surement systems: Management implications. International Journal of Operations & Production Management, 22(11), 1273–1287. Bourne, M., Kennerley, M., & Franco-Santos, M. (2005). Managing through measures: A study of impact on performance. Journal of Manufacturing Technology Management, 16(4), 373–395. Bourne, M., Mills, J., Bicheno, J., Hamblin, D., Wilcox, M., Neely, A., et al. (1999). Performance measurement system design: Testing a process approach in manufacturing compa- nies. International Journal of Business Performance Measurement, 1(2), 154–170. Bourne, M., Mills, J., Wilcox, M., Neely, A., & Platts, K. (2000). Designing, implementing and updating performance measurement systems. International Journal of Operations & Production Management, 20(7), 754–771. Bourne, M., Neely, A., Mills, J., & Platts, K. (2003). Why some performance measurement initiatives fail: Lessons from the change management literature. International Journal of Business Performance Management, 5(2/3), 245–269. Bourne, M., Neely, A., Platts, K., & Mills, J. (2002). The success and failure of performance measurement initiatives: Perceptions of participating managers. International Journal of Operations & Production Management, 22(11), 1288–1310. Bourne, M., & Wilcox, M. (1998). Translating strategy into action. Manufacturing Engineer, 77(3), 109–112. Chaffey, D., & Patron, M. (2012). From web analytics to digital marketing optimization: Increasing the commercial value of digital analytics. Journal of Direct, Data and Digital Marketing Practice, 14(1), 30–45. Clark, B. (1999). Marketing performance measures: History and interrelationships. Journal of Marketing Management, 15(8), 711–732. Clark, B. (2001). A summary of thinking on measuring the value of marketing. Journal of Targeting, Measurement and Analysis for Marketing, 9(4), 357–369. Court, D., Gordon, J., & Perrey, J. (2012). Measuring marketing's worth. McKinsey Quarterly, 3, 113–118. Curren, M., Folkes, V., & Steckel, J. (1992). Explanations for successful and unsuccessful marketing decisions: The decision maker's perspective. Journal of Marketing, 56(April), 18–31. Davenport, T. (2013). Keep up with your quants: An innumerate's guide to navigating big data. Harvard Business Review, 91(7), 120–123. Deighton, J., & Kornfeld, L. (2009). Interactivity's unanticipated consequences for marketers and marketing. Journal of Interactive Marketing, 23(1), 4–10. Digital Marketing Depot (2014). Market intelligence report: Enterprise digital analytics plat- forms. Available at: http://digitalmarketingdepot.com/research_report/enterprise- digital-analytics-platforms-2014-marketers-guide (Accessed 4 August 2014) Eccles, R. (1991). The performance measurement manifesto. Harvard Business Review, 69(1), 131–138. Forza, C., & Salvador, F. (2000). Assessing some distinctive dimensions of performance feedback information in high-performing plants. International Journal of Operations & Production Management, 20(3), 359–385. Franco, M., & Bourne, M. (2004). Are strategic performance measurement systems really effective: A closer look at the evidence. Proceedings of the EurOMA Conference (pp. 163–174). Paris, France: INSEAD. Gartner (2013, 6 Marchh). Key findings from U.S. digital marketing spending survey. Available at: http://www.gartner.com/technology/research/digital-marketing/digital- marketing-spend-report.jsp (Accessed 15 July 2014) Germann, F., Lilien, G., & Rangaswamy, A. (2013). Performance implications of deploying marketing analytics. International Journal of Research in Marketing, 30(2), 114–128. Gigerenzer, G., & Brighton, H. (2009). Homo heuristicus: Why biased minds make better inferences. Topics in Cognitive Science, 1(1), 107–143. Guercini, S. (2012). New approaches to heuristic processes and entrepreneurial cognition of the market. Journal of Research in Marketing and Entrepreneurship, 14(2), 199–213. Guercini, S., La Rocca, A., Runfola, A., & Snehota, I. (2014). Interaction behaviors in busi- ness relationships and heuristics: Issues for management and research agenda. Industrial Marketing Management, 43(6), 929–937. Hacker, M., & Brotherton, P. (1998). Designing and installing effective performance mea- surement systems. IIE Solutions, 30(8), 18–23. Hennig-Thurau, T., Malthouse, E., Friege, C., Gensler, S., Lobschat, L., Rangaswamy, A., et al. (2010). The impact of new media on customer relationships. Journal of Service Research, 13(3), 311–330. Hill, D., Koelling, C., & Kurstedt, H. (1993). Developing a set of indicators for measuring information-oriented previous performance. Computers & Industrial Engineering, 24(3), 379–390. Hoffman, D., & Fodor, M. (2010). Can you measure the ROI of your social media marketing? MIT Sloan Management Review, 52(1), 41–49. Hong, I. (2007). A survey of Web site success metrics used by Internet-dependent organi- zations in Korea. Internet Research, 17(3), 272–290. Järvinen, J., Töllinen, A., Karjaluoto, H., & Jayawardhena, C. (2012). Digital and social media marketing usage in B2B industrial section. Marketing Management Journal, 22(2), 102–117. Järvinen, J., Töllinen, A., Karjaluoto, H., & Platzer, E. (2012). Web analytics and social media monitoring in industrial marketing: Tools for improving marketing communi- cation measurement. Proceedings of the 41st Academy of Marketing Science Annual Conference (pp. 477–486). New Orleans, LA, United States: Springer International Publishing. Johnston, R., Brignall, S., & Fitzgerald, L. (2002). Good enough performance measurement: A trade-off between activity and action. Journal of the Operational Research Society, 53(3), 256–262. Kannan, P. K., Pope, B. K., & Jain, S. (2009). Pricing digital content product lines: A model and application for the National Academies Press. Marketing Science, 28(4), 620–636. Kaplan, R. S., & Norton, D. P. (1992). The balanced scorecard—Measures that drive perfor- mance. Harvard Business Review, 70(1), 71–79. Kaplan, R., & Norton, D. (1996). Using the balanced scorecard as a strategic management system. Harvard Business Review, 74(1), 75–85. Keegan, D., Eiler, R., & Jones, C. (1989). Are your performance measures obsolete? Management Accounting, 12(June), 45–50. Kennerley, M., & Neely, A. (2002). A framework of the factors affecting the evolution of performance measurement systems. International Journal of Operations & Production Management, 22(11), 1222–1245. La Rocca, A., & Snehota, I. (2011). Knowledge in use when actors interact in business relationships. IMP Journal, 5(2), 79–93. Lamberti, L., & Noci, G. (2010). Marketing strategy and marketing performance measure- ment system: Exploring the relationship. European Management Journal, 28(2), 139–152. Lebas, M. (1995). Performance measurement and performance management. International Journal of Production Economics, 41(1–3), 23–35. Lehmann, D. R. (2004). Metrics for making marketing matter. Journal of Marketing, 68(October), 73–75. Lenskold, J. (2002). Marketing ROI: Playing to win. Marketing Management, 11(3), 30–34. Li, L. (2011). Marketing metrics' usage: Its predictors and implications for customer relationship management. Industrial Marketing Management, 40(1), 139–148. Lilien, G. (2011). Bridging the academic — Practitioner divide in marketing decision models. Journal of Marketing, 75(July), 196–210. Lingle, J., & Schiemann, W. (1996). From balanced scorecard to strategy gauges: Is mea- surement worth it? Management Review, 85(3), 56–62. Lipe, M. G., & Salterio, S. E. (2000). The balanced scorecard: Judgmental effects of common and unique performance measures. Accounting Review, 75(3), 283–298. Lipe, M., & Salterio, S. (2002). A note on the judgmental effects of the balanced scorecard's information organization. Accounting, Organizations and Society, 27(6), 531–540. Lodish, L. M., Curtis, E., Ness, M., & Simpson, M. K. (1988). Decision calculus model at Syntex Laboratories. Interfaces, 18(1), 5–20. Lynch, R., & Cross, K. (1991). Measure up!: The essential guide to measuring business performance. London: Mandarin. 126 J. Järvinen, H. Karjaluoto / Industrial Marketing Management 50 (2015) 117–127
- 11. Marchand, M., & Raymond, L. (2008). Researching performance measurement systems — An information systems perspective. International Journal of Operations and Production Management, 28(7), 663–686. Martinez, V., Pavlov, A., & Bourne, M. (2010). Reviewing performance: An analysis of the structure and functions of performance management reviews. Production Planning & Control, 21(1), 70–83. McAfee, A., & Brynjolfsson, E. (2012). Big data: The management revolution. Harvard Business Review, 90(10), 61–68. McCunn, P. (1998). The balanced scorecard… the eleventh commandment. Management Accounting, 76(11), 34–36. McGovern, G., Court, D., Quelch, J., & Crawford, B. (2004). Bringing customers into the boardroom. Harvard Business Review, 82(11), 70–80. Michaelidou, N., Siamagka, N., & Christodoulides, G. (2011). Usage, barriers and measure- ment of social media marketing: An exploratory investigation of small and medium B2B brands. Industrial Marketing Management, 40(7), 1153–1159. Miles, M., Huberman, A., & Saldaña, J. (2013). Qualitative data analysis: A methods source- book (3rd ed.). Thousand Oaks, CA: Sage. Mintz, O., & Currim, I. S. (2013). What drives managerial use of marketing and financial metrics and does metric use affect performance of marketing-mix activities. Journal of Marketing, 77(March), 17–40. Morgan, N., Clark, B., & Gooner, R. (2002). Marketing productivity, marketing audits, and systems for marketing performance assessment: Integrating multiple perspectives. Journal of Business Research, 55(5), 363–375. Nakatani, K., & Chuang, T. -T. (2011). A web analytics tool selection method: An analytical hierarchy process approach. Internet Research, 21(2), 171–186. Natter, M., Mild, A., Wagner, U., & Taudes, A. (2008). Planning new tariffs at tele.ring: The application and impact of an integrated segmentation, targeting, and positioning tool. Marketing Science, 27(4), 600–609. Neely, A., & Bourne, M. (2000). Why measurement initiatives fail. Measuring Business Excellence, 4(4), 3–6. Neely, A., Mills, J., Gregory, M., Richards, H., Platts, K., & Bourne, M. (1996). Getting the measure of your business. London: Findlay. Neely, A., Mills, J., Platts, K., Richards, H., Gregory, M., Bourne, M., et al. (2000). Performance measurement system design: Developing and testing a process-based approach. International Journal of Operations & Production Management, 20(10), 1119–1145. Neely, A., Richards, H., Mills, J., Platts, K., & Bourne, M. (1997). Designing performance measures: A structured approach. International Journal of Operations & Production Management, 17(11), 1131–1152. Nemetz, P. (1990). Bridging the strategic outcome measurement gap in manufacturing organizations. In J. Ettlie, M. Burstein, & A. Fiegenbaum (Eds.), Manufacturing strategy: The research agenda for the next decade. Boston: Kluwer. Nudurupati, S., & Bititci, U. (2005). Implementation and impact of IT enabled performance measurement. Production Planning and Control, 16(2), 152–162. O'Sullivan, D., & Abela, A. (2007). Marketing performance measurement ability and firm performance. Journal of Marketing, 71(April), 79–93. O'Sullivan, D., Abela, A., & Hutchinson, M. (2009). Marketing performance measurement and firm performance: Evidence from the European high-technology sector. European Journal of Marketing, 43(5/6), 843–862. Patterson, L. (2007). Taking on the metrics challenge. Journal of Targeting, Measurement and Analysis for Marketing, 15(4), 270–276. Pauwels, K., Ambler, T., Clark, B., LaPointe, P., Reibstein, D., Skiera, B., et al. (2009). Dash- boards as a service: Why, what, how, and what research is needed? Journal of Service Research, 12(2), 175–189. Peters, K., Chen, Y., Kaplan, A. M., Ognibeni, B., & Pauwels, K. (2013). Social media met- rics — A framework and guidelines for managing social media. Journal of Interactive Marketing, 27(4), 281–298. Pettigrew, A., Whipp, R., & Rosenfield, R. (1989). Competitiveness and the management of strategic change processes. In A. Francis, & P. Tharakan (Eds.), The competitiveness of European industry: Country policies and company strategies. London: Routledge. Phippen, A., Sheppard, L., & Furnell, S. (2004). A practical evaluation of Web analytics. Internet Research, 14(4), 284–293. Pickton, D. (2005). Left brain marketing planning: A Forrester Research viewpoint. Marketing Intelligence & Planning, 23(6), 537–542. Russell, M. (2010). A call for creativity in new metrics for liquid media. Journal of Interactive Advertising, 9(2), 44–61. Rust, R., Ambler, T., Carpenter, G., Kumar, V., & Srivastava, R. (2004). Measuring marketing productivity: Current knowledge and future directions. Journal of Marketing, 68(4), 76–89. Schneiderman, A. (1999). Why balanced scorecards fail. Journal of Strategic Performance Measurement, 6–11. Seggie, S., Cavusgil, E., & Phelan, S. (2007). Measurement of return on marketing investment: A conceptual framework and the future of marketing metrics. Industrial Marketing Management, 36(6), 834–841. Silva-Risso, J. M., Bucklin, R. E., & Morrison, D. G. (1999). A decision support system for planning manufacturers' sales promotion calendars. Marketing Science, 18(3), 274–300. Simons, R. (1991). Strategic orientation and top management attention to control systems. Strategic Management Journal, 12(1), 49–62. Stewart, D. (2009). Marketing accountability: Linking marketing actions to financial results. Journal of Business Research, 62(6), 636–643. Web Analytics Association (2008, September). Web Analytics Definitions. Available at: http://www.digitalanalyticsassociation.org/Files/PDF_standards/ WebAnalyticsDefinitions.pdf (Accessed 18 July 2014) Web Technology Surveys (2014, June). Usage of traffic analysis tools for websites. Available at: http://w3techs.com/technologies/overview/traffic_analysis/all (Accessed 6 July 2014) Webster, F., Malter, A., & Ganesan, S. (2005). The decline and dispersion of marketing competence. MIT Sloan Management Review, 46(4), 35–43. Weischedel, B., & Huizingh, E. (2006). Website optimization with Web metrics: A case study. Proceedings of the 8th International Conference on Electronic Commerce (pp. 463–470). Welling, R., & White, L. (2006). Web site performance measurement: Promise and reality. Managing Service Quality, 16(6), 654–670. Wiersema, F. (2013). The B2B agenda: The current state of B2B marketing and a look ahead. Industrial Marketing Management, 42(4), 470–488. Wilson, R. D. (2010). Using clickstream data to enhance business-to-business web site performance. Journal of Business & Industrial Marketing, 25(3), 177–187. Wouters, M., & Sportel, M. (2005). The role of existing measures in developing and implementing performance measurement systems. International Journal of Operations & Production Management, 25(11), 1062–1082. Yin, R. (1981). The case study crisis: Some answers. Administrative Science Quarterly, 26(1), 58–65. Zoltners, A., & Sinha, P. (2005). Sales territory design: Thirty years of modeling and implementation. Marketing Science, 24(3), 313–331. Joel Järvinen is a PhD candidate in the marketing program at Jyväskylä University School of Business and Economics. His research interests include marketing performance measurement, Web analytics and digital marketing in the business-to-business context. Heikki Karjaluoto is Professor of Marketing at the University of Jyväskylä, Finland. His research interests include marketing communications, electronic business, and customer value. Previous publications have appeared in the European Journal of Marketing, Electronic Markets, the Journal of Business & Industrial Marketing, Telecommunications Policy, and elsewhere. 127J. Järvinen, H. Karjaluoto / Industrial Marketing Management 50 (2015) 117–127